4072
T1 and T2 mapping of the placenta and fetal brain with magnetic resonance fingerprinting (MRF) during maternal hyperoxia1Fetal-Neonatal Neuroimaging Developmental Science Center, Boston Children's Hospital, Boston, MA, United States, 2Athinoula A. Martinos Center for Biomedical Imaging, Massachusetts General Hospital, Boston, MA, United States, 3Harvard-MIT Health Sciences and Technology, IMES, Massachusetts Institute of Technology, Cambridge, MA, United States, 4Electrical Engineering and Computer Science, Massachusetts Institute of Technology, Cambridge, MA, United States
Synopsis
Quantitative MRI may improve diagnosis and monitoring of placental disease by characterizing baseline oxygen content and dynamic oxygen transport during hyperoxia. MRF permits fast quantitative imaging of the adult brain and heart, but use during pregnancy targeting the placenta and fetal brain presents challenges due to motion and large B1+ variation. We tested the accuracy of MRF in phantoms and then scanned pregnant mothers, estimating T1 and T2 of the placenta and fetal brain. MRF-based T1 and T2 mapping is a promising technique to determine placental oxygenation at baseline and oxygenation changes in the placenta and fetal brain after hyperoxia.
Introduction
Noninvasive methods to diagnose and monitor placental function are needed. MRI has the potential to resolve physiology related to oxygen transport through the placenta to the fetal brain, but faster quantitative mapping techniques are needed to freeze maternal and fetal motion, and to capture time-varying physiology. Placental Δ(1/T2*) or ΔR2* mapping during maternal normoxia-hyperoxia protocols is sensitive to underlying placental disease,1 but diagnoses using ΔR2* alone are hampered by large signal variations between subjects.2 T1 and T2 are sensitive to placental physiology3 and blood oxygenation,4 but fast and robust quantitative techniques are needed. We implemented slice profile and B1+ corrected MRF capable of producing T1 and T2 maps in nine seconds per slice, and tested it on phantoms to determine accuracy in the pregnant abdomen. We then acquired relaxivity maps during maternal breath hold, at baseline and during hyperoxia, to determine T1 and T2 of the placenta and fetal brain. Fast T1 and T2 mapping methods are a critical next step toward understanding baseline placental physiology and oxygen transport.Methods
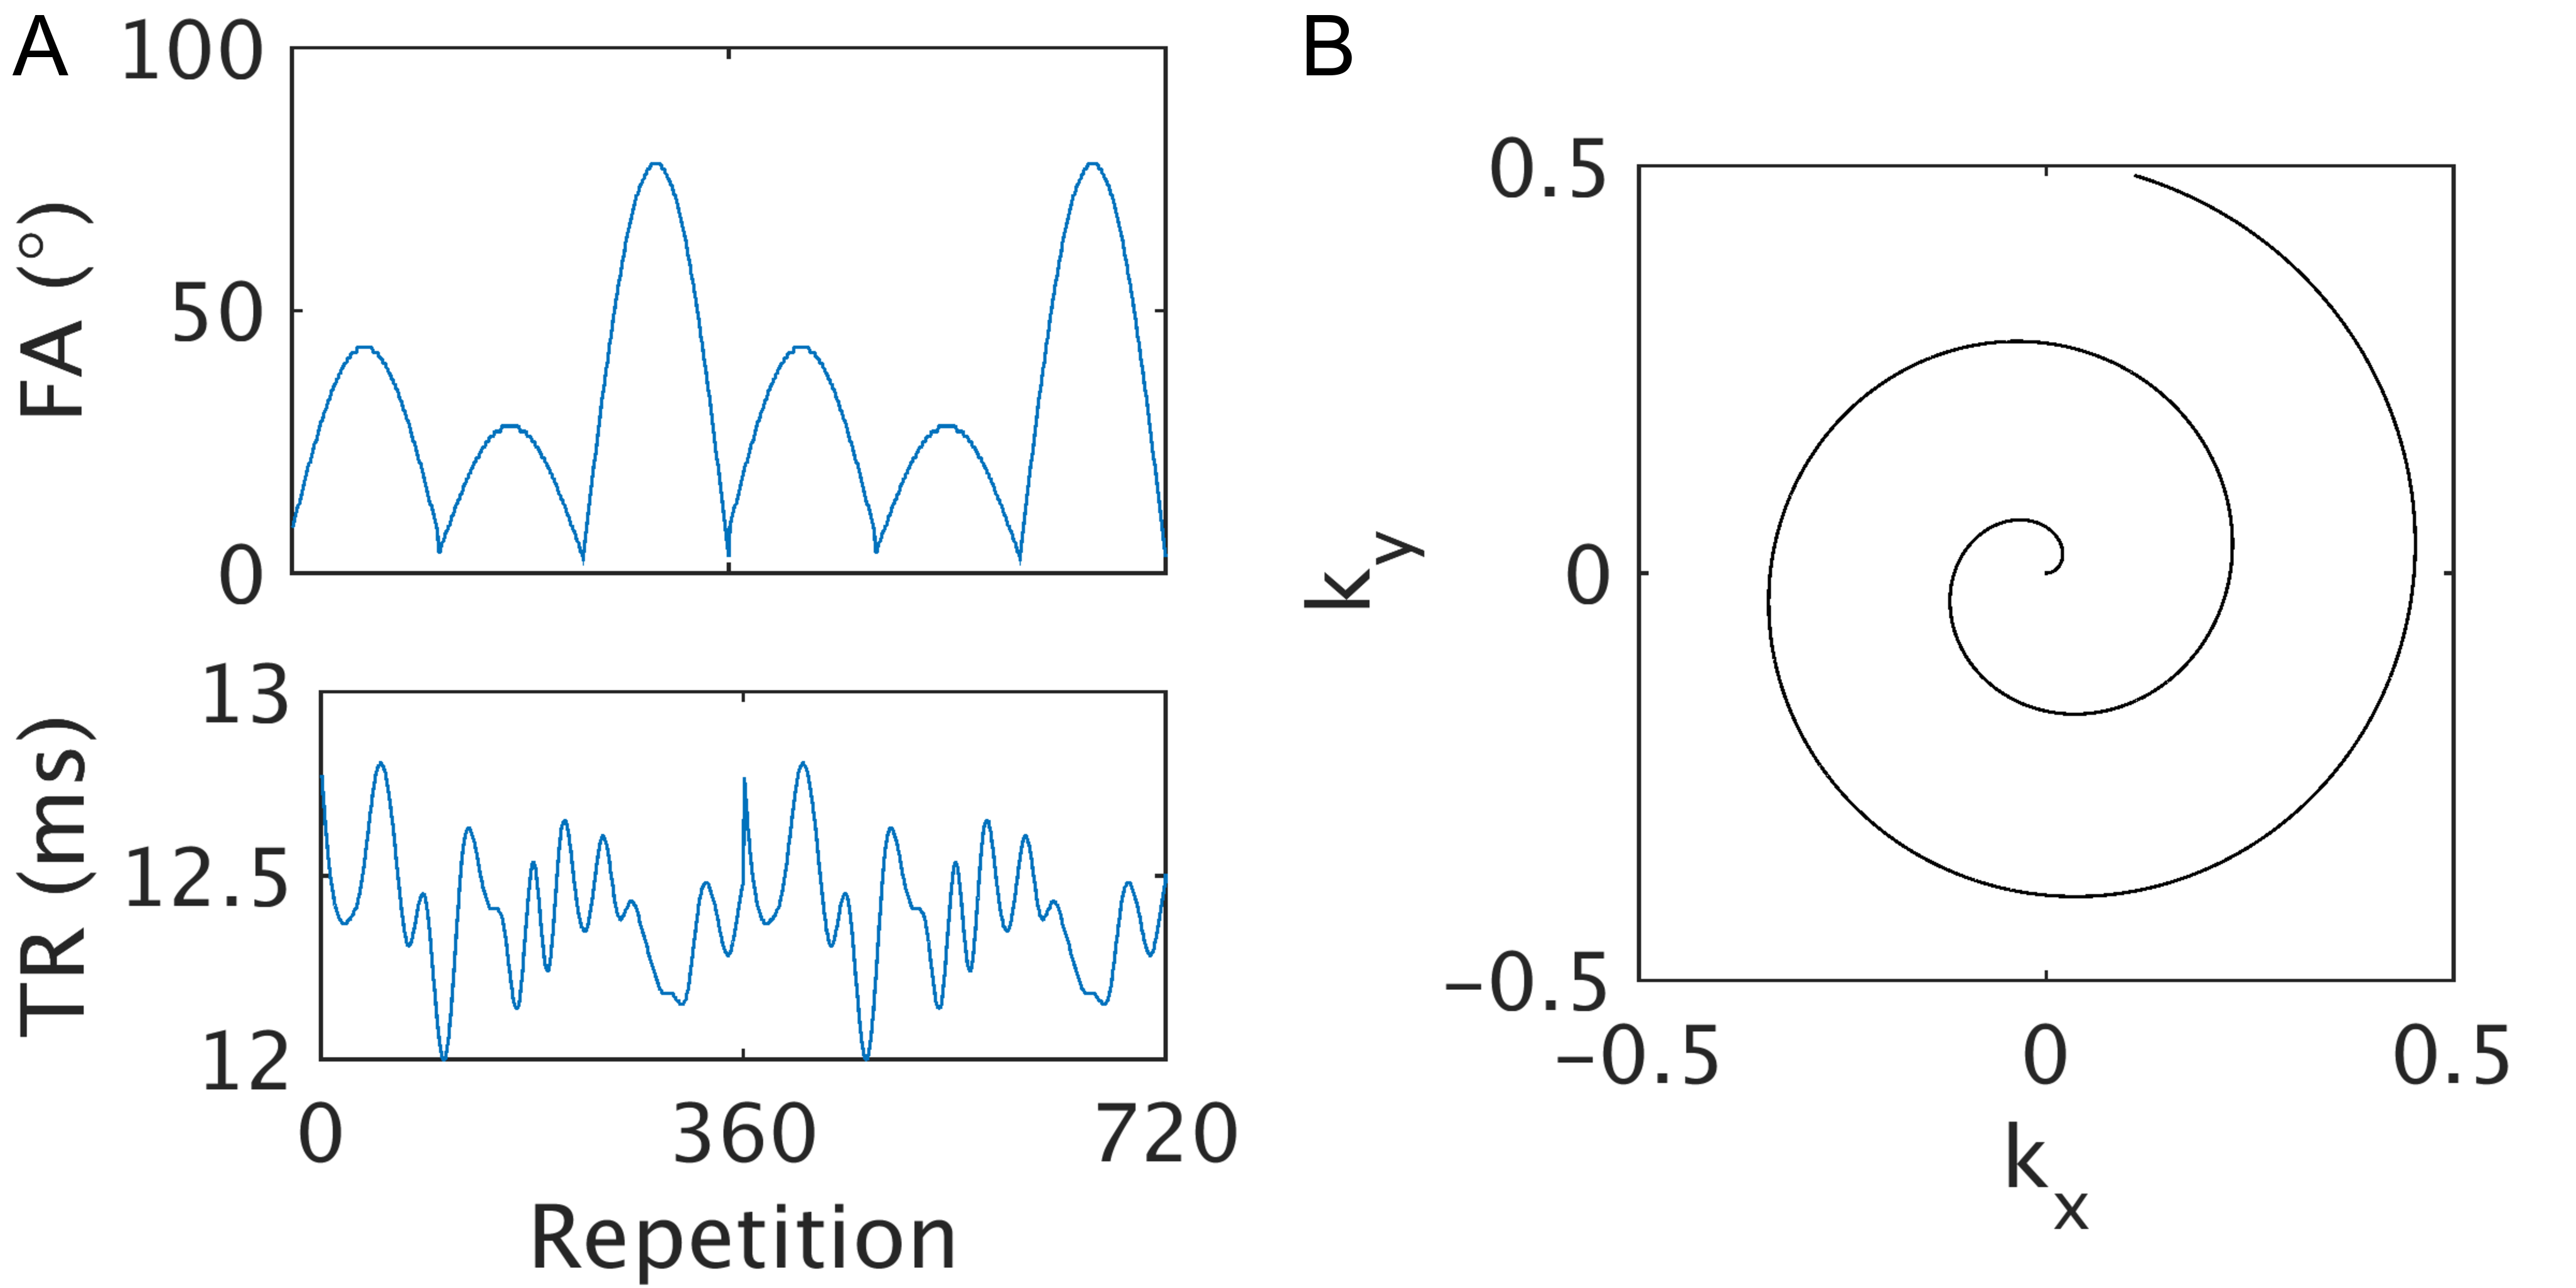
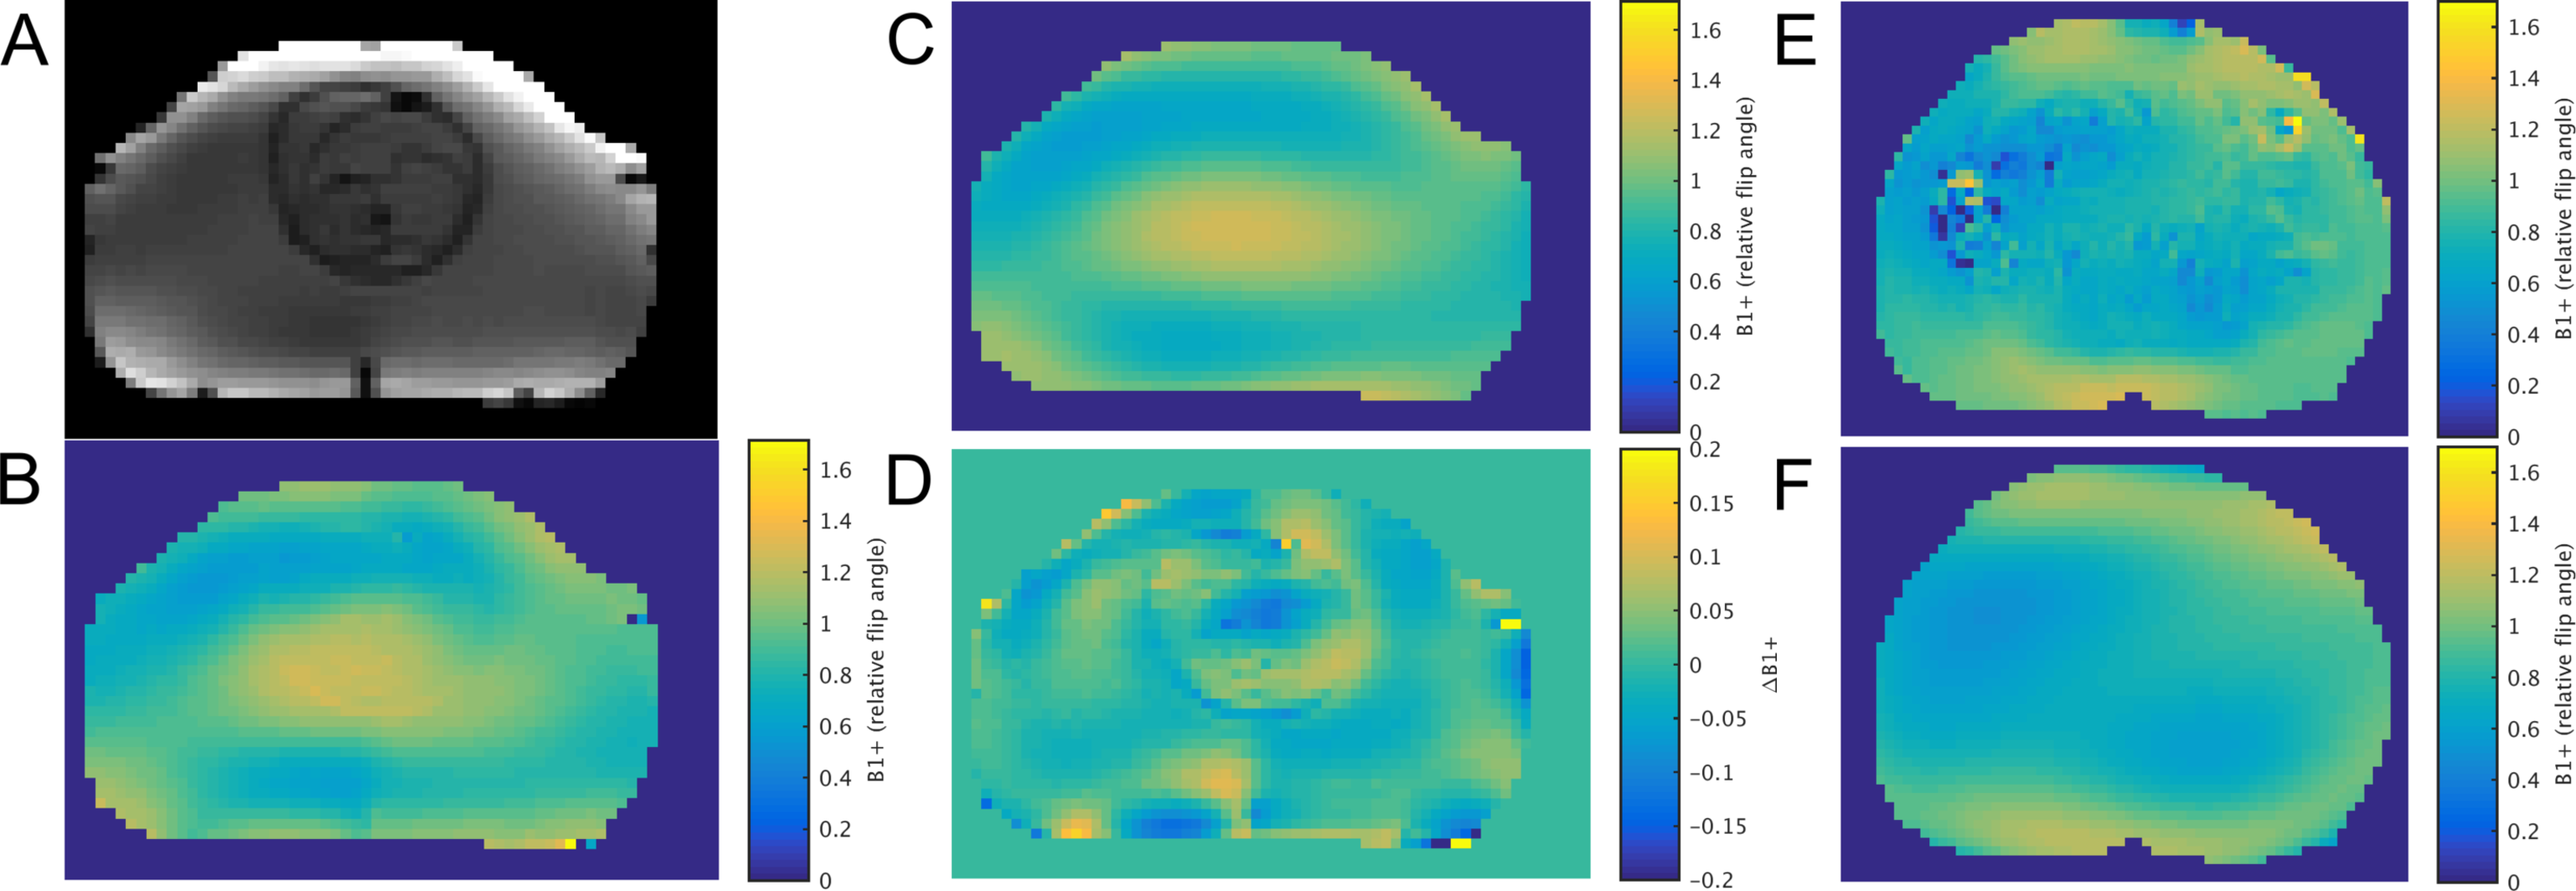
Ten pregnant women (mean gestational age (GA) 32.6 weeks) were scanned with IRB approval on a Siemens 3T scanner while breathing room air and after breathing 100% oxygen for 5 or 10 minutes. Validation scans were performed on the National Institute of Standards and Technology (NIST) MRI System Phantom and an anthropomorphic 22-week fetal phantom,5,6 with spin echo imaging with and without inversion recovery to determine ground truth T1 and T2, respectfully. Single-slice inversion-recovery FISP MRF7 was used with acquisition parameters shown in Figure 1, resolution=3x3x4mm3, field of view=390mm, echo time=2.7ms, acquisitions=720, total time (TA)=9s during maternal breath hold. Pre-saturation turbo-flash (TA=30s) was used to estimate B1+ maps, which were smoothed to compensate for motion corruption by fitting with a 6th-order polynomial (Figure 2). T1 and T2 parameter maps were determined by the sliding window method.8 B1+ and slice profile correction were performed by approximating the slice profiles for all excitations as a scaled versions of the profile for the maximum achieved flip angle for each B1+ value, and then using B1+ as prior information during parameter matching.9,10 Regions of interest (ROI) in the placenta and fetal brain were drawn manually.Results
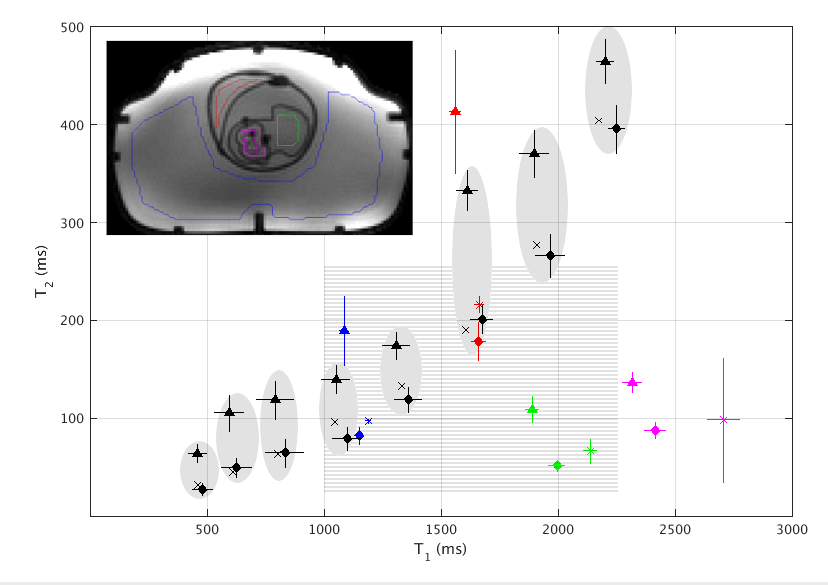
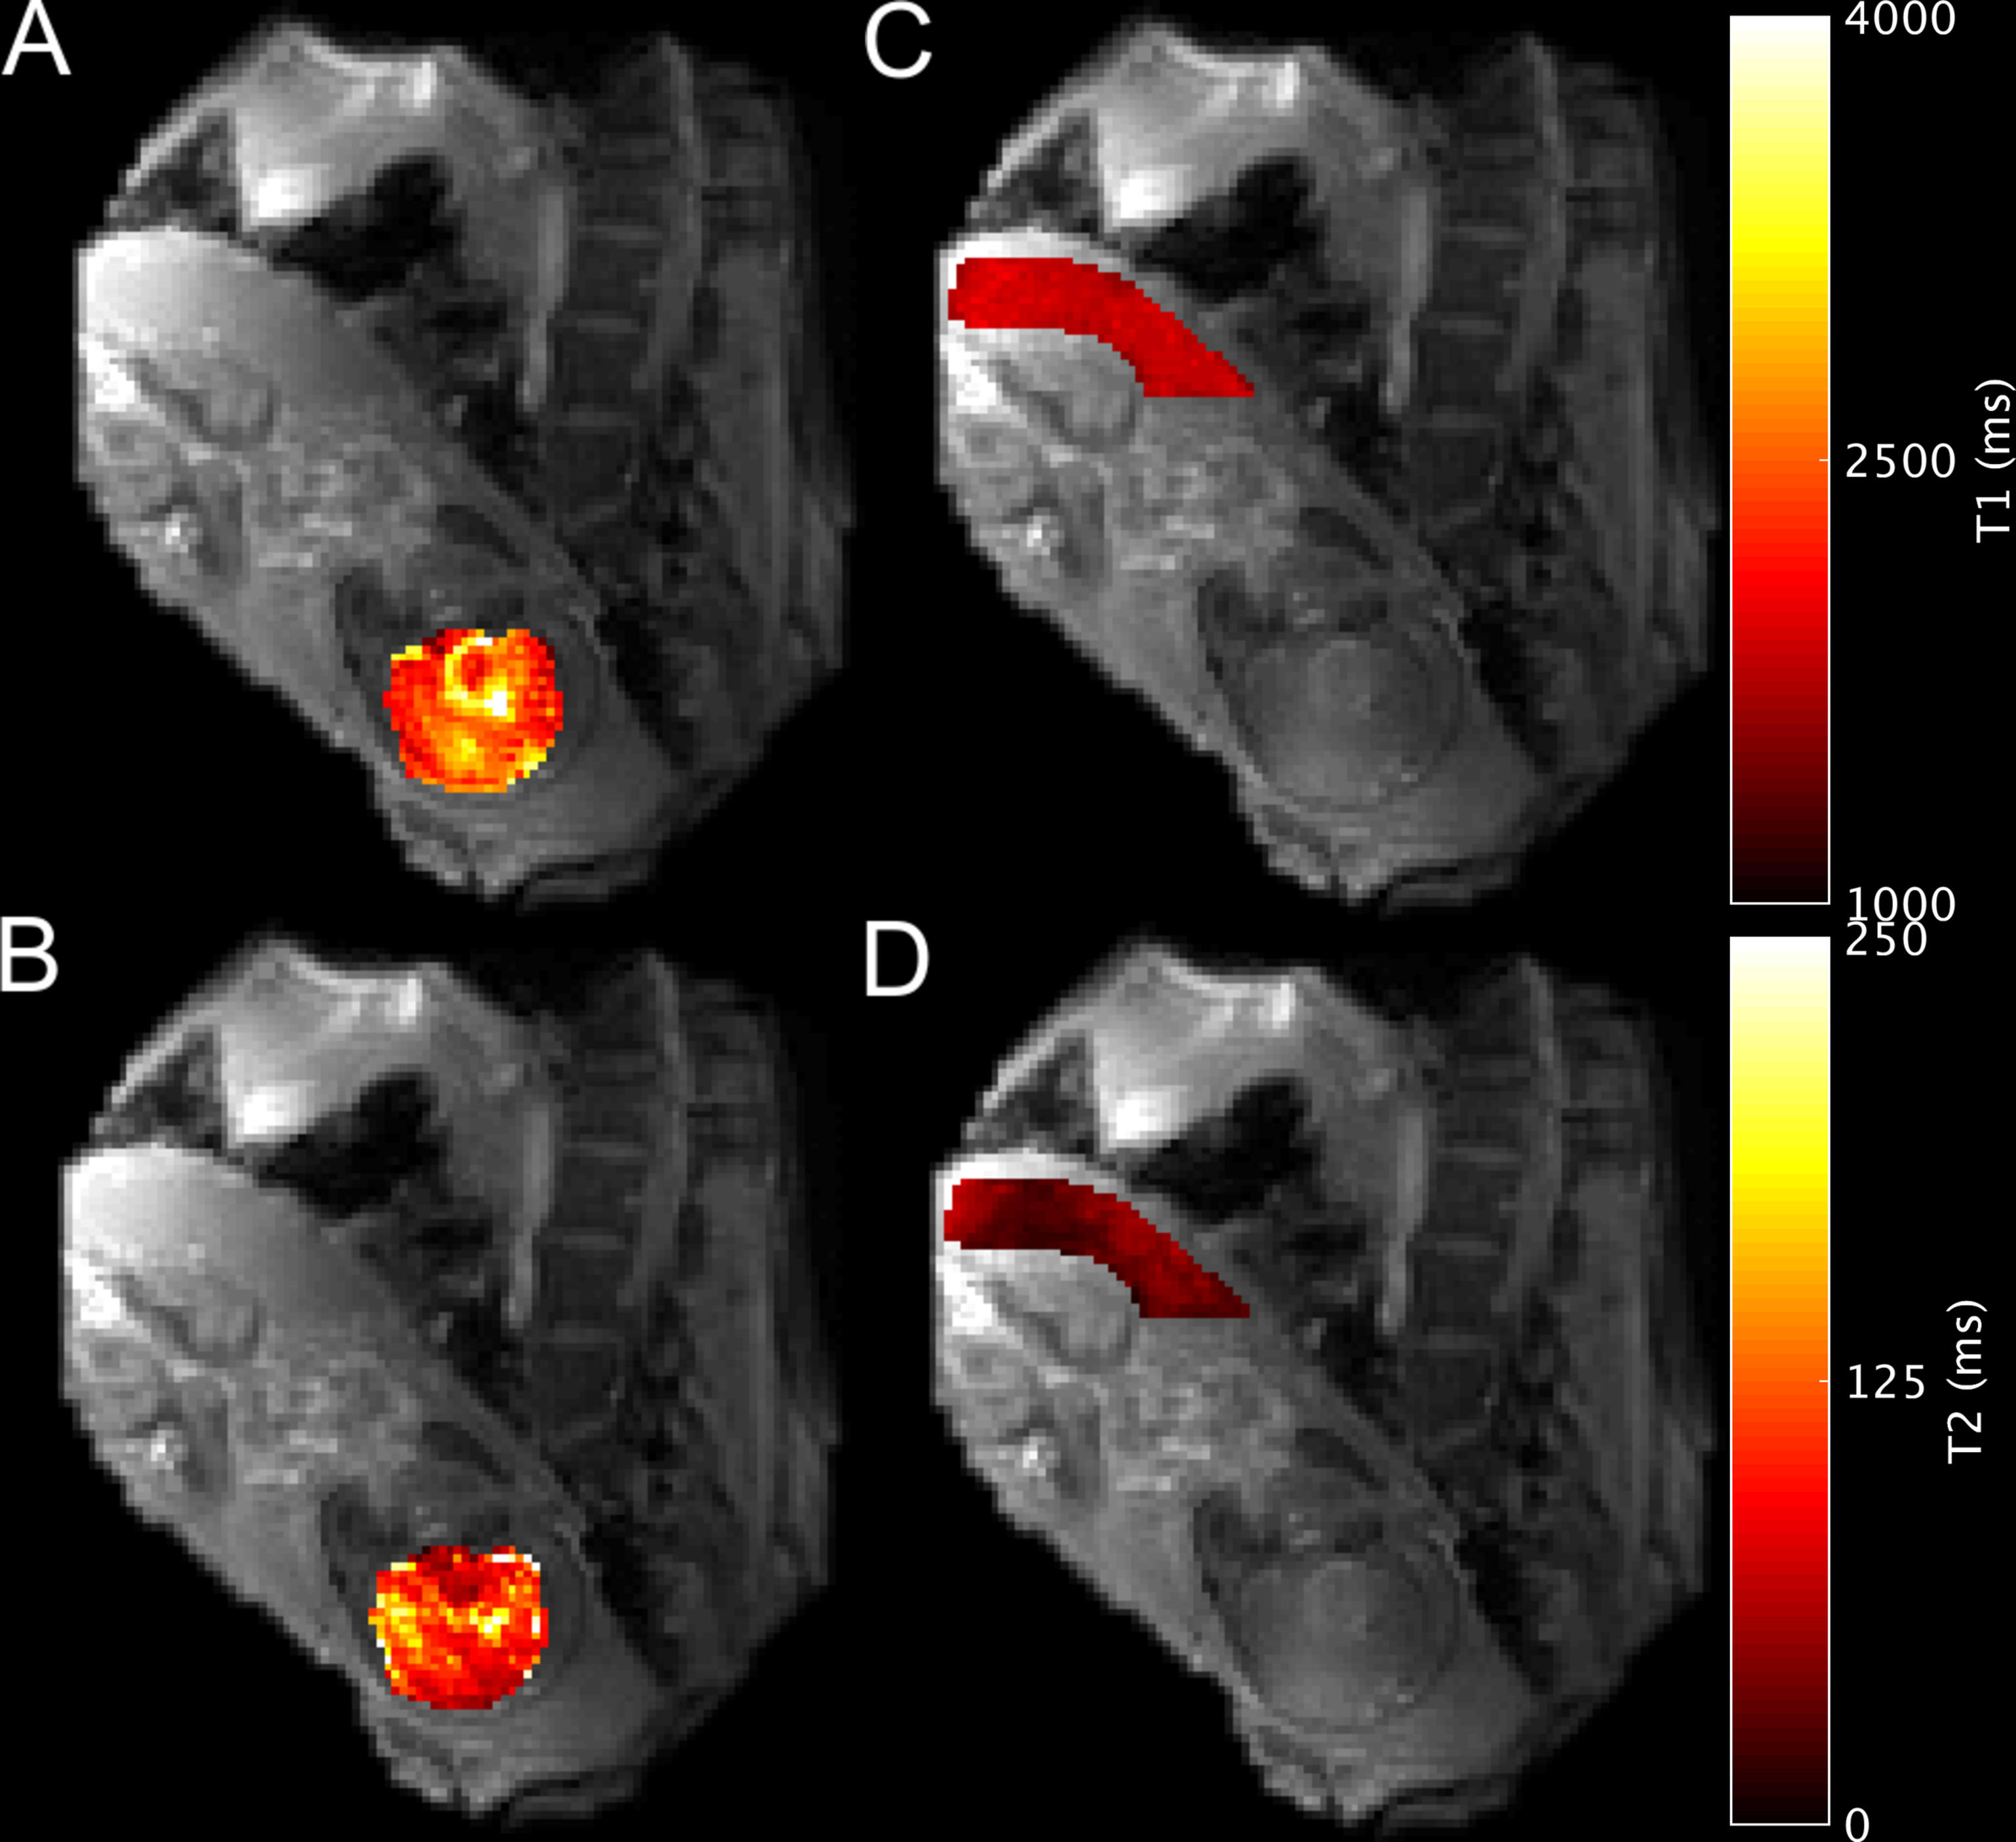
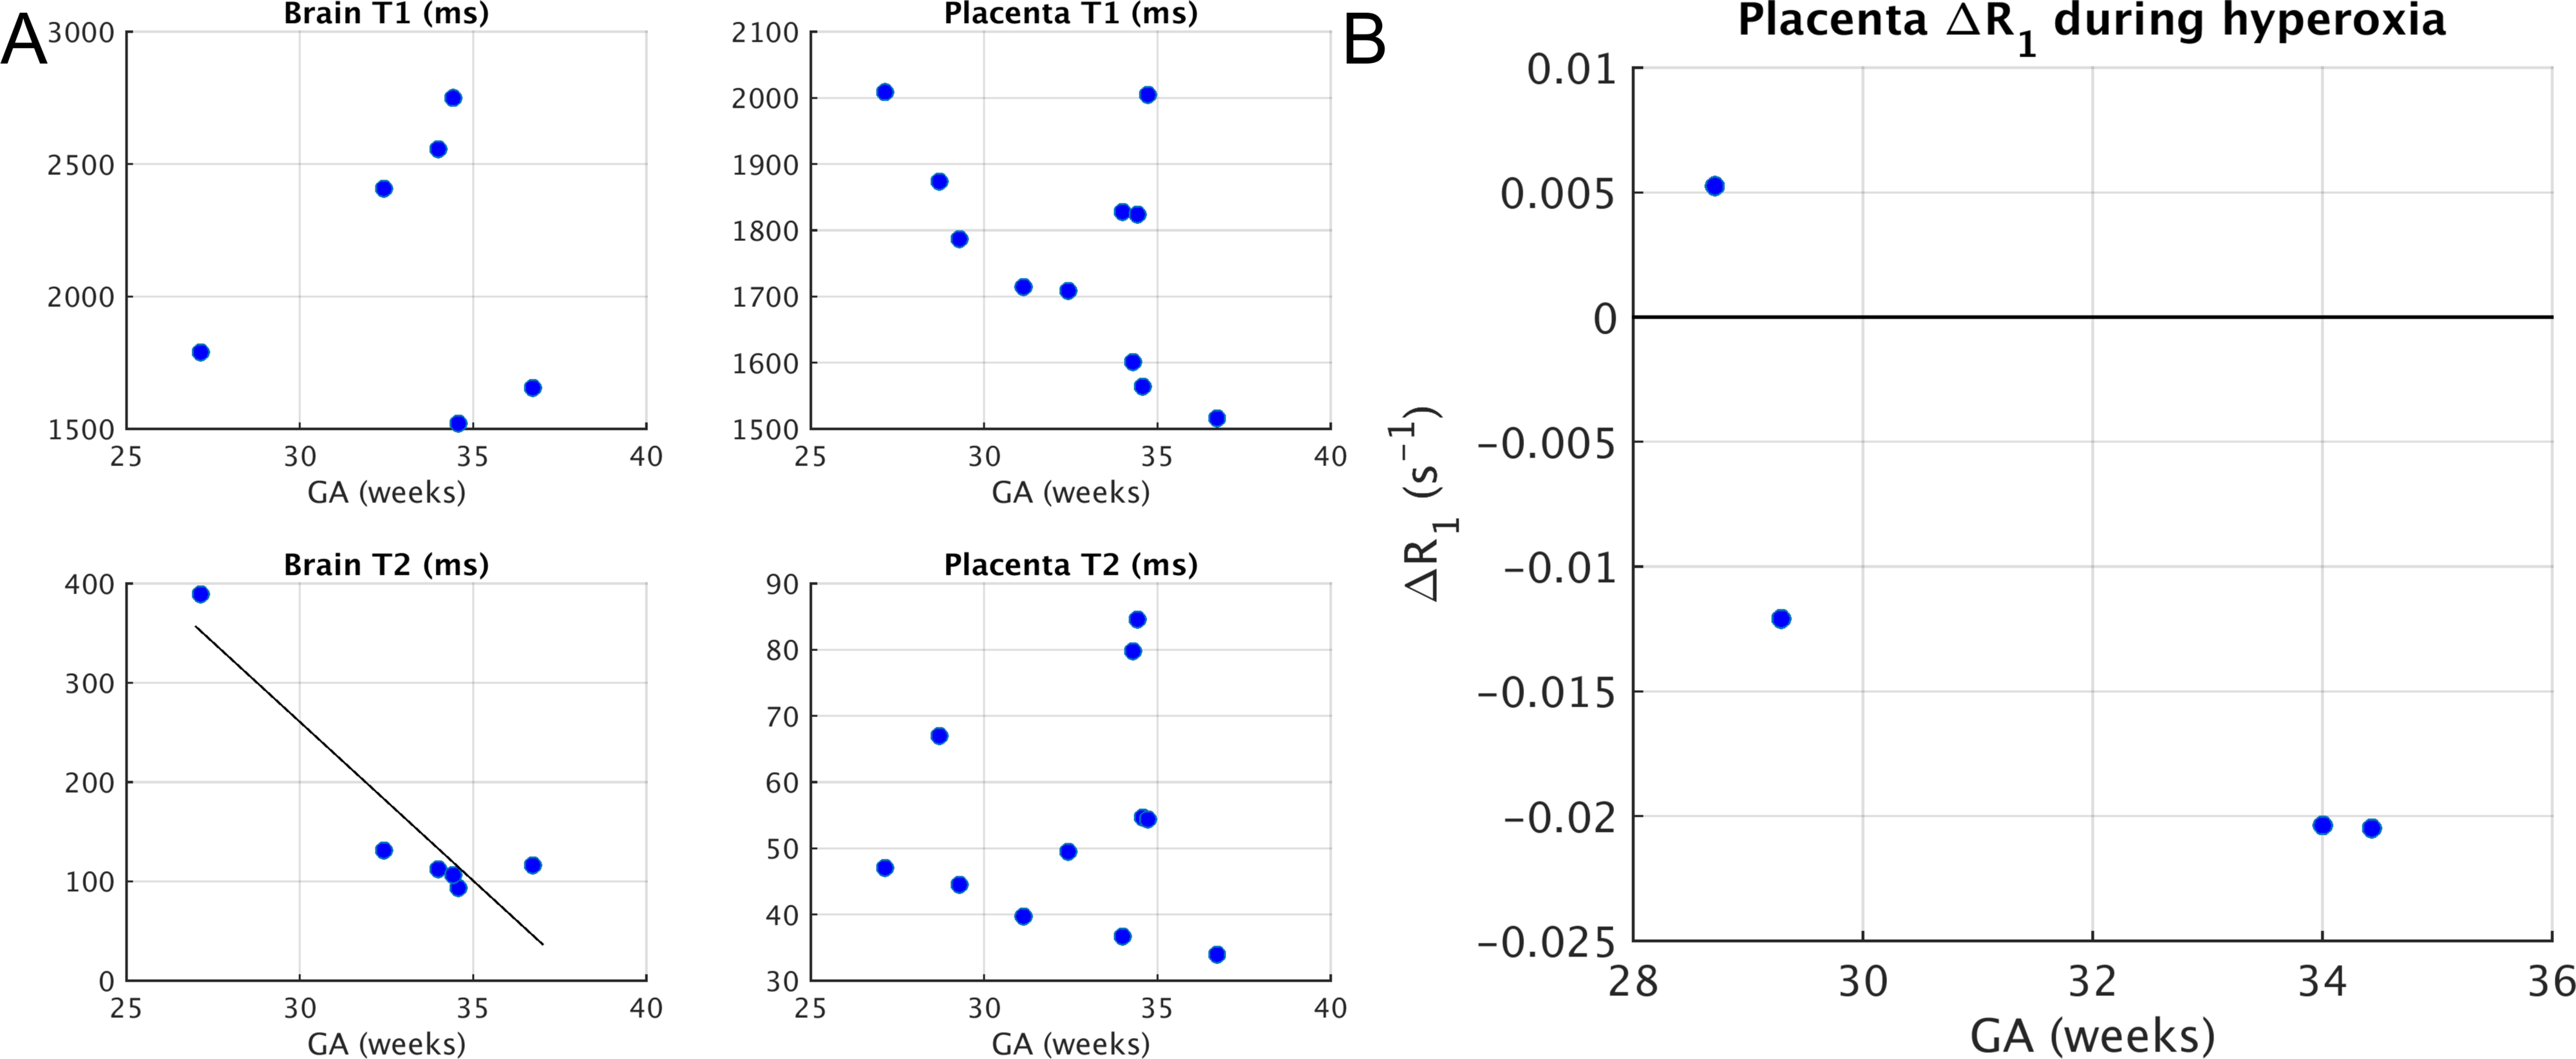
Figure 3 shows MRF phantom performance, and the corrections for B1+ and slice profile non-idealities in the large B1+ range we observed (e.g. 73% change across abdomen). Observed mean absolute errors for the relaxivity range of fetal tissue were 57 ms (4%) for T1 and 18 ms (15%) for T2. Example in vivo relaxivity maps are shown in Figure 4. Baseline placenta T1=1770±173ms and T2= 55±7ms (mean±st.dev.). Baseline brain T1=2112±521ms and T2=158±114ms, for N=6 subjects (mean GA=33.2weeks). Placental Δ(1/T1) or ΔR1 between normoxia and hyperoxia when subjects with contractions were excluded (N = 4) was -0.012±0.012s-1. Figure 5 shows correlations between T1, T2 and ΔR1 with GA (brain T2 was statistically significant).Discussion
Quantitative imaging to probe oxygen transport dynamics in pregnancy holds great promise, and we demonstrate one approach to fast, simultaneous T1 and T2 mapping using MRF. Our MRF implementation showed accuracy similar to previous studies.11 The baseline trend in placental T1 with GA and the overall mean T1 agrees with the literature.3,12 The significant correlation between fetal brain T2 and GA is similar to previous reports of T2* and GA.13 The observed mean negative placental ΔR1, against the backdrop of several reports of positive ΔR1,14,15 requires further investigation. It could be due to physiological noise affecting our comparatively short (9 sec versus ~3 min) measurement, differences in sensitivity to the various blood compartments in the placenta since maternal arterial blood is the only compartment that theoretically should show a positive ΔR1 with hyperoxia, or MRF measurement error. Next, we will make multiple MRF measurements at baseline and during hyperoxia to determine the magnitude of the physiological variations. With continued refinement of the MRF technique to improve its accuracy for fetal imaging via magnetization preparation,16 implementation of optimal TR/FA progression,17 and motion correction,18 parameter maps could permit a more detailed analysis of the partial pressure of oxygen, blood oxygen saturation and hematocrit in the placenta.Conclusion
MRF holds promise for the quantitative imaging of the placenta and fetal brain, and may lead to metrics of placental physiology and oxygen transport dynamics from the mother to the fetus. Work is needed to refine MRF for use in the pregnant abdomen by correcting for motion and by targeting relaxivity ranges not found in the adult brain.Acknowledgements
NIBIB R01EB017337 “Advanced fetal imaging”, NICHD U01HD087211 “Noninvasive realtime assessment of placental structure and function with novel MR imaging methods”, and NIBIB R01EB017219, “Magnetic Resonance Fingerprinting (MRF) for Improved High Field MR.”References
1. Luo, J. et al. In Vivo Quantification of Placental Insufficiency by BOLD MRI: A Human Study. Sci. Rep. 7, 3713 (2017).
2. Sinding, M. et al. Placental baseline conditions modulate the hyperoxic BOLD-MRI response. Placenta 61, 17–23 (2018).
3. Wright, C. et al. Magnetic resonance imaging relaxation time measurements of the placenta at 1.5 T. Placenta 32, 1010–1015 (2011).
4. Portnoy, S., Milligan, N., Seed, M., Sled, J. G. & Macgowan, C. K. Human umbilical cord blood relaxation times and susceptibility at 3 T. Magn. Reson. Med. 00, 1–13 (2017).
5. Keenan, K. et al. Multi-site, multi-vendor comparison of T1 measurement using ISMRM/NIST system phantom. in Proc. Int. Soc. Magn. Reson. Med. 3290 (2016).
6. Spatz, M., Garcia-Polo, P., Keil, B., Ha, C. & Wald, L. L. A 64 channel 3T array coil for highly accelerated fetal imaging at 22 weeks of pregnancy. in Proc. Intl. Soc. Mag. Reson. 25, 1220 (2017).
7. Jiang, Y., Ma, D., Seiberlich, N., Gulani, V. & Griswold, M. a. MR fingerprinting using fast imaging with steady state precession (FISP) with spiral readout. Magn. Reson. Med. 74, 1621–31 (2015).
8. Cao, X. et al. Robust sliding-window reconstruction for Accelerating the acquisition of MR fingerprinting. Magn. Reson. Med. 00, 1–10 (2016).
9. Buonincontri, G. & Sawiak, S. J. MR fingerprinting with simultaneous B1 estimation. Magn. Reson. Med. 76, 1127–1135 (2016).
10. Ma, D. et al. Slice profile and B1corrections in 2D magnetic resonance fingerprinting. Magn. Reson. Med. 78, 1781–1789 (2017).
11. Jiang, Y. et al. Repeatability of magnetic resonance fingerprinting T1 and T2 estimates assessed using the ISMRM/NIST MRI system phantom. Magn. Reson. Med. 1457, 1452–1457 (2016).
12. Ingram, E., Morris, D., Naish, J., Myers, J. & Johnstone, E. MR Imaging Measurements of Altered Placental Oxygenation in Pregnancies Complicated by Fetal Growth Restriction. Radiology 000, 162385 (2017).
13. Blazejewska, A. I. et al. 3D in utero quantification of T2* relaxation times in human fetal brain tissues for age optimized structural and functional MRI. Magn. Reson. Med. 00, (2016).
14. Ingram, E. et al. R1 changes in the human placenta at 3 T in response to a maternal oxygen challenge protocol. Placenta 39, 151–153 (2016).
15. Huen, I. et al. R1 and R2* changes in the human placenta in response to maternal oxygen challenge. Magn. Reson. Med. 70, 1427–1433 (2013).
16. Hamilton, J. I. et al. MR fingerprinting for rapid quantification of myocardial T1, T2, and proton spin density. Magn. Reson. Med. 77, C1 (2017).
17. Zhao, B. et al. Optimal Experiment Design for Magnetic Resonance Fingerprinting: Cramer-Rao Bound Meets Spin Dynamics. 1–18 (2017). doi:10.1109/TMI.2018.2873704
18. Mehta, B. B. et al. Image reconstruction algorithm for motion insensitive MR Fingerprinting (MRF): MORF. Magn. Reson. Med. 1–16 (2018). doi:10.1002/mrm.27227
Figures