4071
Fetal Brain Tissue Characterization at 1.5 T using STAGE1Department of Radiology, Wayne State University School of Medicine, DETROIT, MI, United States, 2Department of Radiology, International Peace Maternity and Child Health Hospital, School of Medicine, Shanghai Jiao Tong University, Shanghai, China, 3The MRI Institute for Biomedical Research, Bingham Farms, MI, United States, 4Department of Biomedical Engineering, College of Engineering, Wayne State University, DETROIT, MI, United States
Synopsis
MRI-based tissue properties such as T1 and proton spin density are known to be important biomarkers of fetal brain maturation. However, fetal motion poses a big challenge in MRI due to long scan durations. Henceforth, there is lack of knowledge about the MRI properties of the human fetal brain tissue. To address these issues, in this study we use a rapid multiparametric method referred to as Strategically Acquired Gradient Echo (STAGE) imaging to obtain T1 and proton density maps of the fetal brain and generate T1-weighted images with enhanced tissue contrast in two minutes.
Introduction
Major segments of the fetal cerebral white matter (WM) can be recognized between 24 and 32 weeks of gestational age (GA).1 Longitudinal relaxation time (T1) is known to decrease in both WM and gray matter (GM) in neonates over time. It decreases more rapidly in WM during the first post-natal year due to myelination, which makes T1-weighted (T1W) images and potentially T1 maps useful tools for observing the WM maturation process.1 In the human brain, myelination starts as early as the second trimester of pregnancy.1 Therefore, estimation of T1 values in the second- and third-trimester fetuses would be valuable for monitoring the maturation process. However, fetal motion can introduce artifacts, which is one of the biggest challenges in fetal MRI. To address this issue, we used a multiparametric method called STrategically acquired gradient echo (STAGE) imaging. STAGE can provide 15 different images in just two minutes including 8 qualitative images and 7 quantitative images. These include T1 and proton spin density (PSD) maps and enhanced T1 contrasted images (T1WE).2, 3Method
Experiments were performed on a 1.5 T Siemens Aera MRI system with an 8-channel body coil. A total of 17 abnormal fetuses (second trimester: n = 8, GA: 27.3 ± 1.8 weeks; third trimester: n = 9, GA: 32.1 ± 1.8 weeks) (Table 1) from singleton pregnancies underwent MRI. Two flow-compensated single-echo spoiled gradient echo susceptibility weighted imaging (SWI) sequences with different flip angles were acquired with the scan parameters listed in Table 2. All images were processed using the custom-written software in MATLABTM. A T1WE image, a T1 map and a PSD map were generated using STAGE as reported in our previous work.2, 3 The mean and standard deviation of T1 and PSD of GM and WM were obtained from manually drawn region-of-interests (ROI) while the value of the cerebrospinal fluid (CSF) was measured from a small region inside the ventricle.Results
The T1W image, T1WE image, T1 map and PSD map of a 29 weeks fetus are shown in Figure 1. GM is brighter than WM and CSF in both the T1W and T1WE images, but the contrast is higher in the T1WE image. GM can be identified clearly in the T1W image, T1WE image and T1 map but not in the PSD map. The T1 value and PSD value of GM, WM and CSF are listed in Table 3. The ratio between WM and GM, and CSF and WM are also listed in Table 3 and plotted in Figure 2 for all 17 subjects. As is expected, for most of the subjects, T1CSF > T1WM > T1GM but no clear trend between GA and T1 values (or T1 value ratio) was found. PSD was similar in all three tissues.Discussion
In this study, we applied STAGE to fetal brain tissue characterization including both T1 and PSD measurements. T1WE images were also generated to enhance the contrast between GM and WM. The entire fetal brain was acquired in 2 mins with a high resolution of 0.82 × 1.64 × 3.0 mm3. T1WM was longer than T1GM probably due to the process of myelination.4 However, we didn’t find T1WM decreasing faster with GA than T1GM as it was reported for the newborn.4, 5 This may be because although the myelination starts during pregnancy, it reaches the peak during the first post-natal year.1 Another reason may be the impact of clinical conditions associated with the fetuses included in this study. It was reported that an impairment of cells which are going to become oligodendroglia can cause disturbances to myelinogenesis which can form enlarged ventricles.6 There are some limitations of this work. First B1 field correction was not performed. To minimize the error introduced by B1 inhomogeneity, the ROI of GM and WM were chosen as small regions close to each other. We assumed that the B1 transmit factor in these two small regions were similar3 due to the fact of low frequency propagation of B1 field, so that it could be canceled by T1WM/ T1GM and PSDWM/ PSDGM. Second, as we only collected one echo, there is error in PSDWM/ PSDGM caused by the tissue T2* effect.3 The results of the tissue property ratios between CSF and WM have larger errors because the ROI of CSF is not close to the ROI of WM for all the subjects.Conclusion
We successfully implemented STAGE MRI for rapid acquisition and estimating multi-parametric properties of the human fetal brain. This will have tremendous scope in establishing the baseline for studying fetal brain tissues.Acknowledgements
No acknowledgement found.References
[1] Dubois Jessica, Ghislaine Dehaene-Lambertz, S Kulikova, et al. The early development of brain white matter: a review of imaging studies in fetuses, newborns and infants. Neuroscien.2014;276:48-71.
[2] Chen Yongsheng, Saifeng Liu, Yu Wang, et al. STrategically Acquired Gradient Echo (STAGE) imaging, part I: Creating enhanced T1 contrast and standardized susceptibility weighted imaging and quantitative susceptibility mapping. Magnetic resonance imaging.2018;46: 130-139.
[3] Wang Yu, Yongsheng Chen, Dongmei Wu, et al. STrategically Acquired Gradient Echo (STAGE) imaging, part II: Correcting for RF inhomogeneities in estimating T1 and proton density.Magnetic resonance imaging.2018;46:140-150.
[4] Barkovich, A J. Concepts of myelin and myelination in neuroradiology. American Journal of Neuroradiology.2000;21(6):1099-1109.
[5] Holland B A, Haas DK, Norman D, et al. MRI of normal brain maturation. American Journal of Neuroradiology.1986;7(2):201-208.
[6] Leviton A and Gilles F. Ventriculomegaly, delayed myelination, white matter hypoplasia, and “periventricular” leukomalacia: how are they related? Pediatric neurology.1996;15(2):127-136.
Figures
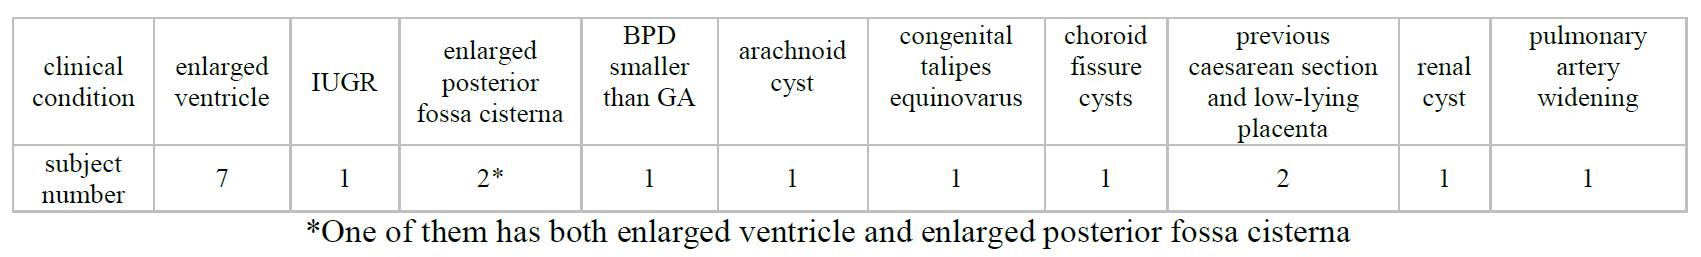
Table 1. Clinical condition for all subjects
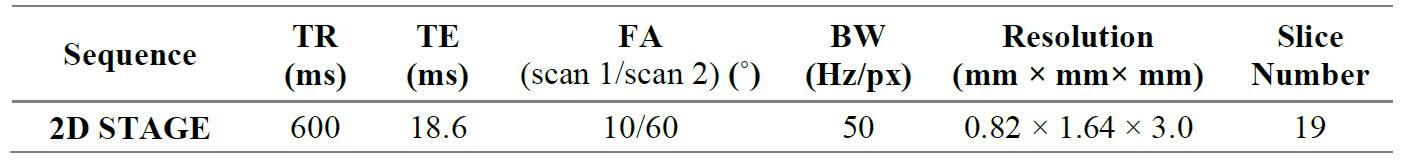
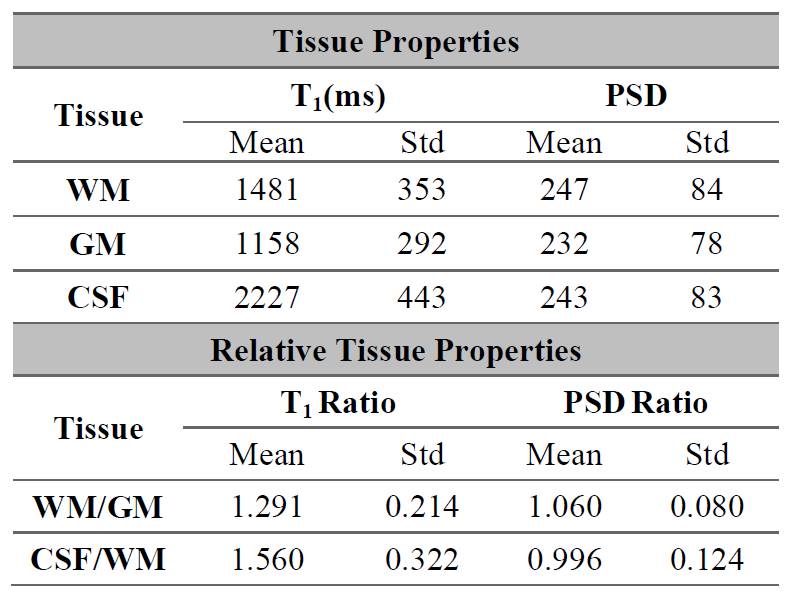
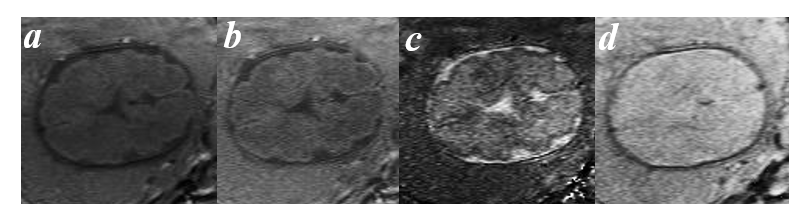
Figure 1. T1-weighted images and tissue property maps from a fetus of 29 weeks of gestation (BPD smaller than GA).
a) T1W image generated by the gradient echo sequence with flip angle 60˚; b) T1WE image; c) T1 map; and d) PSD map.
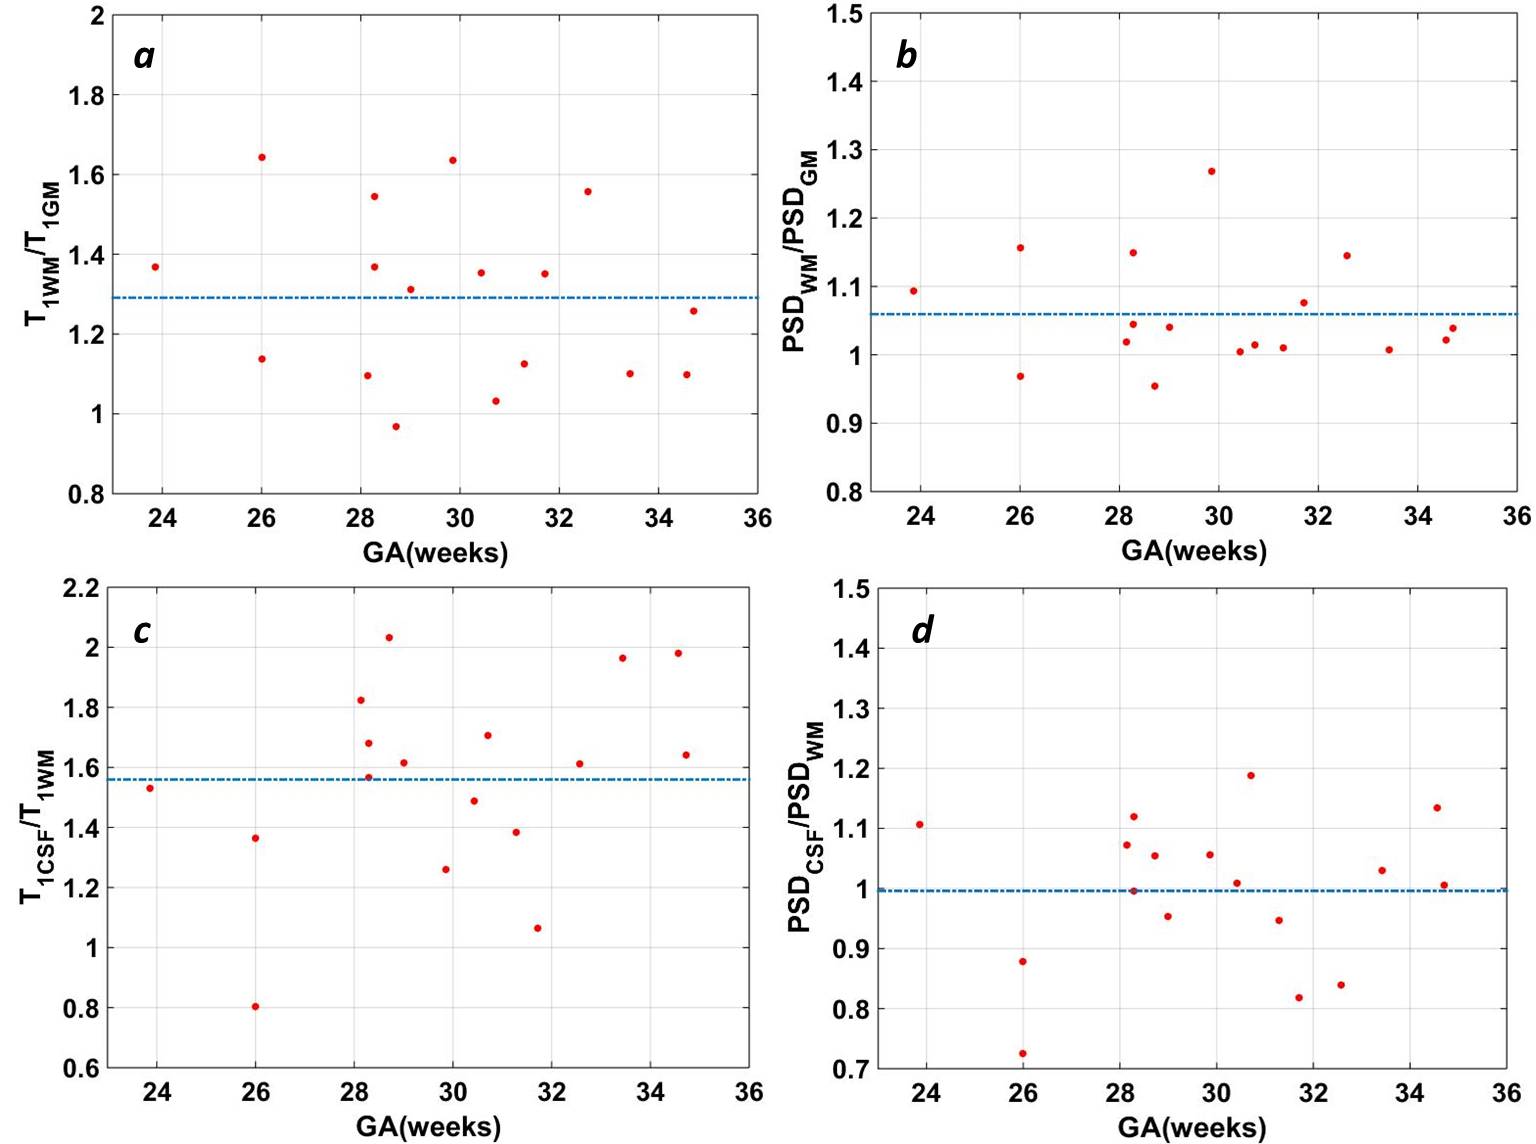
Figure 2. T1 and PSD ratios between different brain tissues for all subjects.
The red dots show the tissue property of each subject, and the blue lines show the mean values. No trend between the tissue properties and GA was found.