4065
Measurement of Uterine Artery and External Iliac Artery Pulse Wave Velocity using 4D Flow MRI1Department of Bioengineering, University of Pennsylvania, Philadelphia, PA, United States, 2Department of Obstetrics and Gynecology, University of Pennsylvania, Philadelphia, PA, United States, 3Department of Radiology, University of Pennsylvania, Philadelphia, PA, United States, 4Department of Neurology, University of Pennsylvania, Philadelphia, PA, United States
Synopsis
Maintenance of blood supply to the placenta is believed to be dependent on the geometric and hemodynamic properties of the uteroplacental vasculature. In this study we present an MRI method for measuring pulse wave velocity in the uterine arteries. In 6 healthy pregnant subjects, we measured path length and time-to-peak of the velocity waveforms in the uterine arteries and external iliac arteries. The uterine arteries have lower pulse wave velocity than the external iliac arteries (5.5±2.5 vs. 12.9±4.6 m/s, p=3x10⁻⁵), indicating possible biomechanically greater compliance.
Introduction
Uterine artery (UtA) remodeling is believed to involve increasing arterial compliance to reduce blood flow resistance to the placenta [1] based on flow-mediated dilation studies and animal models [2-5]. A limitation of ultrasound-based flow-mediated dilation studies is its inability to visualize the UtAs beyond 3-4 cm in length at a time. In this study, we leveraged time-of-flight (TOF) and 4D flow MRI to measure and compare PWV measured from the descending aorta (dAo) to the UtAs and external iliac arteries (EIAs). To our knowledge, 4D flow MRI measurements of PWV in the UtAs in human pregnancy have not yet been reported. We hypothesized that the UtAs would have lower PWV than the EIAs.Methods
We acquired TOF and 4D flow MRI in 6 healthy singleton pregnant women (gestational age (GA)=18-25 weeks) at 1.5T (Avanto; Siemens Healthcare, Erlangen, Germany). They were imaged in supine position with 8-channel spine array, two 4-channel body array coils, electrocardiogram synchronization. The MRI protocol consisted of a half-Fourier acquisition stimulated echo (HASTE) to localize the pregnant uterus, TOF angiogram from the dAo to the femoral heads of the thigh bones, 2D phase contrast velocimetry at the dAo, and 4D flow of the UtAs (total acquisition time=30-40 min). The TOF parameters were: repetition time (TR)/echo time (TE)=394/4.4 ms, flip angle (FA)=50º, field-of-view (FOV)=350x250x190 mm3, voxel size=1.1x1.1x2.8 mm3. The 4D flow parameters were: TR/TE=5.5/2.8 ms, FA=8º, FOV=320x240x60 mm3, voxel size=1.25x1.25x1.25 mm3, PEAK-GRAPPA acceleration factor=4.7 [6], velocity encoding parameter (VENC)=120-160 cm/s [7], number of cardiac phases=12-15. The TOF angiograms were segmented (Seg3D; Univ. of Utah SCI) and centerlines were extracted (VMTK) to compute path length (PL) from the dAo to the UtAs and EIAs. The 4D flow images were processed with custom software (MATLAB) [8] and volumetric velocity-based thresholding (Ensight, CEI; Apex, NC). Eight planes were prescribed in each vessel and time-to-peak (TTP) was computed from the velocity waveform extracted from each plane. PWV was computed by PWV=PL/TTP [m/s]. We used box-and-whisker plots, two-tailed paired t-test, and two-way ANOVA to compare the PWV results.Results
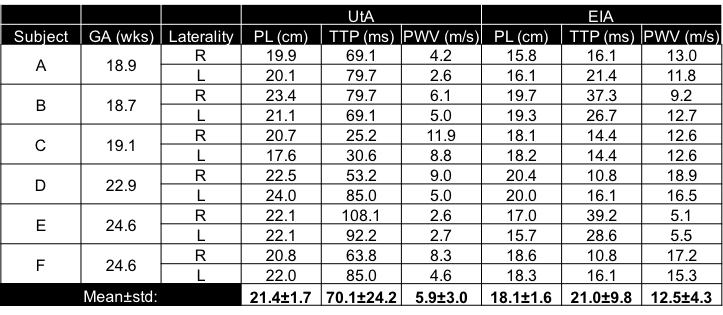
Figure 1 shows the dAo, EIA and UtA blood velocity in one subject at 18 weeks gestation. Across all subjects, PWV was 5.5±2.5 m/s (mean±std) in the UtAs and 12.9±4.6 m/s in the EIAs (p=3x10⁻⁵). The difference in PWV was 7.4 m/s with 95% confidence interval [5.2,9.6] m/s. Figure 2 shows that the UtAs have lower PWV than the EIAs. When comparing PWV measurements between vessel type and laterality, there was an effect of vessel type (p=3x10⁻⁴) but not in laterality (p=0.42). The UtA and EIA diameters were 6.2±0.7 mm and 8.2±1.0 mm (p=1x10⁻⁴), respectively. Table 1 contains the data for each subject.Discussion
We found that the UtA PWV was lower than EIA PWV between 18-25 weeks of pregnancy. According to the Moens-Korteweg equation, this would indicate reduced UtA wall compliance or wall thickness compared to the EIAs. Arterial radius may have a limited role in this trend because the UtAs have a smaller radius than the EIAs. We speculate PWV decreases with time as UtA wall compliance increases with gestational remodeling [3]. This response is important in maintaining low blood flow resistance and high flow rate to the placenta [3]. PWV can potentially be used to monitor UtA hemodynamics in patients with high risk of hypertensive disorders of pregnancy, which are believed to reflect systemic endothelial dysfunction [4, 5]. A limitation of 4D flow is its low temporal resolution compared to the EIA pulse wave transit time (Δt=40 vs. TTP=21 ms). This was mitigated by selecting a large distance between the reference (dAo) and the UtA/EIA locations, and measuring PWV at several UtA/EIA locations. Nevertheless, we found that EIA PWV was slightly higher than previous US studies (9.4-9.8 m/s) [9, 10], which may imply a combination of inaccurate spatial distance measurements in US and low MRI temporal resolution. A further limitation of this study is that it assumes inviscid flow since there is no dependence on viscosity [11]. In future work, fluid dynamic simulations and increase in spatial resolution of 4D flow would aid in better understanding of the viscous interactions between the blood flow and the arterial wall. A longitudinal study can better investigate the change in UtA PWV with gestational age.Conclusion
The major contribution of this work is a joint structural-functional approach to assessing PWV in pregnant women. Physiologic changes in the female pelvic vasculature are believed to reflect pregnancy health during the course of gestation. Therefore, PWV may be a potential biomarker of UtA remodeling during clinical monitoring for adverse pregnancy outcomes.Acknowledgements
National Child Health and Human Development (U01-HD087180)National Science Foundation (DGE-1321851)
National Institute of Biomedical Imaging and Bioengineering (T32-EB009384)
National Institute of Biomedical Imaging and Bioengineering (P41-EB015893)
National Heart Lung and Blood Association (R00-HL108157)
National Child Health and Human Development (R00-HD074649)
References
[1] H. Schulman, "The clinical implications of Doppler ultrasound analysis of the uterine and umbilical arteries," Am J Obstet Gynecol, vol. 156, no. 4, pp. 889-93, Apr 1987.
[2] K. K. Griendling, E. O. Fuller, and R. H. Cox, "Pregnancy-induced changes in sheep uterine and carotid arteries," Am J Physiol, vol. 248, no. 5 Pt 2, pp. H658-65, May 1985.
[3] G. Osol and M. Mandala, "Maternal uterine vascular remodeling during pregnancy," Physiology (Bethesda), vol. 24, pp. 58-71, Feb 2009.
[4] Y. Yinon et al., "Vascular dysfunction in women with a history of preeclampsia and intrauterine growth restriction: insights into future vascular risk," Circulation, vol. 122, no. 18, pp. 1846-53, Nov 2 2010.
[5] O. Paez et al., "Parallel decrease in arterial distensibility and in endothelium-dependent dilatation in young women with a history of pre-eclampsia," Clin Exp Hypertens, vol. 31, no. 7, pp. 544-52, Oct 2009.
[6] B. Jung, P. Ullmann, M. Honal, S. Bauer, J. Hennig, and M. Markl, "Parallel MRI with extended and averaged GRAPPA kernels (PEAK-GRAPPA): optimized spatiotemporal dynamic imaging," J Magn Reson Imaging, vol. 28, no. 5, pp. 1226-32, Nov 2008.
[7] M. Markl, A. Frydrychowicz, S. Kozerke, M. Hope, and O. Wieben, "4D flow MRI," J Magn Reson Imaging, vol. 36, no. 5, pp. 1015-36, Nov 2012.
[8] A. F. Stalder, M. F. Russe, A. Frydrychowicz, J. Bock, J. Hennig, and M. Markl, "Quantitative 2D and 3D phase contrast MRI: optimized analysis of blood flow and vessel wall parameters," Magn Reson Med, vol. 60, no. 5, pp. 1218-31, Nov 2008.
[9] S. H. Moon et al., "Increased pulse wave velocity and augmentation index after isometric handgrip exercise in patients with coronary artery disease," Clin Hypertens, vol. 21, p. 5, 2015.
[10] G. Styczynski et al., "Echocardiographic Assessment of Aortic Pulse-Wave Velocity: Validation against Invasive Pressure Measurements," J Am Soc Echocardiogr, vol. 29, no. 11, pp. 1109-1116, Nov 2016.
[11] W. R. Milnor, Hemodynamics. Baltimore: Williams & Wilkins, 1982.
Figures