4064
Pattern Analysis of Placental Blood Flow Distribution using ASL MRI1Department of Bioengineering, University of Pennsylvania, Philadelphia, PA, United States, 2Department of Obstetrics and Gynecology, University of Pennsylvania, Philadelphia, PA, United States, 3Department of Radiology, University of Pennsylvania, Philadelphia, PA, United States, 4Department of Neurology, University of Pennsylvania, Philadelphia, PA, United States
Synopsis
Arterial Spin Labeling MRI is a promising approach to assess blood flow to the placenta. Although previous studies have largely attempted to quantify global perfusion, we believe that the unique physiology of blood flow through the placental intervillous space rather than through capillaries warrants regional pattern analysis. We present an image analysis framework leveraging a spline-based transform of the image coordinates, watershed segmentation, and clustering analysis. We report Bayesian statistics to quantify features of blood flow distribution and the degree of uncertainty at the uteroplacental interface.
Introduction
Common hypertensive disorders of pregnancy such as preeclampsia and gestational hypertension may arise from placental insufficiency [1]. During normal placental development, the maternal spiral arteries quadruple in distal diameter, forming low resistance, high flow rate, funnel-like conduits into the placental intervillous space [2]. However, in pathological cases, the spiral arteries remain as narrow, high resistance structures, contributing to reduced placenta blood flow and systemic hypertension [2]. While the spiral arteries are generally too small (<1 mm diameter) to resolve with ultrasound or MRI, arterial spin labeling (ASL) MRI may enable assessment of spiral artery function. Previous ASL studies have quantified perfusion and/or arterial transit time [3-6]. However, a “perfusion” model may not be well-suited to the placenta – the intervillous space is an open pool of blood, acting more like a large arteriovenous shunt than the arteriole-capillary-venule structures in the brain and kidney. We therefore present a novel ASL MRI analysis approach assessing the pattern of blood flow distribution at the uteroplacental interface.Methods
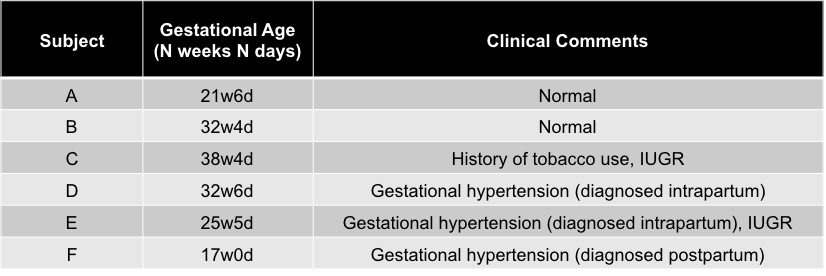
We acquired 2D background-suppressed FAIR ASL MRI at 1.5T on 6 singleton pregnant subjects (2 normal and 4 with gestational hypertension and/or intrauterine growth restriction, gestational age (GA)=17-39 weeks). Figure 1 lists subject details; sequence parameters included 20 control-label image pairs, 4 2D slices, and post-label delay=1500ms (complete parameters listed in [7]). Given the imaging data at each voxel, x, we used a Bayesian approach, drawing 100 samples from the posterior distribution of the control-label difference, $$$p(\Delta M|x)$$$, at each voxel assuming normally distributed noise.
Noting that spatial clusters in $$$p(\Delta M|x)$$$ represent the output of spiral arteries, we used a semi-automatic method to generate a coordinate system relative to the uteroplacental interface and performed a clustering analysis of the signal (see Figure 2) deriving cluster-based statistics that we believe may be biologically relevant. In particular, we first created a median image by taking the median of the 100 samples at each voxel and masking out voxels where $$$p(\Delta M\leq0|x)>5\%$$$ (i.e., low-signal voxels), and then performed cluster analysis. Second, we analyzed the 100 draws independently, computing 100 samples of the cluster statistics, to estimate their posterior distributions.
Results
Figure 2c and 2d show an in-plane projection of Subject C along with its thresholded binary median image. Figure 2f shows the posterior probability, based on the 100 separately processed samples, of each voxel being in the thresholded region. Figure 3 shows various cluster measurements in each subject. From the sampled distribution in all subjects, the number of clusters in four slices (mean±std)=30±9, total area=522.7±155.7 voxel units (VU)2, average area=18.8±2.8 VU2, percent area=12.9±2.3%, mean signal=1053.6±400.7 arbitrary units (AU), and maximum horizontal distance between clusters=9.5±4.1 VU. Figure 4 shows cluster analysis projected onto the uteroplacental surface by taking the L2-norm along the in-plane rays in each of the four slices and then smoothing across the resulting 2D surface.Discussion
We have shown the feasibility of a novel analysis approach for placental ASL that focuses on interpreting the spatial distribution of blood flow from the spiral arteries at the uteroplacental interface. This work was motivated by the recognition that the placenta has unique open circulation in the intervillous space and is not perfused in like other anatomy routinely imaged with ASL. Based on evidence of infarcts present in placental histopathology associated with preeclampsia [8], we speculate that a feature of in vivo placental insufficiency is reduced density of blood flow distribution. From 2D FAIR ASL data we localized clusters of blood inflow signal and report preliminary data regarding their number, size, mean, and other features. We also speculate that placental insufficiency may manifest as a sparse distribution of clusters (Figure 5). Placental ASL MRI is vulnerable to motion artifacts (maternal respiration, uterine contractions, fetal movement), which we address by reporting the uncertainty of our measurements using the posterior distribution for the individual cluster statistics. Another limitation of our ASL acquisition is that it is 2D with slice gaps and does not fully cover the placenta. In future work, we will employ 3D full coverage of the placenta and further investigate the correlation of our metrics with uterine artery flow rate, placental histopathology, and delivery outcomes.Conclusion
We present a novel approach to analyzing placental ASL images consisting of clustering analysis of the blood flow distribution at the uteroplacental interface. Future studies will investigate its correlation with placental pathology impacted by hypertensive disorders of pregnancy.Acknowledgements
National Child Health and Human Development (U01-HD087180)National Science Foundation (DGE-1321851)
National Institute of Biomedical Imaging and Bioengineering (T32-EB009384)
National Institute of Biomedical Imaging and Bioengineering (P41-EB015893)
National Heart Lung and Blood Association (R00-HL108157)
National Child Health and Human Development (R00-HD074649)
References
[1] A. Mammaro et al., "Hypertensive disorders of pregnancy," J Prenat Med, vol. 3, no. 1, pp. 1-5, Jan 2009.
[2] G. J. Burton, A. W. Woods, E. Jauniaux, and J. C. Kingdom, "Rheological and physiological consequences of conversion of the maternal spiral arteries for uteroplacental blood flow during human pregnancy," (in English), Placenta, vol. 30, no. 6, pp. 473-82, Jun 2009.
[3] K. D. Ludwig et al., "Perfusion MRI of the Placenta: Preliminary Results using ASL FAIR and Ferumoxytol DCE MRI in the Rhesus Macaque," in Proc. Intl. Soc. Mag. Reson. Med. 25th Annual Meeting, Honolulu, HI, 2017.
[4] P. A. Gowland et al., "In vivo perfusion measurements in the human placenta using echo planar imaging at 0.5 T," (in English), Magnetic Resonance in Medicine, vol. 40, no. 3, pp. 467-473, Sep 1998.
[5] I. Derwig et al., "Association of placental perfusion, as assessed by magnetic resonance imaging and uterine artery Doppler ultrasound, and its relationship to pregnancy outcome," Placenta, vol. 34, no. 10, pp. 885-91, Oct 2013.
[6] X. Shao et al., "Measuring human placental blood flow with multidelay 3D GRASE pseudocontinuous arterial spin labeling at 3T," J Magn Reson Imaging, Nov 14 2017.
[7] E. Hwuang et al., "Background-suppressed pulsed arterial spin labeling of placental perfusion at 1.5T," in Proc. Int. Soc. of Mag. Res. Med. 26th Annual Meeting, Paris, France, 2018.
[8] D. J. Roberts and M. D. Post, "The placenta in pre-eclampsia and intrauterine growth restriction," J Clin Pathol, vol. 61, no. 12, pp. 1254-60, Dec 2008.
Figures