4061
Changes in placental oxygenation in subclinical uterine contractions in the third trimester1Sir Peter Mansfield Centre, University of Nottingham, Nottingham, United Kingdom, 2Medical Physics, Guy's and St Thomas' NHS Foundation Trust, London, United Kingdom, 3Life Sciences, University of Nottingham, Nottingham, United Kingdom, 4CHild Health, Obstetrics and Gynaecology, University of Nottingham, Nottingham, United Kingdom
Synopsis
Subclinical uterine contractions in the third trimester have been detected with MRI in recent years and we regularly observe these contractions in 10 minute longitudinal scans. In a small pilot study, single echo-planar imaging T2* weighted scans and associated quantitative susceptibility maps suggest that the uterine contractions are localised to the placenta and that the placenta is more oxygenated after the contraction. We hypothesise that the contractions have the function of mixing of blood in the placenta to aid transport through what is otherwise a low flow system.
Purpose
In recent years MRI has revealed that subclinical (i.e. undetected by the mother) contractions of the uterus occur during pregnancy.1 We have observed that these contractions occur in about 50% of the women we scan longitudinally over 10 minutes in hyperoxia studies. We have also noted that on videos they appear to involve the placenta more than the whole uterus. Aim: to investigate the nature and possible function of these subclinical contractions observed on MRI using T2* weighted imaging.Methods
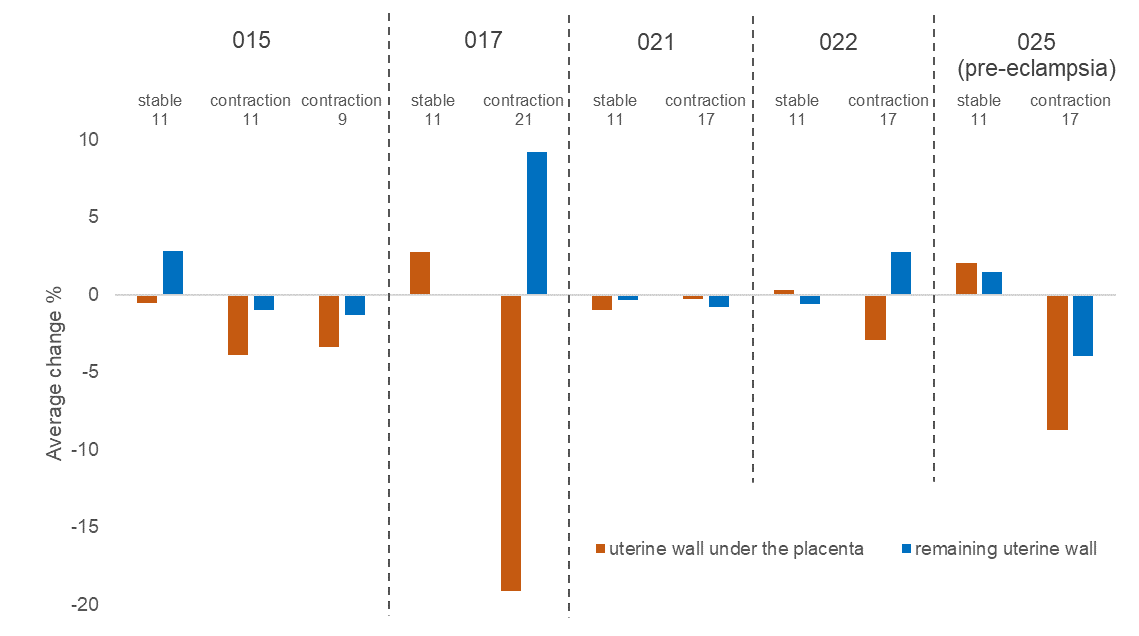
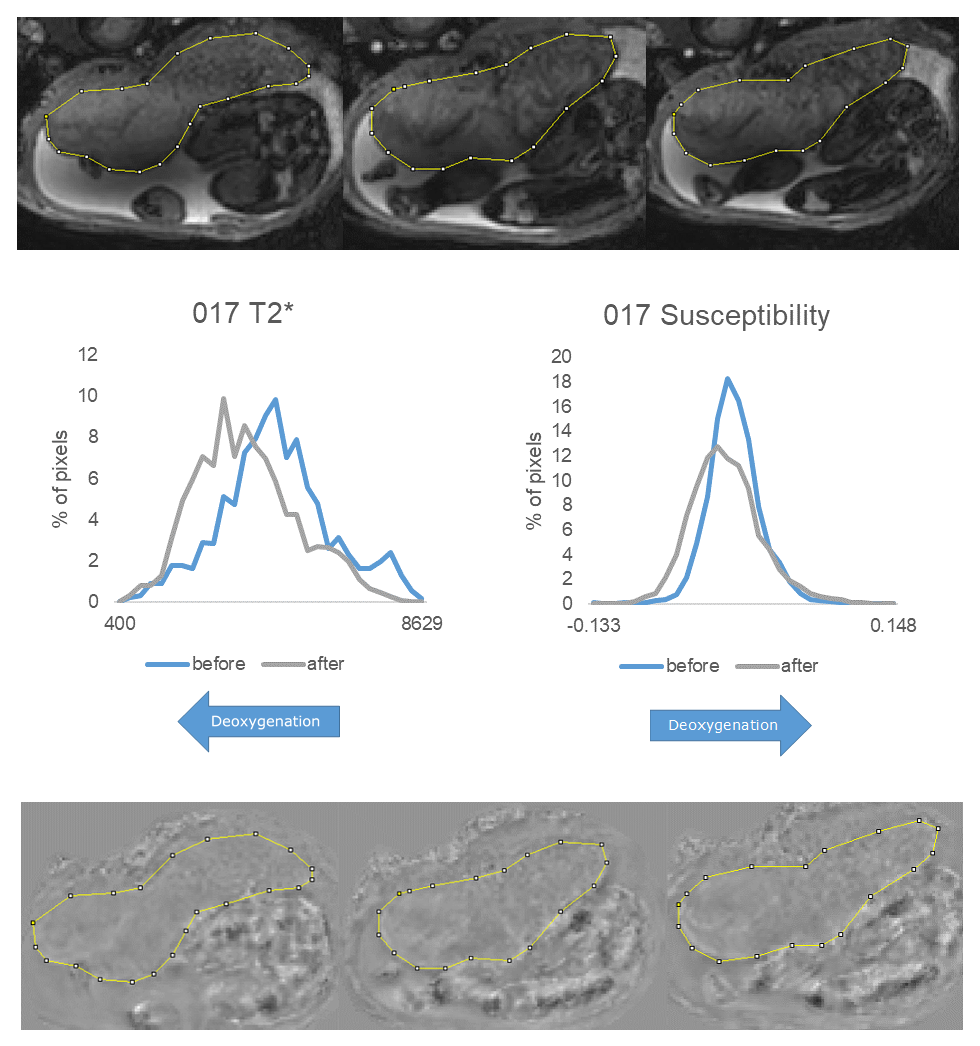
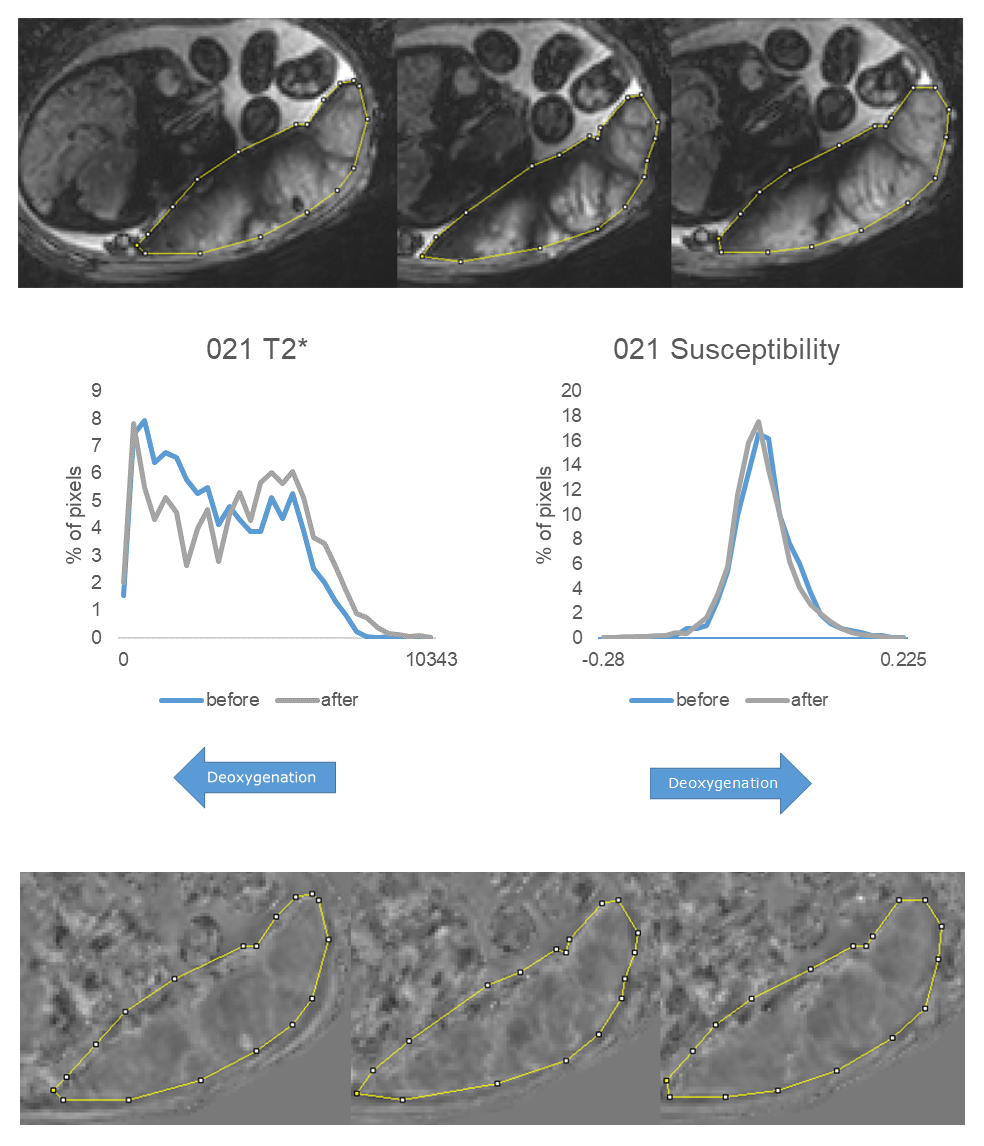
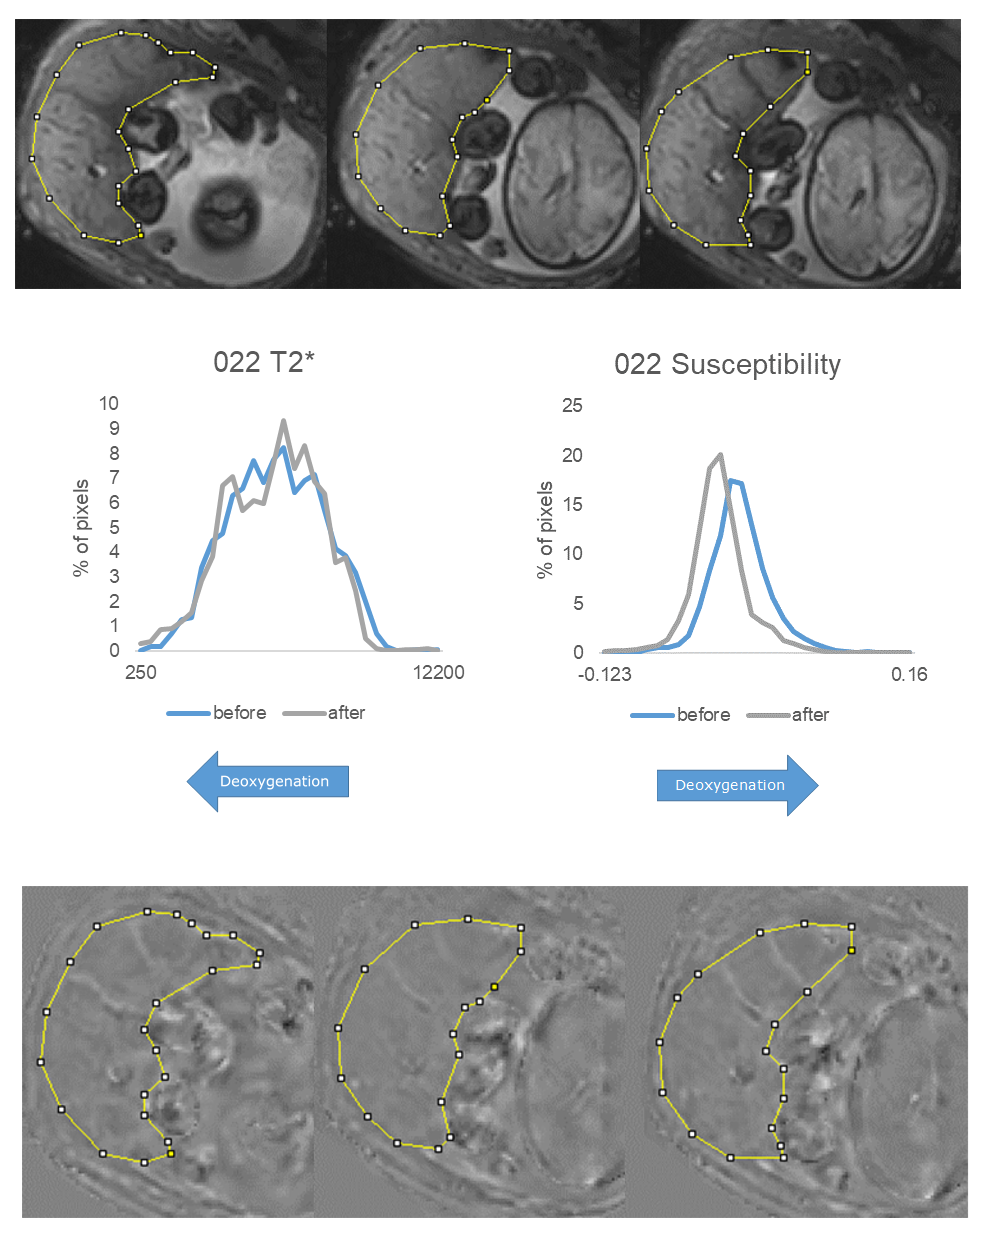
Twenty-four pregnant women in the third trimester (27-36 weeks) underwent a ten minute repeated, respiratory-gated (10-15 second intervals) single echo-planar imaging (EPI) T2* weighted scan of the uterus and placenta. After scanning the women were asked to complete a questionnaire which also recorded any contractions that they felt. Quantitative susceptibility maps (QSM) were computed, using LSQR, by unwrapping the phase images from the gradient echo data using a Laplacian based method, before performing a 2D V-SHARP filter slice-by-slice to remove the background phase.2 The length of the uterine wall a) covered and b) not covered by placenta was measured on a central slice and plotted over time. The area under the length-time curve (AUC) was determined during the contraction and for a similar stable period, and normalized to give average % change for each period. Placental pixel intensity timecourses in the T2* weighted images and QSM maps were measured in a placental ROI on the same slice and histograms were compared between the beginning and end of a contraction.Results
8 participants had slight, and 5 had clear contractions of 2-3 minutes length. The following observations were made in this latter group (gestational age range 27-36 weeks, one with pre-eclampsia). None of these participants reported feeling a contraction during the scan. Video analysis suggested that contractions were generally associated with a shortening of the section of wall that was covered by the placenta, whereas the section that was not covered by placenta either expanded or shortened to a lesser extent. This was confirmed by measurements (Fig. 1), although subject 021 showed a more general shortening over the whole placenta. Only small changes occurred during stable periods. As previously reported, 1 T2* was generally inhomogeneously reduced during the contraction, indicating either reduced oxygenation, or intravoxel dephasing caused by inhomogeneous oxygenation or flow or a combination of all of these (Fig. 2-4) and this decrease sometimes persisted after the contraction. However the magnetic susceptibility was often decreased after the contraction, suggesting a higher average placental oxygenation. This pattern was observed in 3/5 subjects (Fig. 2-4); subject 015 had multiple contractions during the scanning period and possibly never returned to baseline and subject 025 had pre-eclampsia and a very deoxygenated placenta (showing very inhomogeneous susceptibility which increased after the contraction).Discussion
Here we are investigating subclinical uterine contractions observed on MRI time course data in the third trimester of pregnancy. This is a very small and inhomogeneous set of subjects but based on a preliminary analysis we are making two important suggestions. First the contractions generally appear to be localised to the placenta rather than the whole uterine wall. We note a recent discovery that the uterine pacemaker is located at the placental/myometrial junction in rats3 and these contractions could relate to contractions of the middle layer of muscle (junctional zone in the uterus containing tightly packed muscle fibres with various orientations4). Secondly we note that these contractions must affect the function of the placenta. They generally cause a reduction in T2* which would possibly indicate an reduction in oxygenation. However, this seems to be an unlikely physiological state given how frequently these contractions are observed. Susceptibility mapping suggest that although T2* goes down the average oxygenation can increase. The discrepancy between these results is probably due to the inhomogeneous oxygenation of the placenta. We hypothesize that the subclinical contractions observed in late gestation are localized to the placenta and have the function of mixing of blood in the placenta to aid transport through what is otherwise a low flow system. The bands commonly seen on T2* could either be due to deoxygenated blood being pushed into channels around the sides of the cotyledons or flow or both. However the susceptibility maps indicate that the average oxygenation in the placenta can be raised by these contractions. We will now test this hypothesis with more robust measurements and across more participants.Acknowledgements
This study was funded by the National Institute of Health.References
1. Sinding M, Peters DA, Frøkjær JB, Christiansen OB, Uldbjerg N, Sørensen A: Reduced placental oxygenation during subclinical uterine contractions as assessed by BOLD MRI. Placenta, 39: 16–20, 2016.
2. Schweser F, Deistung A, Lehr BW, Reichenbach JR: Quantitative imaging of intrinsic magnetic tissue properties using MRI signal phase. NeuroImage, 54(4):2789–2807, 2011.
3. Lutton EJ, Lammers WJEP, James S, Berg HA van den, Blanks AM: Identification of uterine pacemaker regions at the myometrial-placental interface in the rat: Myometrial pacemaker. J Physiol, 596: 2841–2852, 2018.
4. Escalante NM, Pino JH: Arrangement of muscle fibers in the myometrium of the human uterus: a mesoscopic study. MOJ Anatomy & Physiology, 4(2):280-283, 2017.
Figures