4052
Exploring analytical models of the diffusion MR signal in non-pregnant cervical tissue in 3T1Centre for Medical Image Computing, University College London, London, United Kingdom, 2Centre for the Developing Brain, King’s College London, London, United Kingdom, 3Division of Women’s Health, King’s College London, London, United Kingdom
Synopsis
Preterm Birth is a major healthcare problem and its appropriate prediction remains a challenge. Extensive research utilising advanced MR protocols has been undertaken on the cervical malignancy, but cervical structure and remodelling in term and preterm pregnancies is little studied. As part of a larger project, this work aims to explore model-based diffusion MRI microstructural models along the non-pregnant cervix. We compare multi-compartment microstructure models to analyse the diffusion signal. Initial results reveal that more complex models than the Apparent Diffusion Coefficient are required to characterise the cervical tissue microstructure.
INTRODUCTION
This work aims to explore diffusion MRI signal using microstructural models along the length of the non-pregnant cervix.
Preterm birth (PTB) is a major healthcare challenge, which contributes to over 70% of perinatal mortality in developed countries and has long term consequences for quality of life1. In many cases (approximately 25%) the mechanism is not clear2. This needs to be elucidated to target interventions, understand aetiology and develop predictive tools.
The cervix plays an integral role in events surrounding parturition3,4 and its damage is associated with PTB. Alterations in the cervix have been demonstrated using MRI during pregnancy: changes in signal intensity of cervical stromal layers have been found on T2-weighted images5, in diffusion imaging (Apparent Diffusion Coefficient - ADC)6 and ultrasound7,8. Furthermore, it has been extensively imaged with regards to malignancy9,10. Although the cervical length is used as a predictor in pregnancy for PTB (with low sensitivity4), little work has been done regarding either the macro or microstructure of cervical tissue. For example, the type and amount of collagen and the directionality and dispersion of collagen fibres are still being elucidated for non-pregnant and pregnant tissues3.
Quantitative imaging techniques, such as model-based diffusion MRI (dMRI) can extract information on tissue microstructure, and estimate distinct parameters reflecting separate influences on the signal11–13. In this study, we make an initial exploration into model-based dMRI of the non-pregnant cervix.
METHODS
Non-pregnant women who had previously undergone delivery were selected as part of a bigger study. MRI scans were performed with a 3T Philips Achieva scanner with a 32-channel cardiac coil. The acquisition was a single-shot echo-planar dMRI protocol spanning a large range of b-values and gradient directions (Table 1). There were 7 b=0 volumes interleaved throughout the acquisition. Other acquisition details are: 2x2x2mm(axial-sagittal-coronal) resolution, TE=70ms, TR=8ms, FOV=[220-300]x[280-340]x140mm. We also acquired an anatomical T2-weighted TSE volume in axial oblique and sagittal plane. Two participants were included in this work, a dMRI scan in the axial oblique plane was acquired for one participant (Figure 1).
In a middle slice, an experienced obstetrician (LS) labelled different regions-of-interest (ROIs) along the whole cervix as anterior/posterior pairs in the sagittal scan and concentric rings for the axial scan (Figure 1). The ROIs (excluding the cervical canal) covered 802 voxels.
We analysed the ROI signal using multi–compartment models and performed model selection to see which can explain the signal the best. Since this is a relatively sparse dMRI protocol, we restricted to two-compartment models which consider the fast-(perfusion) and slow-attenuating (diffusion) signal components separately. The compared models are: ball-ball, ball-stick and stick-ball following the nomenclature in 13 (Table 2), chosen to test whether one of the compartments exhibits anisotropy. For comparison, we also fit the ball model, which corresponds to ADC. We fit these models to the mean dMRI signal for each ROI and for each voxel within each ROI, using maximum likelihood estimation assuming Rician noise13,14. Model selection was performed by calculating the Bayesian information criterion (BIC).
RESULTS AND DISCUSSION
Figure 2 plots the raw diffusion signal (points) and the fits (lines) using one-compartment and twocompartment models. The one-compartment model fails to fit the data for the highest b-value and it is not the best model in any voxel. The preferred model for each ROI and voxel changes through the cervix (axial ROIs). Findings are consistent for both participants.
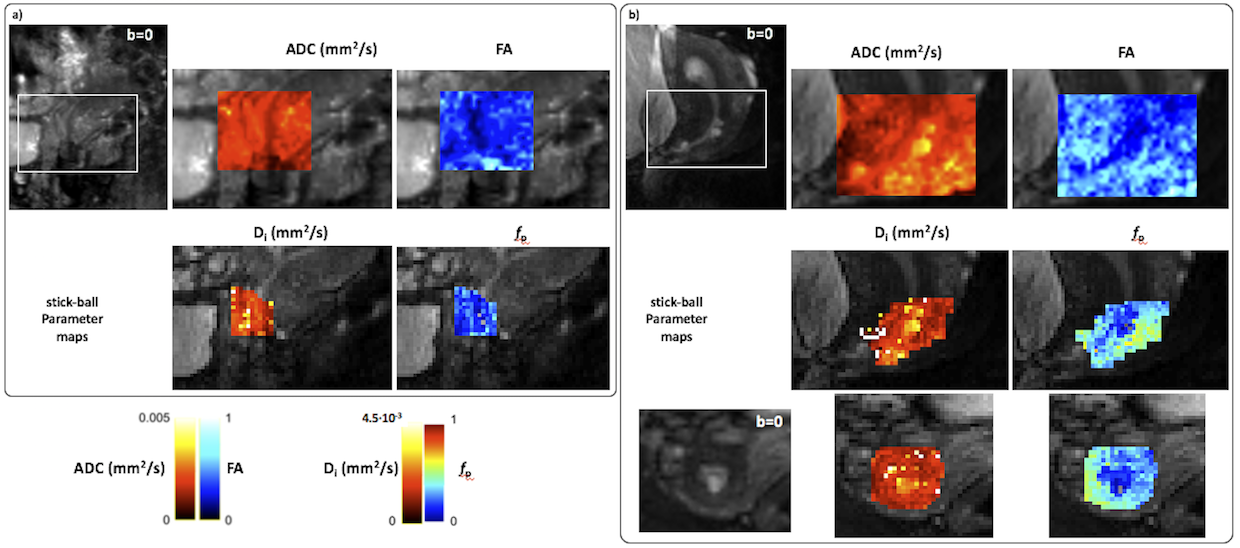
Figure 3 shows the standard ADC and FA maps (calculated using MRtrix315). The cervical canal has low FA and high ADC, likely reflecting the lack of tissue in this region. ADC displays an homogeneous pattern for the whole cervix. Figure 3 also shows the parametric maps obtained with one of the twocompartment model which best explained the data (stick-ball). We observed similar patterns for parameters maps in anterior/posterior regions of the cervix. The calculated parameter maps reflect anatomical structures, evidence that they are sensitive to microstructure.
Results seem consistent between both participants. However, more samples are needed to find the best model to non-invasively characterise non-invasively the cervical tissue prior to and during pregnancy. Also, we restricted our analysis to two-compartment models. Future work will use a richer protocol to evaluate three-compartment models.
CONCLUSIONS
This is the first study that provides parametric maps of the cervical tissue and compares different microstructural models along the cervix for non-pregnant women. We demonstrate that multicompartment models explain the data better than ADC in most areas.Acknowledgements
We thank the midwives, obstetricians and radiographers who played a key role in obtaining the data sets. We would also like to thank all participants. EBC was supported by the Engineering and Physical Sciences Research Council (EPSRC ref.: EP/M020533/1). EP is supported by the EPSRC (EP/N021967/1). EP/M020533/1 and EP/N018702/1 support DCA. JH and this work received funding from the Wellcome Trust (Sir Henry Wellcome Fellowship, [201374/Z/16/z]. This work was also supported by the Wellcome/EPSRC Centre for Medical Engineering [WT 203148/>/16/<]. PJS was supported by National Institutes of Health (NIH), Grant/Award Number: 1U01HD087202-01.References
1. Saigal S, Doyle LW. An overview of mortality and sequelae of preterm birth from infancy to adulthood. The Lancet. 2008;371(9608):261–269.
2. Mercer BM, Goldenberg RL, Das A, Moawad AH, Iams JD, Meis PJ, Copper RL, Johnson F, Thom E, McNellis D, et al. The preterm prediction study: A clinical risk assessment system. In: American Journal of Obstetrics and Gynecology. Vol. 174. 1996. p. 1885–1895.
3. Myers KM, Feltovich H, Mazza E, Vink J, Bajka M, Wapner RJ, Hall TJ, House M. The mechanical role of the cervix in pregnancy. Journal of Biomechanics. 2015;48(9):1511–1523.
4. Baños N, Murillo-Bravo C, Julià C, Migliorelli F, Perez-Moreno A, Ríos J, Gratacos E, Valentin L, Palacio M. Mid-trimester sonographic Cervical Consistency Index to predict spontaneous preterm birth in a low-risk population. Ultrasound in Obstetrics & Gynecology. 2017 Mar [accessed 2018 Feb 9]:[Epub ahead of print]. http://doi.wiley.com/10.1002/uog.17482
5. de Tejada BM, Faltin DL, Kinkel K, Guittier M-J, Boulvain M, Irion O. Magnetic resonance imaging of the cervix in women at high risk for preterm delivery. The journal of maternal-fetal & neonatal medicine : the official journal of the European Association of Perinatal Medicine, the Federation of Asia and Oceania Perinatal Societies, the International Society of Perinatal Obstetricians. 2011;24(11):1392–7.
6. Masselli G, Perrone G, Kinkel K, Di Tola M, Laghi F, Gualdi G, Brunelli R. Are Second Trimester Apparent Diffusion Coefficient Values of the Short Uterine Cervix Associated with Impending Preterm Delivery? Radiology. 2016;280(3):897–904.
7. Baños N, Perez-Moreno A, Julià C, Murillo-Bravo C, Coronado D, Gratacos E, Deprest J, Palacio M. Quantitative analysis of the cervical texture by ultrasound in the mid-pregnancy is associated with spontaneous preterm birth. Ultrasound in Obstetrics & Gynecology. 2017.
8. Baños N, Perez-Moreno A, Migliorelli F, Triginer L, Cobo T, Bonet-Carne E, Gratacos E, Palacio M. Quantitative Analysis of the Cervical Texture by Ultrasound and Correlation with Gestational Age. Fetal Diagnosis and Therapy. 2017;41(4):265–272.
9. McVeigh PZ, Syed AM, Milosevic M, Fyles A, Haider MA. Diffusion-weighted MRI in cervical cancer. European Radiology. 2008 [accessed 2018 Oct 15];18(5):1058–1064. http://link.springer.com/10.1007/s00330-007-0843-3
10. Balleyguier C, Sala E, Da Cunha T, Bergman A, Brkljacic B, Danza F, Forstner R, Hamm B, Kubik- Huch R, Lopez C, et al. Staging of uterine cervical cancer with MRI: guidelines of the European Society of Urogenital Radiology. European Radiology. 2011 [accessed 2018 Oct 15];21(5):1102–1110. http://link.springer.com/10.1007/s00330-010-1998-x
11. Panagiotaki E, Chan RW, Dikaios N, Ahmed H, O’Callaghan J, Freeman A, Atkinson D, Punwani S, Hawkes DJ, Alexander DC. Panagiotaki E, Chan RW, Dikaios N, et al. Microstructural characterization of normal and malignant human prostate tissue with vascular, extracellular, and restricted diffusion for cytometry in tumours magnetic resonance imaging. Invest Radiol. 2015;00:1--. Investigative Radiology. 2015 [accessed 2016 Jan 6];50(4):218–227. http://www.ncbi.nlm.nih.gov/pubmed/25426656
12. Panagiotaki E, Walker-Samuel S, Siow B, Johnson SP, Rajkumar V, Pedley RB, Lythgoe MF, Alexander DC. Noninvasive quantification of solid tumor microstructure using VERDICT MRI. Cancer research. 2014 [accessed 2015 Dec 3];74(7):1902–12. http://cancerres.aacrjournals.org/content/74/7/1902.long
13. Panagiotaki E, Schneider T, Siow B, Hall MG, Lythgoe MF, Alexander DC. Compartment models of the diffusion MR signal in brain white matter: a taxonomy and comparison. NeuroImage. 2012 [accessed 2016 Jan 6];59(3):2241–54. http://www.sciencedirect.com/science/article/pii/S1053811911011566
14. Ferizi U, Schneider T, Panagiotaki E, Nedjati-Gilani G, Zhang H, Wheeler-Kingshott CAM, Alexander DC. A ranking of diffusion MRI compartment models with in vivo human brain data. Magnetic Resonance in Medicine. 2014;72(6):1785–1792.
15. Veraart J, Sijbers J, Sunaert S, Leemans A, Jeurissen B. Weighted linear least squares estimation of diffusion MRI parameters: Strengths, limitations, and pitfalls. NeuroImage. 2013;81:335–346.
Figures