4046
DCE-MRI and T2* measurement of the endometrium in the menstrual and secretory phases: preliminary data in women with normal menstrual bleeding1Edinburgh Imaging Facility QMRI, The University of Edinburgh, Edinburgh, Scotland, 2Centre for Inflammation Research, The University of Edinburgh, Edinburgh, Scotland, 3Centre for Reproductive Health, The University of Edinburgh, Edinburgh, Scotland, 4BHF Centre for Cardiovascular Science, The University of Edinburgh, Edinburgh, Scotland
Synopsis
Heavy menstrual bleeding (HMB) affects approximately 1 in 4 menstruating women per year in the UK and has a severe impact on sufferers’ quality of life. Medical treatments are available but side effects are common and the underlying physiological mechanisms of HMB remain unclear. We imaged eight women with normal menstrual bleeding during the menstrual and secretory phases of the cycle, measuring endometrial T2*, microvascular plasma flow and microvascular plasma volume. We saw a shorter T2* at menstruation, adding to the evidence from other techniques that hypoxia may be important in cessation of bleeding and endometrial repair.
Introduction
Heavy menstrual bleeding (HMB) affects approximately 1 in 4 menstruating women per year in the UK1 and has a severe impact on sufferers’ quality of life2. In the US, economic impact has been estimated at >$2000 per patient per year3. Medical treatment is available, but side effects and treatment failure are common4. The physiological mechanisms underlying HMB are not clear, but previous work has shown that (amongst other factors), vasoconstriction and subsequent hypoxia may be important in cessation of bleeding and initiation of endometrial repair via controlled angiogenesis5. There is evidence that both hypoxia and angiogenesis are disturbed in women with HMB6, and a more complete understanding may allow identification of new therapeutic targets.
T2* quantification and Dynamic Contrast-Enhanced (DCE) MRI have been used in previous studies to indirectly detect hypoxia7,8 and angiogenesis9 in the context of gynaecological cancer. DCE-MRI has also shown variations in microvascular blood flow and blood volume in the inner myometrium during the menstrual cycle of women of reproductive age10. The aim of this work was to determine changes in these MR markers of hypoxia and angiogenesis between the secretory and menstrual phases in women with HMB and in healthy controls. Here, we report preliminary data from the endometrium in eight participants with normal menstrual bleeding (NMB).
Methods
Women of reproductive age with regular menstrual cycles (21-35 days), normal renal function and normal menstrual blood loss (<80 ml per cycle confirmed by menstrual blood loss measurement using the alkaline haematin assay11) were recruited. Women with significant fibroids, endometriosis or those using an IUD or exogenous hormones were excluded.
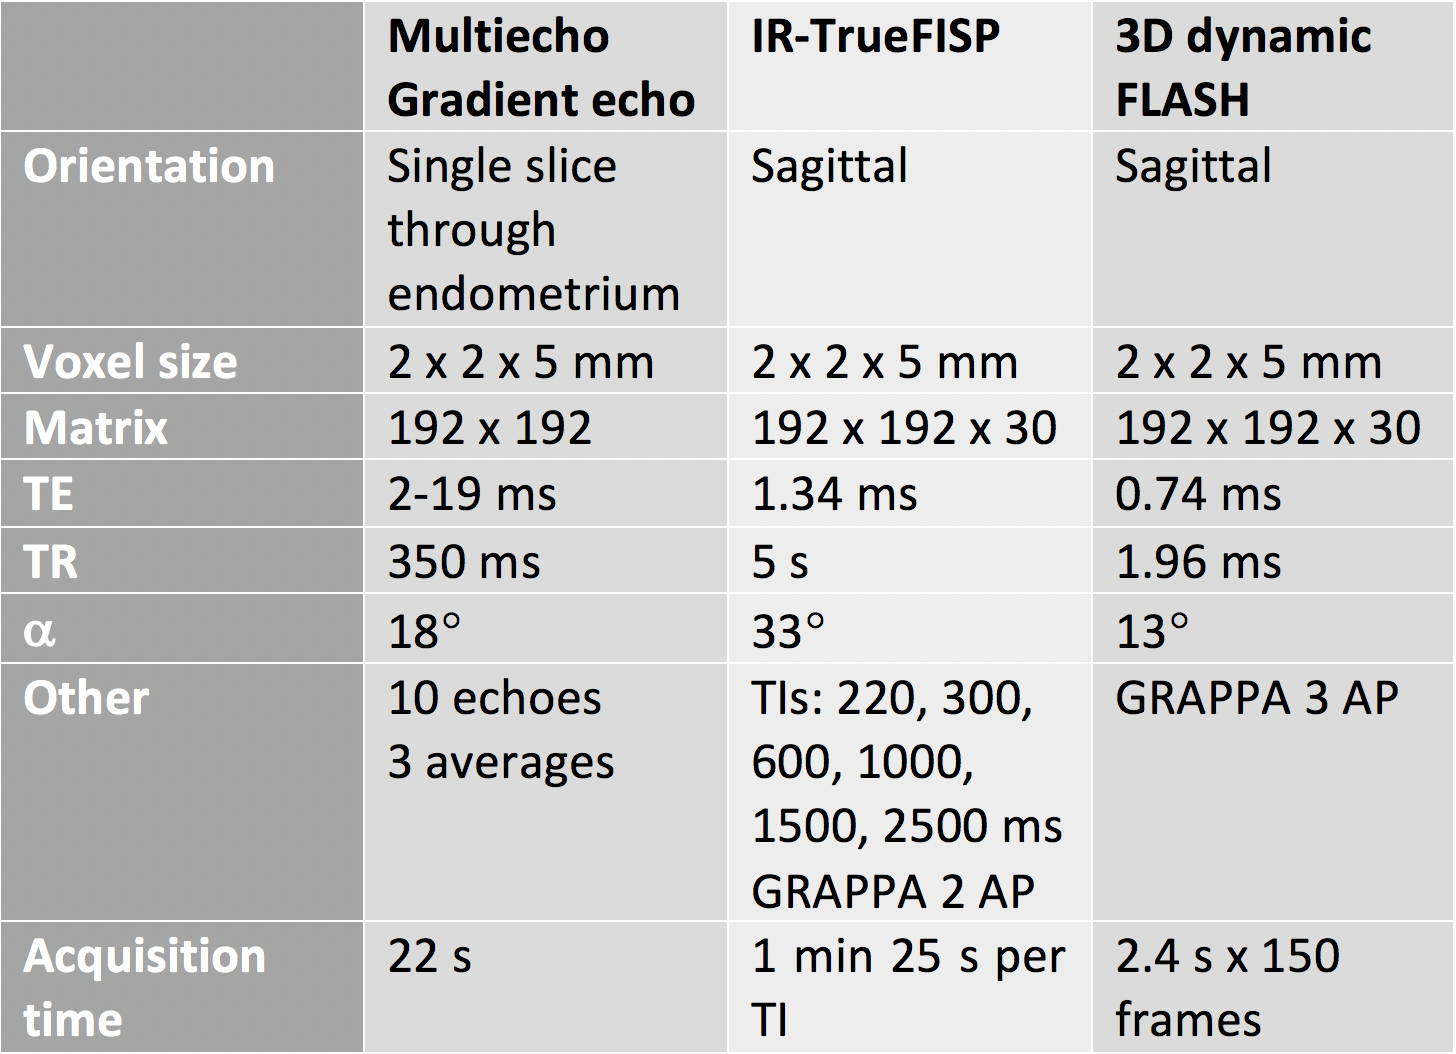
Each subject was imaged twice at 3 T, once in the mid/late secretory phase (day 10-30 dependent on cycle length) and once in the menstrual phase (day 1-3). Before imaging, 20 mg Buscopan was injected i.v. Images were acquired using a 32-channel (Siemens Verio) or 60-channel body array (Siemens Skyrafit). The examination included T2w TSE structural images in 3 planes, multiecho gradient echo (Siemens MyoMaps) to measure T2*, IR-TrueFISP to measure T1 and a dynamic 3D FLASH, which was acquired during injection of 0.1 mg/kg Gadovist followed by 20 ml saline chaser at the same rate. Sequence parameters are summarised in table 1.
T1 maps were calculated by fitting a standard inversion recovery curve to the IR-TrueFISP data using in-house software (Python 3.6), and T1 values were used to convert signal intensity to contrast agent concentration in the dynamic images. The two-compartment uptake model12 was fitted to concentration vs time curves on a voxel-by-voxel basis to estimate plasma flow (Fp) and plasma volume (vp), using AIFs derived at each visit from the common iliac arteries. Osirix was used to draw regions of interest on T2w images for transfer to the dynamic series, and to calculate mean T2* for the endometrium. Mean values for Fp and vp and their standard deviations were extracted for the uterus and endometrium using the PyOsirix plugin13.
A paired t-test was used to analyse the change in parameters between the two visits.
Results
All patients completed both visits except one who did not undergo DCE-MRI in the secretory phase due to technical difficulties.
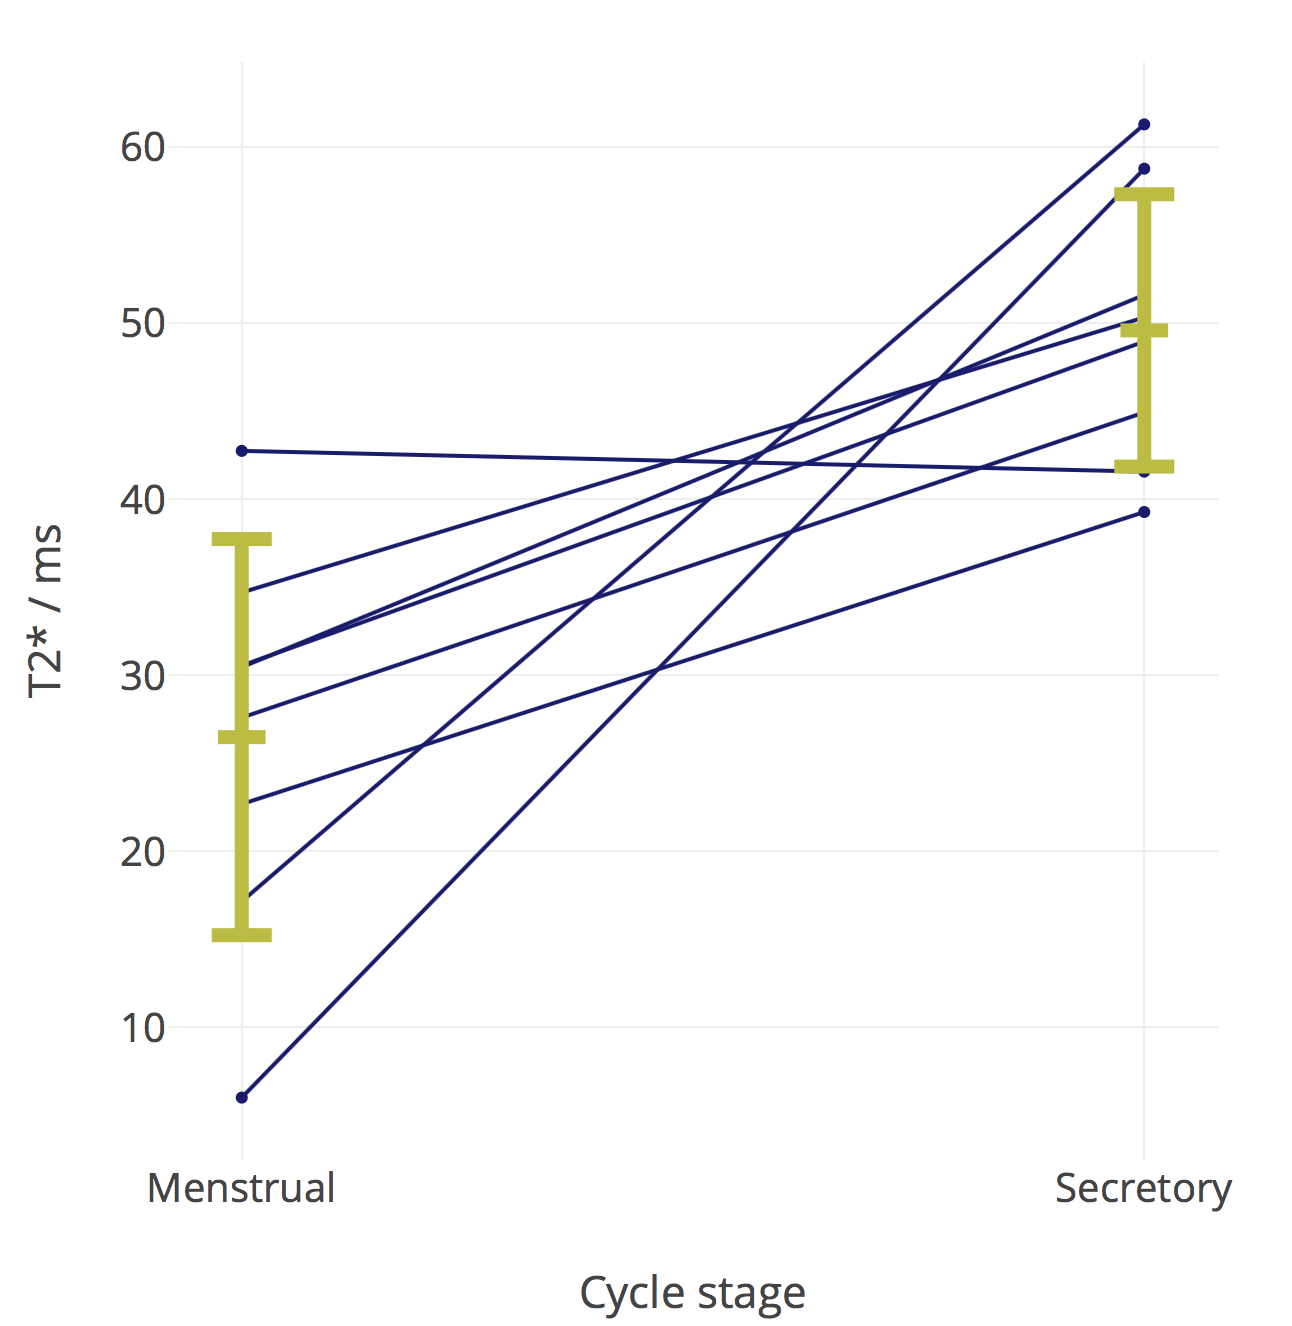
There was a significant increase in endometrial T2* in the mid-secretory phase compared to the menstrual phase (figure 1, p = 0.007). There was a significant decrease in Fp in the mid-secretory phase (p = 0.03).
Discussion and conclusions
Our results show a trend towards a decrease in Fp in the mid-secretory phase, which may be due to more dilated microvessels in comparison with the menstrual phase, but in this small number of patients we saw no significant change in vp. This finding will require confirmation once recruitment is complete. We also showed a significantly higher T2* in the mid-secretory phase compared to the menstrual phase, which may reflect the presence of hypoxia at menstruation, adding to the existing evidence from previous studies.Further work
We intend to recruit a total of 30 women to the study, 15 with HMB and 15 with NMB.Acknowledgements
This study has been funded by the Wellbeing of Women (RG1820) and MRC Centre for Reproductive Health (NR/N022556/1). We are grateful to the radiographers at the Edinburgh Imaging Facility QMRI; the clinical research nurses Helen Reynolds, Lucy Smith, Sharon McPherson and Catherine Murray for their help with recruitment; and to Kate Walker for technical assistance.References
1. Shapley, M., Jordan, K. & Croft, P. R. An epidemiological survey of symptoms of menstrual loss in the community. Br. J. Gen. Pract. 54, 359–363 (2004).
2. NICE. Heavy menstrual bleeding: assessment and management. (2007).
3. Frick, K. D. et al.Financial and Quality-of-Life Burden of Dysfunctional Uterine Bleeding Among Women Agreeing To Obtain Surgical Treatment. Women’s Heal. Issues 19, 70–78 (2009).
4. Marjoribanks, J., Lethaby, A. & Farquhar, C. Surgery versus medical therapy for heavy menstrual bleeding. Cochrane Database Syst. Rev. (2006).
5. Smith, S. K. Regulation of angiogenesis in the endometrium. Trends Endocrinol. Metab. 12, 147–151 (2001).
6. Critchley, H. O. D. & Maybin, J. A. Molecular and cellular causes of abnormal uterine bleeding of endometrial origin. Semin. Reprod. Med. 29, 400–409 (2011).
7. Okada, T., Harada, M., Matsuzaki, K., Nishitani, H. & Aono, T. Evaluation of female intrapelvic tumors by clinical proton MR spectroscopy. J. Magn. Reson. Imaging 13, 912–917 (2001).
8. Hallac, R. R. et al.Oxygenation in cervical cancer and normal uterine cervix assessed using blood oxygenation level-dependent (BOLD) MRI at 3T. NMR Biomed. 25, 1321–1330 (2012).
9. Haldorsen, I. S. et al.Increased microvascular proliferation is negatively correlated to tumour blood flow and is associated with unfavourable outcome in endometrial carcinomas. Br. J. Cancer 110, 107–114 (2014).
10. Thomassin-Naggara, I. et al.Dynamic contrast-enhanced MR imaging to assess physiologic variations of myometrial perfusion. Eur. Radiol. 20, 984–94 (2010).
11. Hallberg, L. & Nilsson, L. Determination of menstrual blood loss. Scand. J. Clin. Lab. Invest.(1964).
12. de Bazelaire, C. et al.Comprehensive model for simultaneous MRI determination of perfusion and permeability using a blood-pool agent in rats rhabdomyosarcoma. Eur. Radiol. 15, 2497–505 (2005).
13. Blackledge, M. D., Collins, D. J., Koh, D.-M. & Leach, M. O. Rapid development of image analysis research tools: Bridging the gap between researcher and clinician with pyOsiriX. Comput. Biol. Med. 69, 203–212 (2016).
Figures