4045
Could Whole-Tumor Histogram and Texture Analysis of conventional DWI and DKI Identify Histologically Features of Rectal Cancer? A Preliminary Study1Fudan University Shanghai Cancer Center, Shanghai, China, 2Application development, Siemens Shenzhen Magnetic Resonance Ltd, Shenzhen, China, 3MR Scientific Marketing, Siemens Healthcare, Shanghai, China
Synopsis
We investigate the potential of the whole-tumor histogram and texture analysis of the conventional DWI and DKI derived parameters to predict the histology of rectal cancer. Our study demonstrated that the whole-tumor histogram features of ADC and DKI maps could depict the histology of rectal cancer.
Introduction
Whole-tumor histogram analysis could provide information on tumor heterogeneity and had good performance in differentiating tumor grades, evaluating tumor responseto the therapy and predicting prognosis[1-4]. The purpose of this study was to explore the performance of whole-tumor histogram and texture analysis of diffusion kurtosisimaging (DKI) in predicting the histology of rectal cancer.Materials and methods:
Between June 2016 and November 2017, totally 43 patients with histologically confirmed primary rectal cancer, and who underwent total mesorectal excision without neoadjuvant chemoradiation were retrospectively enrolled in our study. The pathological T stage, N stage, differentiation grade, circumferential resection margin (CRM), perineural invasion (PNI), lymphovascular invasion (LVI), KRAS, NRAS and BRAF were recorded. All patients underwent pre-operation MRI including SE-EPI based DWI sequence, with parameters as following: b values = 0, 700, 1,400 and 2,100 s/mm2; FOV = 240×180 mm2; scan matrix = 120×120; TE/TR = 4,800/79 ms; bandwidth =1,894 Hz/pixel;ADC map with all acquired b values were inline calculated after acquisition. Parameter maps of DKI model were calculated offline with all acquired b values by using the prototype Body Diffusion Toolbox (Siemens Healthcare, Germany, Erlangen). Whole tumor histogram and texture analysis of the parameter maps was performed on the prototype MR Multiparametric Analysis software (Siemens Healthcare, Germany, Erlangen). The histogram features included Volume, Mean, Standard deviation (SD), Median(Med), Percentiles (75th, 95th), Skewness(ske), Excess Kurtosis(ExcKur) and Difference Entropy (DiffEnt). The texture features included Difference Variance(DiffVar), Contrast and Entropy (Ent). ANOVA test was used to compare the histogram and texture features of ADC, K and D based on histological and genetic factors. The area under curve (AUC) of receiver operating characteristic curve (ROC), cut-off values, sensitivity and specificity were also evaluated.Results
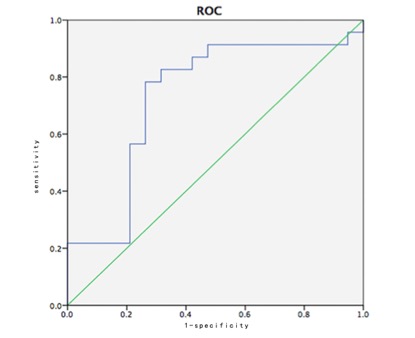
The whole tumor volume of T1-2, N0, well differentiation and CRM (-) were smaller than T3-4, N (+), poor-moderate differentiation and CRM (+) respectively . While the whole tumor volume of KRAS, NRAS and BRAF wild-type were smaller than KRAS, NRAS and BRAF mutation-type respectively, though, the differences were not statistically significant. ADCSD,ADC ExcKur values of N (+) were significantly higher than N0 (p=0.023, 0.036,respectively). ADCSD, DSD and KExckur values of PNI positive were significantly higher than PNI negative (p=0.001, 0.009, 0.009). DSke value of KRAS mutation-type was significantly higher than KRAS wild-type (p=0.023). The well differentiation’s ADCSD,ADC75th,ADC95th, DSD,D95th,DSke values is significantly lower than poor-moderate differentiation’s (p=0.008, 0.001, 0.012, 0.034, 0.007, 0.001). KMed value of well differentiation is significantly higher than poor-moderate differentiation (p=0.026). ADCExcKur、DExcKur values of CRM positive were higher than CRM negative (p<0.001, 0.009).The AUC of the multi-parametric ADCSD,ADCExcKur for predicting metastatic lymph nodes was 0.816 (p<0.001) (Figure 1), sensitivity and specificity were 81.0%, 76.2% respectively. The AUC of multi-parametric ADCSD,DSD, KExckur for predicting PNI involved was 0.830 (p<0.001) (Figure 2), sensitivity and specificity were 80%, 88.9% respectively. DSke can be used to diagnose KRAS status and the cut-off value was 0.465. The AUC, sensitivity and specificity were 0.732 (p=0.010) (Figure 3),78.3%, 73.7% respectively. None of the 3 texture features including difference variance, contrast and entropy of both ADC and DKI derived parameters had significant difference among different pathological features of the rectum tumors.Discussion
Our study demonstrated that several whole-tumor histogram features of the conventional DWI and DKI derived parameter maps could depict histology of rectal cancer, while none of the texture features had the capability. The reason might be that the spatial resolution of the EPI DWI sequence is not sufficient enough for the texture analysis on the rectal tumor, which normally has a long and narrow shape. Using a higher spatial-resolution DWI sequence based on segmented EPI or small-FOV EPI using 2D RF excitation might improve the performance of the texture analysis.Conclusion
Whole-tumor histogram features of the conventional DWI and DKI derived parameters have the potential to predict the histology of rectal cancer.Acknowledgements
No acknowledgement found.References
[1]QI XX, SHI DF, REN SX, et al. Histogram analysis of diffusion kurtosis imaging derived maps may distinguish between low and high grade gliomas before surgery[J].Eur Radiol. 2018. 28(4): 1748-1755.
[2] DE ROBERTIS R, MARIS B, CARDOBI N, et al. Can histogram analysis of MR images predict aggressiveness in pancreatic neuroendocrine tumors[J]. Eur Radiol. 2018. [Epub ahead of print].
[3LIU HL, ZONG M, WEI H, et al. Differentiation between malignant and benign breast masses: combination of semi-quantitative analysis on DCE-MRI and histogram analysis of ADC maps[J]. Clin Radiol. 2018. 73(5).
[4]NAKAJO M, FUKUKURA Y, HAKAMADA H, et al. Whole-tumor apparent diffusion coefficient (ADC)histogram analysis to differentiate benign peripheral neurogenic tumors from soft tissue sarcomas[J]. J Magn Reson Imaging. 2018. [Epub ahead of print].
Figures