4036
Evaluating effect of Combination and Number of Multiple b-values in IVIM Analysis of Prostate1Centre for Biomedical Engineering, Indian Institute of Technology Delhi, New Delhi, India, 2Department of Radiology, All India Institute of Medical Sciences Delhi, New Delhi, India, 3Department of Physics, Indian Institute of Technology Delhi, New Delhi, India, 4Sydney Imaging and School of Aerospace, Mechanical and Mechatronic Engineering, University of Sydney, Sydney, Australia, 5Department of Biomedical Engineering, All India Institute of Medical Sciences Delhi, New Delhi, India
Synopsis
Optimization of b-values in DWI-IVIM is necessary for precision and reproducibility of parameter estimation. The IVIM biexponential model with Total variation correction (BE+TV) method was used here, which reduces sudden changes in parameter values and removes non-physiological heterogeneity in maps. Various b-value combinations were utilized in prostate: 4, 8 and 13 b-values. 8 and 13 b-values showed similar trend in coefficient of variation (CV), which was confirmed using Bland-Altman plots, including comparable qualitative maps; in contrast, 4 b-values showed variable CV and noisy maps. In prostate, 8 b-values can be used with Total Variation method for faster acquisition protocol and low variability in parameter maps.
Introduction
DWI-Intravoxel Incoherent Motion (DWI-IVIM) MR imaging helps in understanding tumor microstructure and its vasculature.1 Currently, DWI-IVIM is not often included in clinical protocols, as it lacks standard protocols (e.g. for prostate cancer imaging) and parameter maps generated with standard model1 produces non-physiological noise in the data. A novel analysis method using DWI-IVIM model with total variation penalty function2,3 has been proposed recently that claims to have qualitatively better parametric maps. However, evaluation of combination and number of b-values is necessary for precise calculation of parameters, and to understand how the choice of b-values could be affected if a different analysis post-processing methodology is adopted.Methodology
Clinical Data acquisition: Six male patients with prostate cancer (63±4.48yrs) were recruited at AIIMS-Delhi, and underwent standard MRI protocol, including DWI-IVIM imaging with 13b-values=0,25,50,75,100,150,200,500,800,1000,1250,1500,2000s/mm2 using phased-array surface coil with 1.5T MRI (Achieva; Philips Healthcare, Best, the Netherlands).
b-values combinations: Five different combinations and number of b-values were selected according to literature5. For different number of b-values only 4, 8 and 13b-values were chosen. 11 to 13b-values are standard routine for IVIM acquisition4-10, whereas 8 b-values used in multiple studies with shorter protocols4-8 and 4b-values have been suggested as optimal number by Dyvorne et.al5. For 4 and 8b-values two different combination were also used to evaluate the effect of combination of b-values(s/mm2) on parametric estimation:
4b-values1:[0,25,200,2000],
4b-values2:[0,50,150,2000],
8b-values1:[0,25,75,100,200,800,1250,2000],
8b-values2:[0,50,75,150,500,800,1500,2000],
13b-values:[0,25,50,75,100,150,200,500,800,1000,1250,1500,2000];
Analysis and parameter error calculations: Parameter estimation was performed using in-house toolbox in MATLAB. Clinical data were processed using biexponential model(BE)1 and biexponential model+TV (BE+TV)3. Non-least linear square optimization was used keeping three free parameters(D, D*, f) for both BE and BE+TV. In BE+TV model, TV parameters(alpha and beta) were set to 0.02 and 0.99, respectively.
For precision of parameter estimation, coefficient of variation(CV) was calculated and Bland-Altman plots were used to visualize agreement between protocols(Spearman's rho). Wilcoxon Signed-Rank test was used for statistical comparision between models and methods.
Three ROIs of 18x18 were drawn on tumor region, part of Transition zone(Tz), and Peripheral zone(Pz) of prostate using DWI at b=0 s/mm2 in every patient.
Results
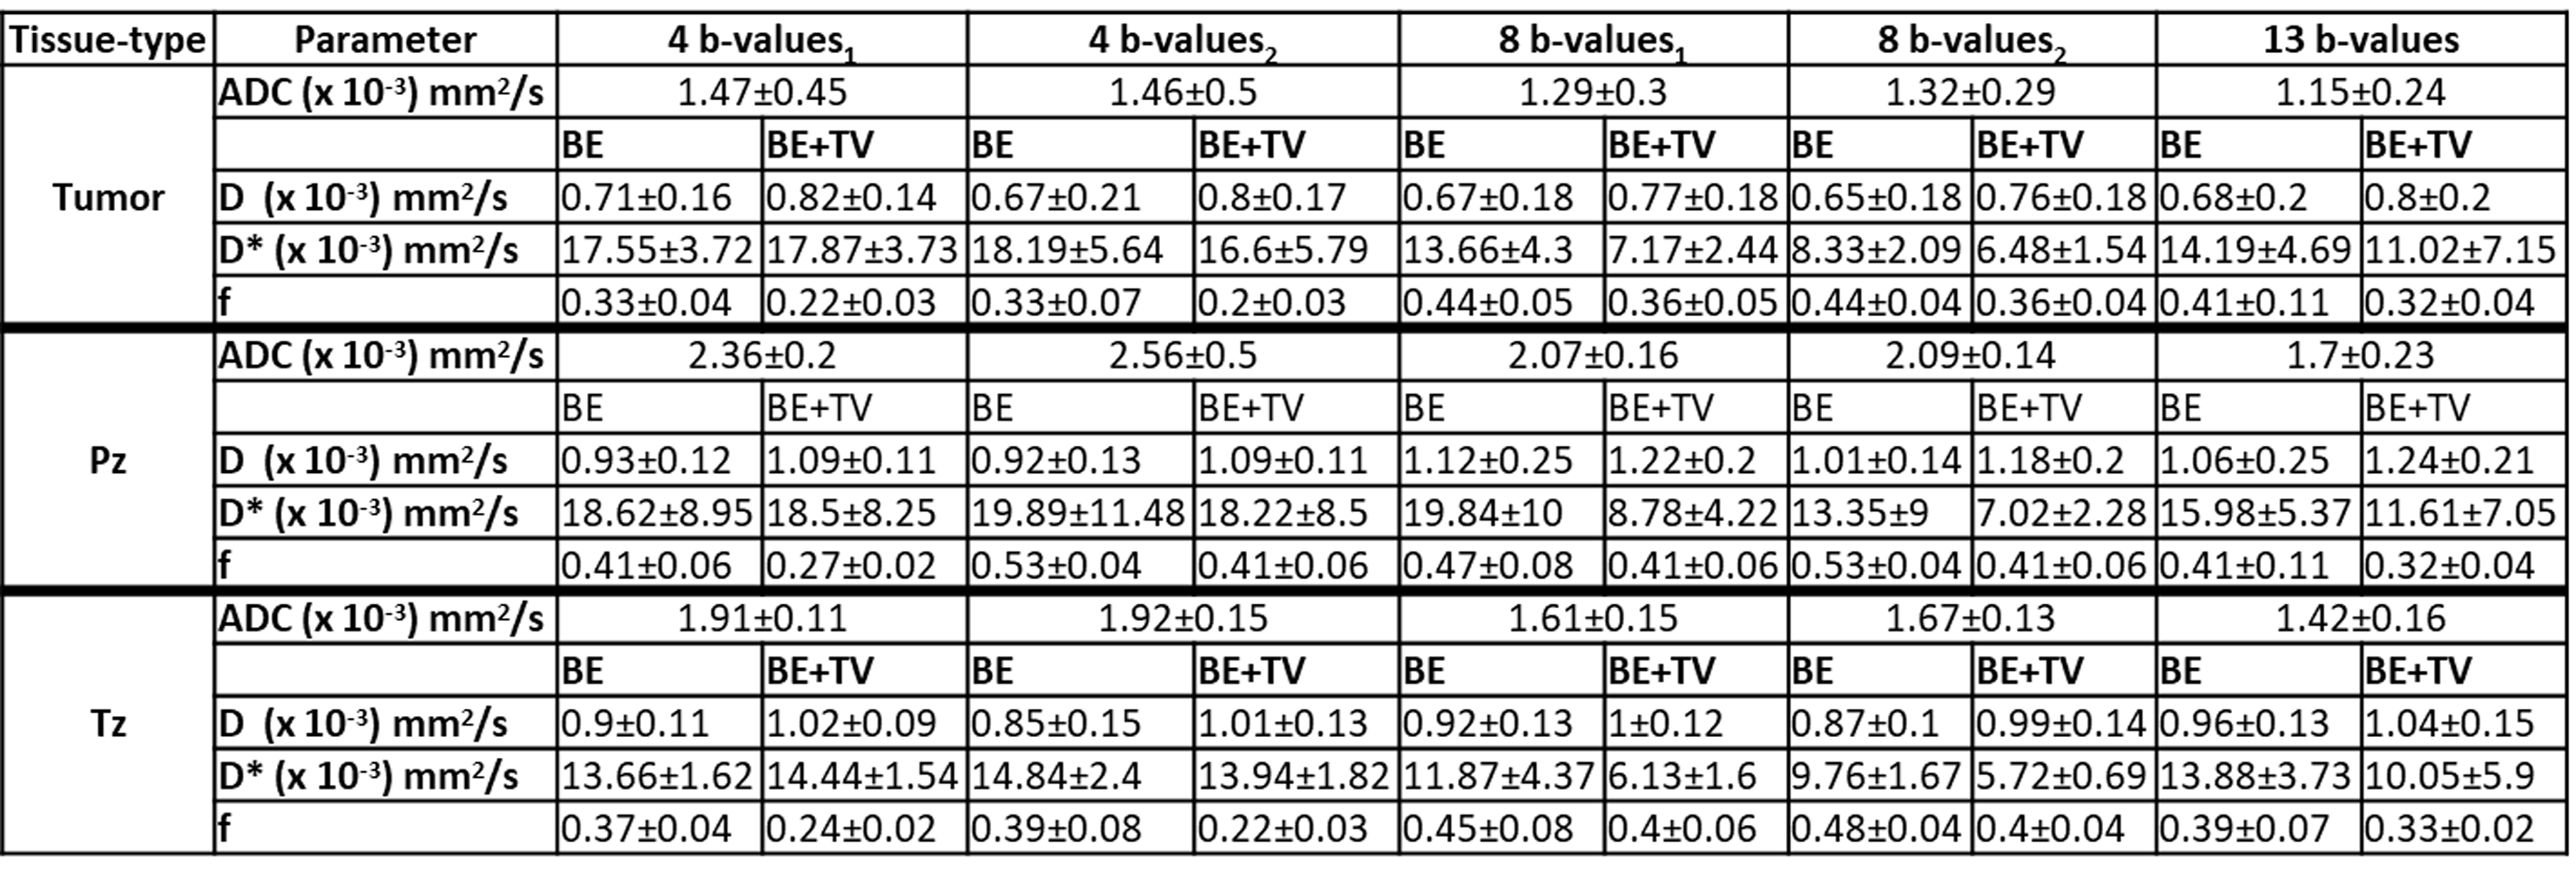
Average values of parameters for prostate with BE and BE+TV using 4,8,13b-values are shown in Table 1. There were no significant differences in any parameter or between the models for 4b-values1 vs 4b-values2. ADC was significantly different(p<0.05) for 8b-value1 vs 8b-values2 in Tz. Average value of D and f remained similar for any b-values combinations or models, whereas in D*(BE) there was significant differences(p<0.05) for 8b-value1 vs 8b-values2 in tumor.
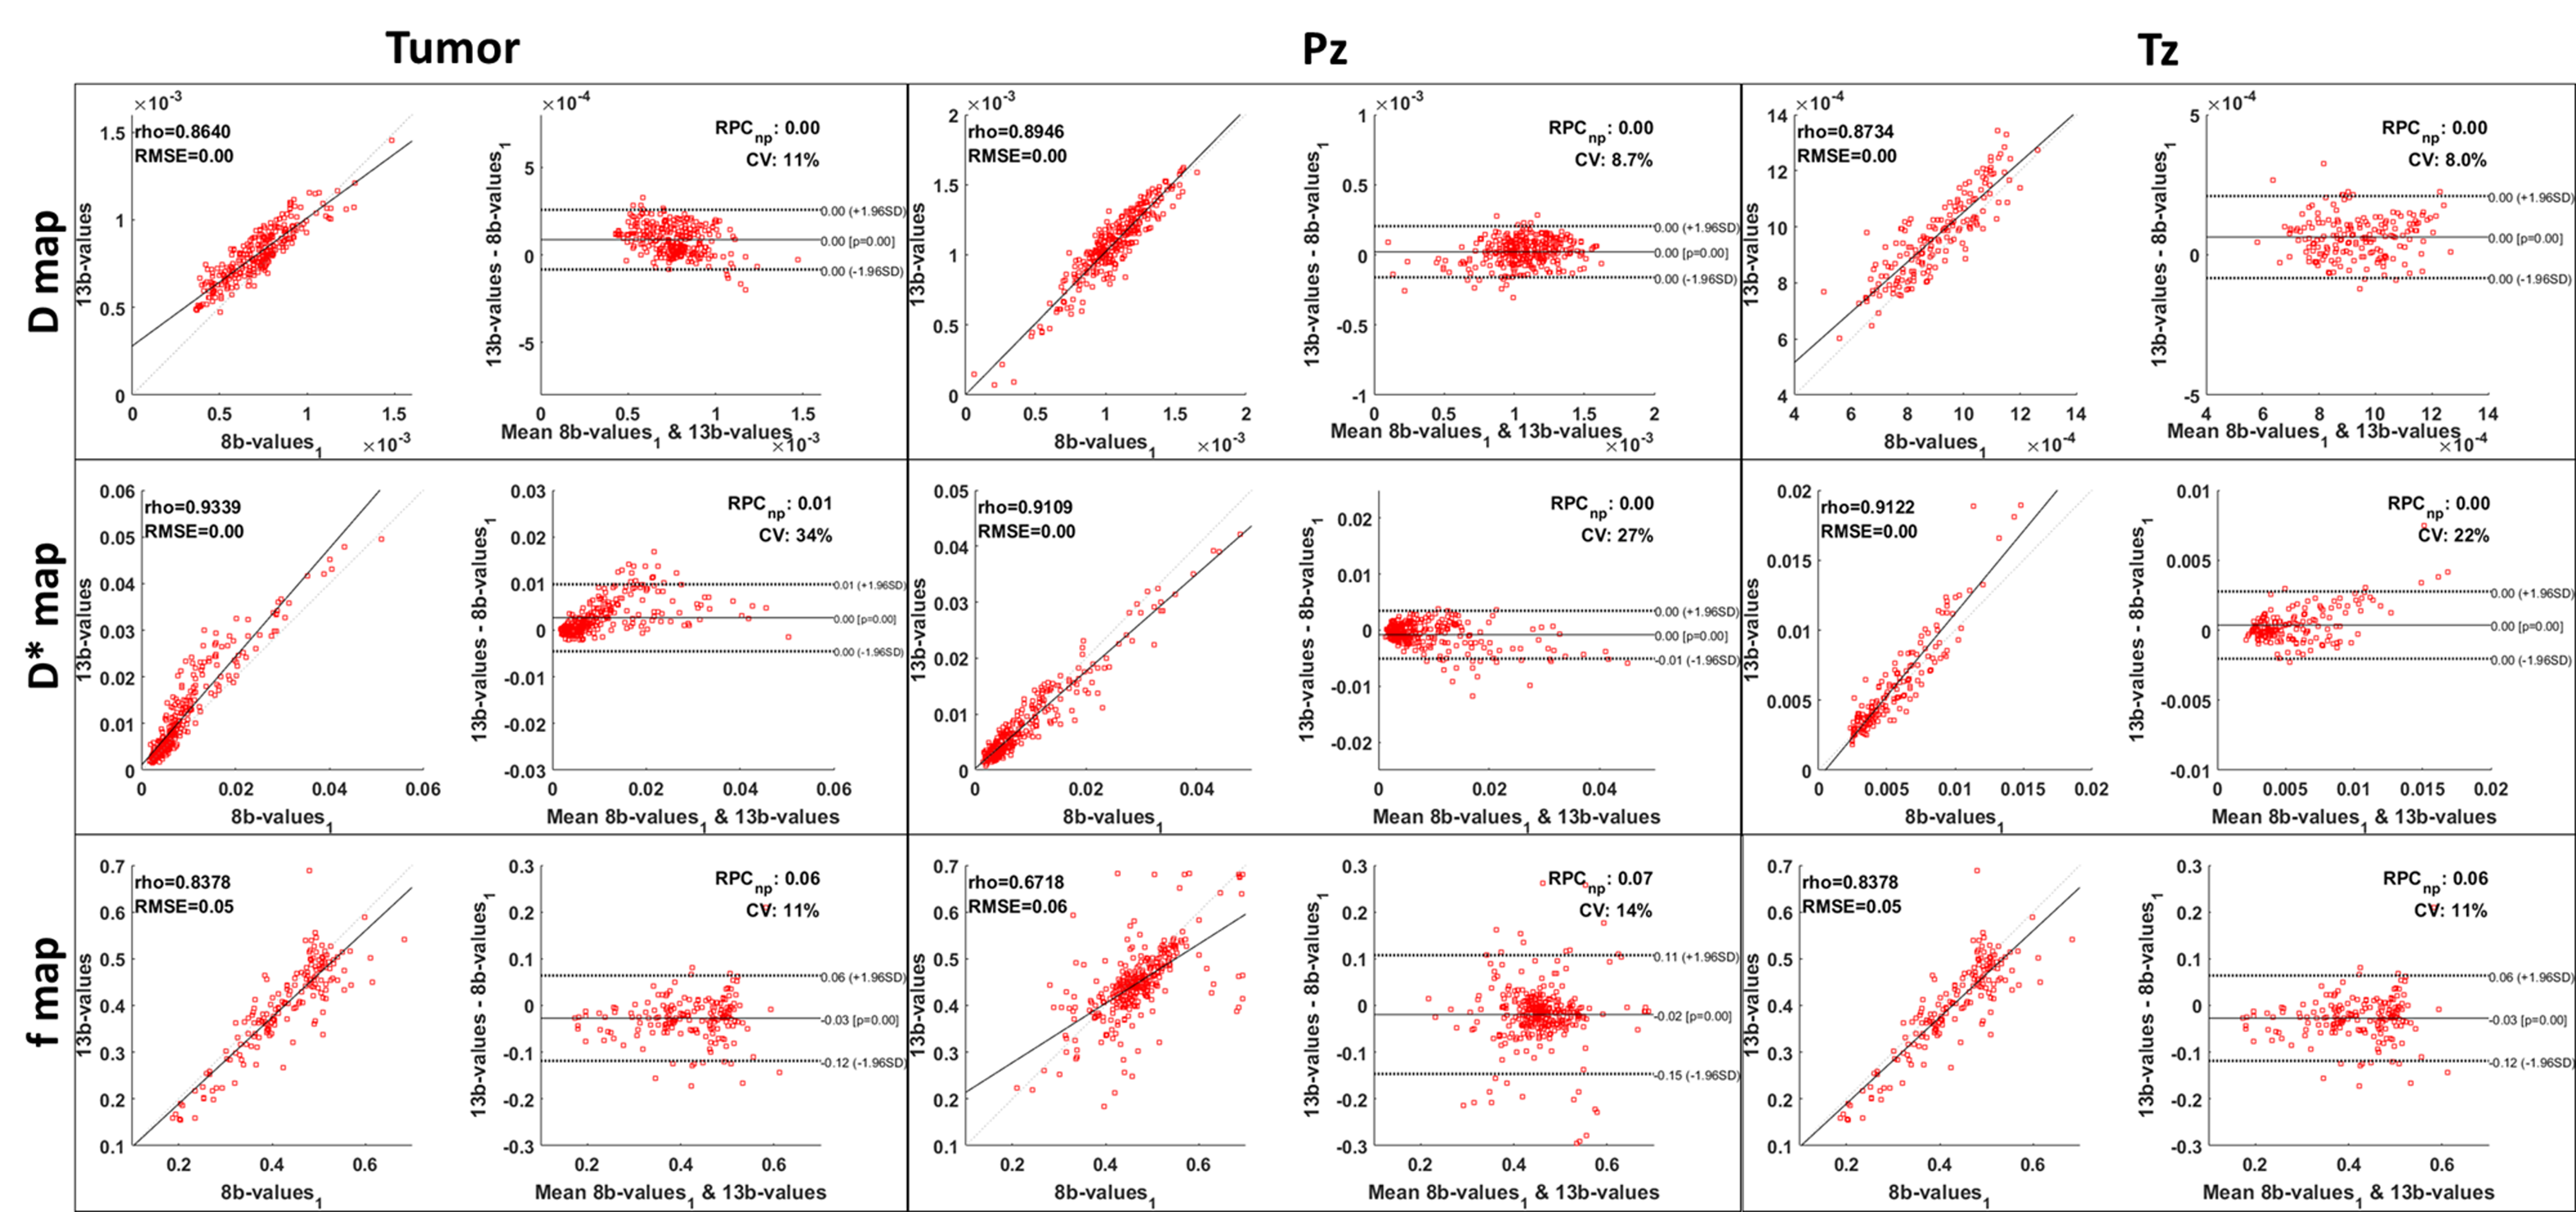
Figure 1 shows the Bland-Altman plot to display agreement in estimated parameters while using 8 and 13b-values with BE+TV method for DWI-IVIM analysis. For all parameters the data points fall within ±2SD interval of the Bland-Altman plot. For all three parameters a tight correlation was observed among 8 and 13b-value(rho=0.83-0.93) except for f in Pz region.
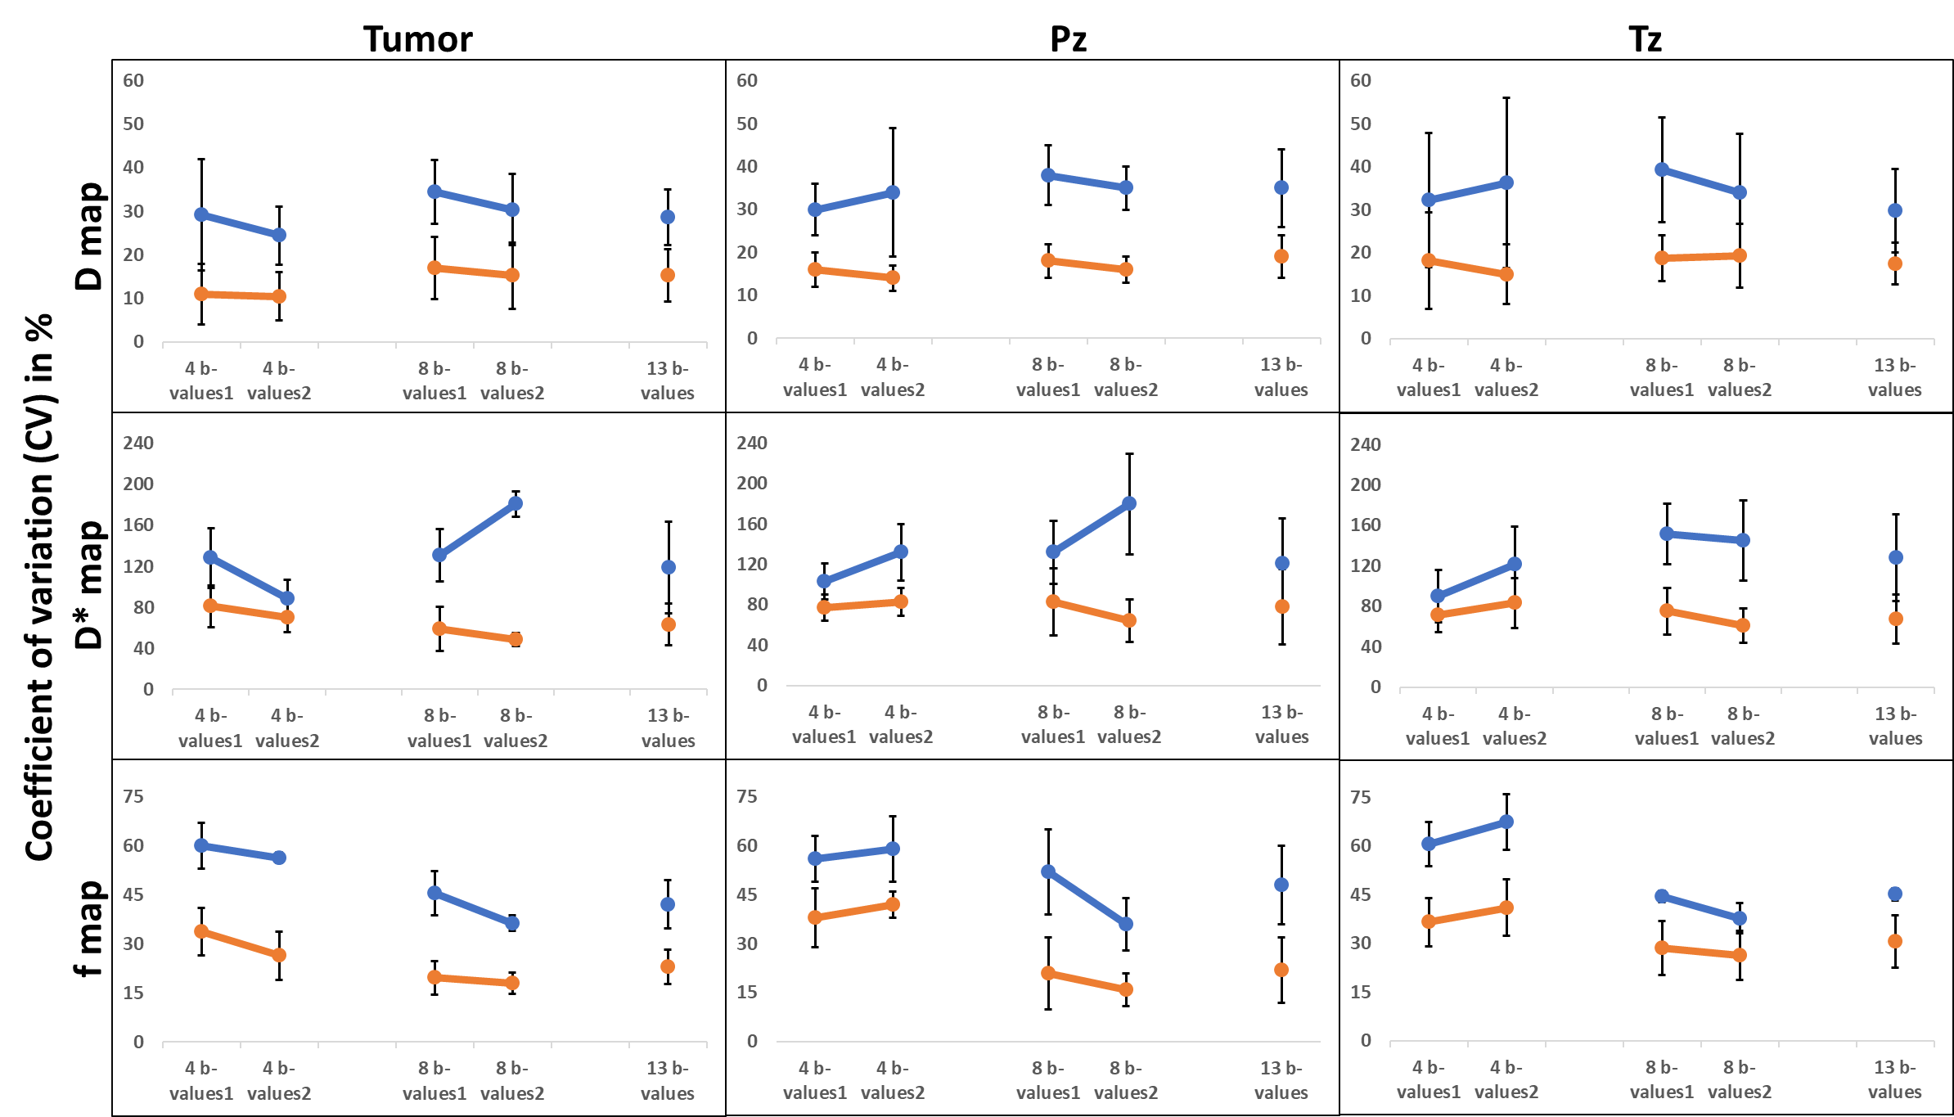
Figure 2 shows CV for parameters of tumor, Tz, and Pz, regions; BE+TV consistently showed lower value of CV by 30-50% as compared to BE. No significant differences(p<0.05) between 4b-values1 vs 4b-values2 except for D*(BE) of Tz. For 8b-value1 vs 8b-values2, significant differences(p<0.05) in D(BE) of tumor and Tz, D*(BE) of Tz and f(BE) of Pz and Tz. BE+TV method observed to be robust to different combination of b-values in both groups 4 or 8b-values; has no significant different in CV among two different combination for either using 4b-values or 8b-values. CV of parameter using 13b-values showed the lowest variability.
Discussion
Appropriate selection of b-values is necessary for IVIM analysis in any clinical protocol, as it can directly impact acquisition time. Selection of b-value set should ideally not affect the precision of parameter estimation, even with different methodology. In this study, five combinations of b-values were used for data with prostate cancer and analyzed using BE and BE+TV method. The values of IVIM parameter for prostate as observed with BE+TV methods were found to be comparable with literature4. Most studies in the literature have used over 11 b-values for accurate estimation of parameters6-10.
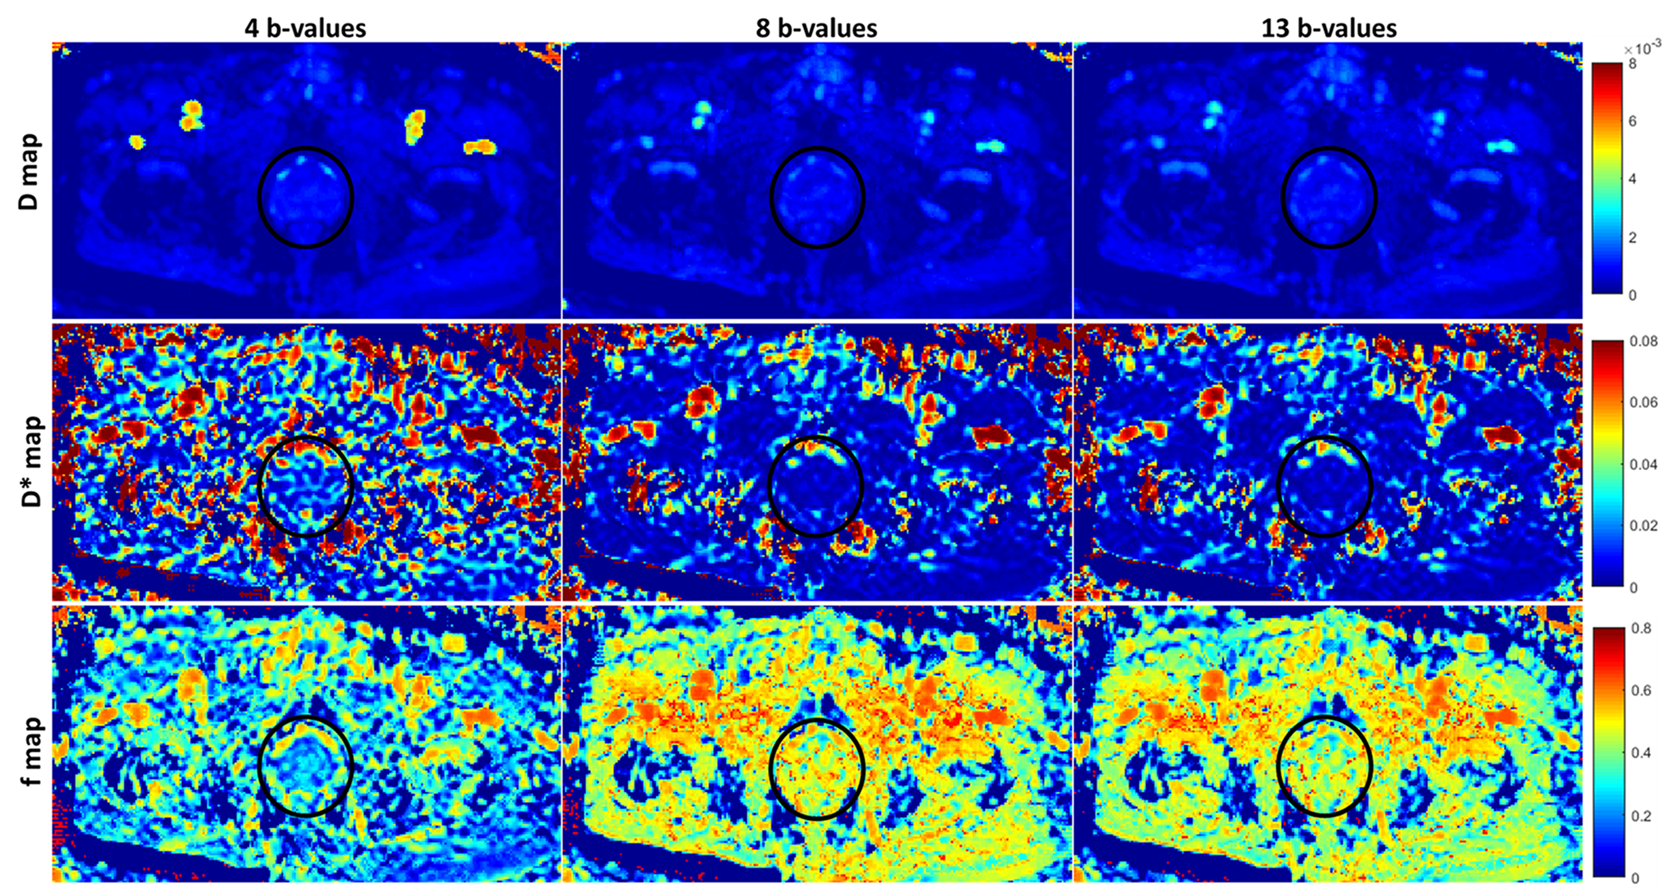
CV was consistently lower for BE+TV method3 compared to standard method,1 and Bland-Altman plot showed good agreement in estimated parameters using 8 and 13b-values with BE+TV method. Poor image quality was observed while using 4b-values. However, parametric image quality and values of parameters show no difference among 8 and 13b-values when using BE+TV method as shown in Figure 3. BE+TV method is also robust to different combination of 8b-values in estimation of parameters.
Conclusions
IVIM model with TV penalty function can be used for prostate cancer imaging. Combination of 8b-values is sufficient while using this method for analysis, facilitating a reduced acquisition protocol for clinical applications.Acknowledgements
This study was supported by IIT Delhi, New Delhi and AIIMS Delhi, New Delhi. AVM was supported with research fellowship fund from Ministry of Human Resource Development, Government of India.References
- Le Bihan D, Breton E, Lallemand D et al. Separation of diffusion and perfusion in intravoxel incoherent motion MR imaging. Radiology. 1988;168(2):497-505.
- Rudin LI, Osher S, Fatemi E. Nonlinear total variation based noise removal algorithms. Physica D: nonlinear phenomena. 1992;60(1-4):259-68.
- Kayal EB, Kandasamy D, Khare K et al. Quantitative Analysis of Intravoxel Incoherent Motion (IVIM) Diffusion MRI using Total Variation and Huber Penalty Function. Medical physics. 2017;44(11):5849-58.
- Döpfert J, Lemke A, Weidner A et al. Investigation of prostate cancer using diffusion-weighted intravoxel incoherent motion imaging. Magnetic resonance imaging. 2011;29(8):1053-8.
- Dyvorne H, Jajamovich G, Kakite S et al. Intravoxel incoherent motion diffusion imaging of the liver: optimal b-value subsampling and impact on parameter precision and reproducibility. European journal of radiology. 2014;83(12):2109-13.
- Liu C, Liang C, Liu Z et al. Intravoxel incoherent motion (IVIM) in evaluation of breast lesions: comparison with conventional DWI. European journal of radiology. 2013;82(12):e782-9.
- Ichikawa S, Motosugi U, Ichikawa T et al. Intravoxel incoherent motion imaging of focal hepatic lesions. Journal of Magnetic Resonance Imaging. 2013;37(6):1371-6.
- Mazzoni LN, Lucarini S, Chiti S et al. Diffusion‐weighted signal models in healthy and cancerous peripheral prostate tissues: Comparison of outcomes obtained at different b‐values. Journal of Magnetic Resonance Imaging. 2014;39(3):512-8.
- Beyhan M, Sade R, Koc E et al. The evaluation of prostate lesions with IVIM DWI and MR perfusion parameters at 3T MRI. La radiologia medica. 2018;1:1-7.
- Wu Q, Wang Y, Shi L et al. Intravoxel Incoherent Motion Diffusion-Weighted Magnetic Resonance Imaging of Cervical Cancer With Different b-Values. Journal of computer assisted tomography. 2017;41(4):592-8.
Figures