4034
Ensemble learning-based analysis of T1-weighted and T2-weighted magnetic resonance (MR) radiomics for the prediction of prostate cancer grades with small-scale cohort1Baoji Central Hospital, Baoji, China
Synopsis
Traditionally, PCA diagnosis and classification are based on prostate specific antigen (PSA) levels, ultrasound and biopsy. This study combines Adasyn and XGBOOST methods to compare the predictive effects of T1-weighted, T2-weighted and T1-T2 co-registration MR images on prostate cancer. The results showed that the integrated learning algorithm using XGBoost can effectively predict prostate cancer grade based on T2WI radiomics features,and T2WI has a better prognostic performance compared with T1-T2 fusion images.
Introduction
Prostate cancer (PCa) has posed major public health concern worldwide. According to a new and widely-accepted grading scheme1, Accurate grading, i.e. grade prediction, has substantial interest in PCa treatment and prognosis.There are various widely applied tree-based ensemble learning models, such as bagging, random forests and boosting2. Among all these models, XGBoost, an implementation of gradient boosting, which is reported to achieve state-of-the-art results on many machine learning challenges, and has just stepped into the radiomics field3. ADASYN is a modified version of Synthetic Minority Over-sampling Technique (SMOTE). ADASYN has successfully applied into medical imaging recently4, 5.we are the first as far to combine ADASYN and XGBoost method to compare the predictive efficacy of T1-weighted, T2-weighted and T1-T2 co-registered MR image on the prostate cancer grading and hope to obtain considerable classification prognosis effect and assist in clinical diagnosis of prostate cancer.The present study aimed to construct predictive models for prostate cancer grading by combining T1-weighted and T2-weighted magnetic resonance (MR) radiomics features.Methods
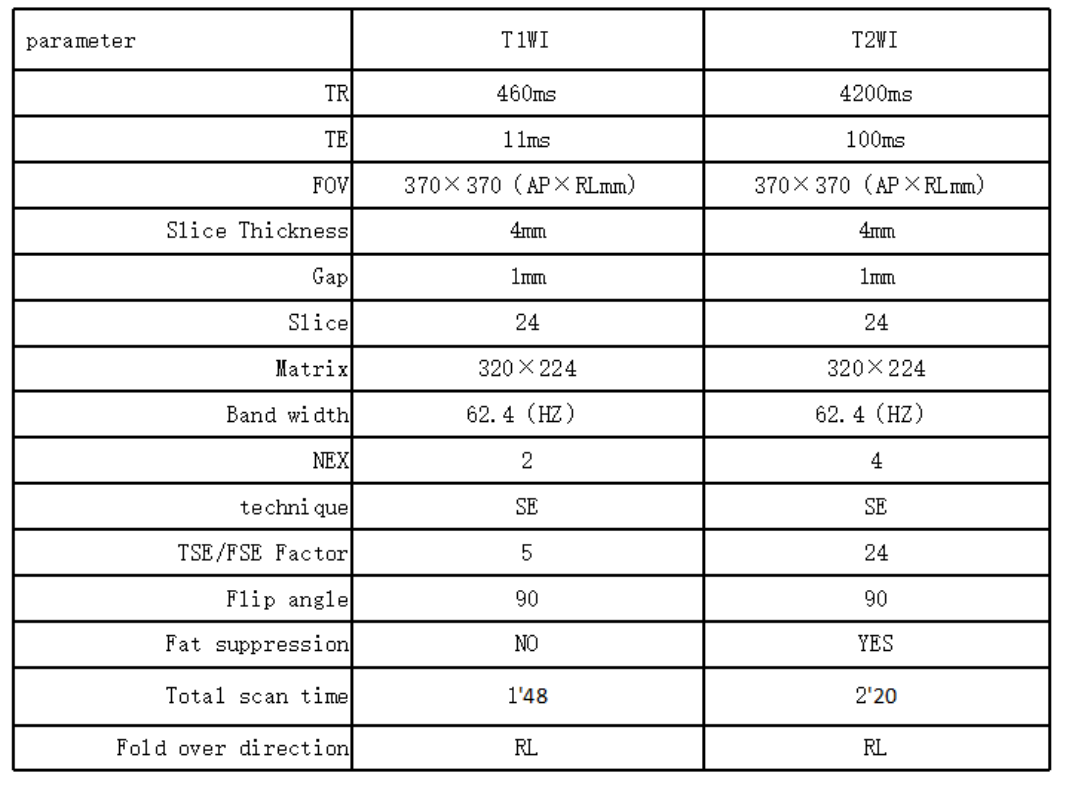
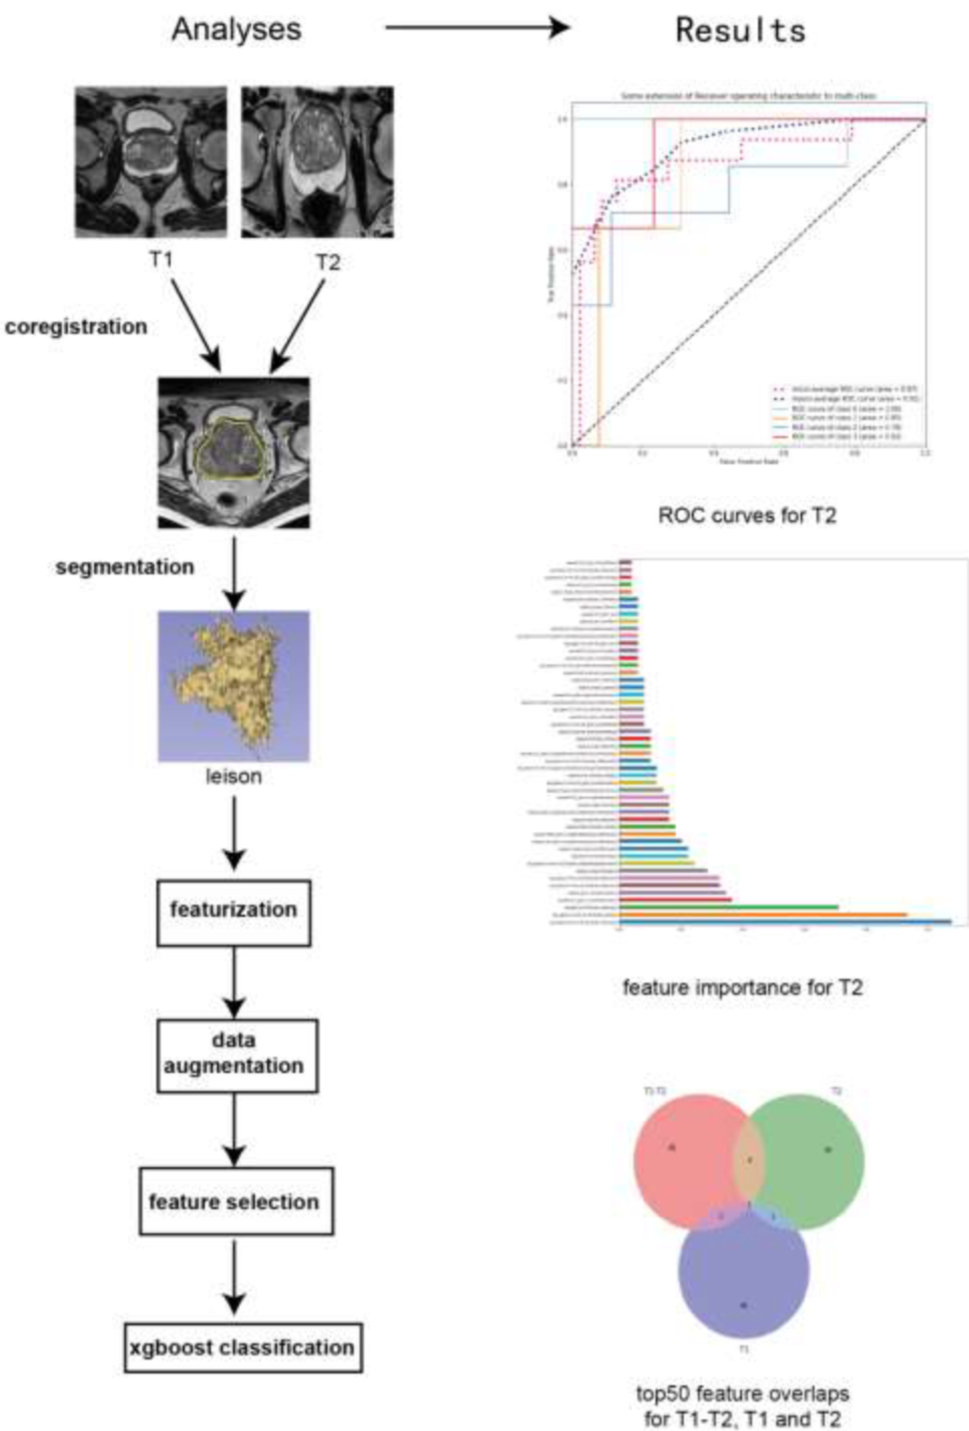
Sequence parameters refer to table 1. A cohort of 33 samples of prostate cancer (PCa) with T1-weighted images (T1WI) and T2-weighted images (T2WI) was gained from the Baoji Central Hospital(Sequence parameters refer to table 1). T1WI and T2WI were co-registered by Statistical Parametric mapping 12 (SPM 12) and then fused via 3DSlicer. After Adaptive Synthetic (ADASYN) was used to balance the data, 1132 radiomics features were extracted through PyRadiomics and selected by XGBoost and Random Forest which were continued to construct the prognostic model afterwards. The performance of two models was evaluated by accuracy and receiver operating characteristics curve (ROC). The best model—XGBoost was chosen as the higher accuracy and AUC(Figure2).Results
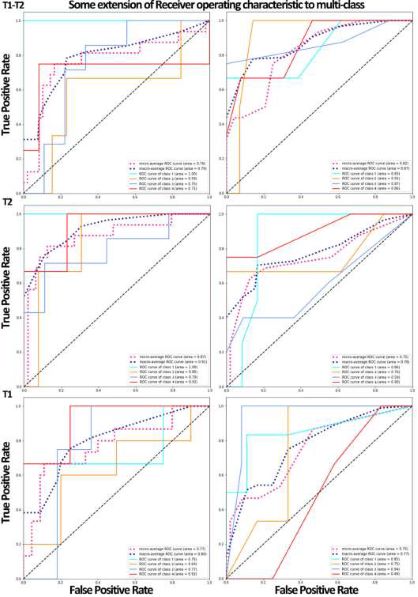
To prevent over-sampling, patients’ number went up to 53 after ADASTN (12, 13, 16, and 12samples in 1 to 4 Gleason group respectively.). Top 17 features in T1-T2, top 14 features in T2 and top 6 features in T1 were selected and inputted into XGBoost and Random Forest. Their accuracywas 0.69, 0.75 and 0.67 in XGBoost and 0.44, 0.62 and 0.47 in Random Forest separately. Besides, their mean AUC was 0.79, 0.91 and 0.80 in XGBoost and 0.87, 0.78 and 0.73 in Random Forest(Figure3).Discussion
We intended to build a model that could make predictions of Gleason group in PCa. SPM in Matlab and 3DSlicer were used to process the raw data into combination image of T1WI and T2WI.ADASYN was applied to balance the dataset so that the over-sampling could be avoided to some extent. A growing number of evidence has suggested that radiomics can provide accurate risk stratification in PCa that may allow for individualized therapy. Fehr D et al. found that combining data-augmented classification together with more of the latent information in standard MRIs had better performance than using apparent diffusion coefficient (ADC) mean or T2 signal intensities alone . XGBoost built up the clinical application value of the MR radiomics-based prediction models for categorizing Gleason group in PCa patients.Acknowledgements
No acknowledgement found.References
1. Epstein JI, Zelefsky MJ, Sjoberg DD, et al. A Contemporary Prostate Cancer Grading System: A Validated Alternative to the Gleason Score. Eur Urol 2016; 69:428-435.
2. Ikonomovska E, Gama J, Džeroski S. Online tree-based ensembles and option trees for regression on evolving data streams. Neurocomputing 2015; 150:458-470.
3. Chen W, Liu B, Peng S, Sun J, Qiao X. Computer-Aided Grading of Gliomas Combining Automatic Segmentation and Radiomics. International Journal of Biomedical Imaging 2018; 2018:11.
4. Jalalian A, Mashohor S, Mahmud R, Karasfi B, Iqbal Saripan M, Ramli AR. Computer-Assisted Diagnosis System for Breast Cancer in Computed Tomography Laser Mammography (CTLM). J Digit Imaging 2017; 30:796-811.
5. Koh JEW, Acharya UR, Hagiwara Y, et al. Diagnosis of retinal health in digital fundus images using continuous wavelet transform (CWT) and entropies. Comput Biol Med 2017; 84:89-97.
Figures