4032
Comparison of Stretched-Exponential, IVIM and Monoexponential Diffusion-Weighted Imaging Mathematical Models for Assessment of Tumor Aggressiveness in Prostate Cancer at 3T1Kawasaki Medical School, Kurashiki City, Japan, 2Philips Electronics Japan, Osaka, Japan
Synopsis
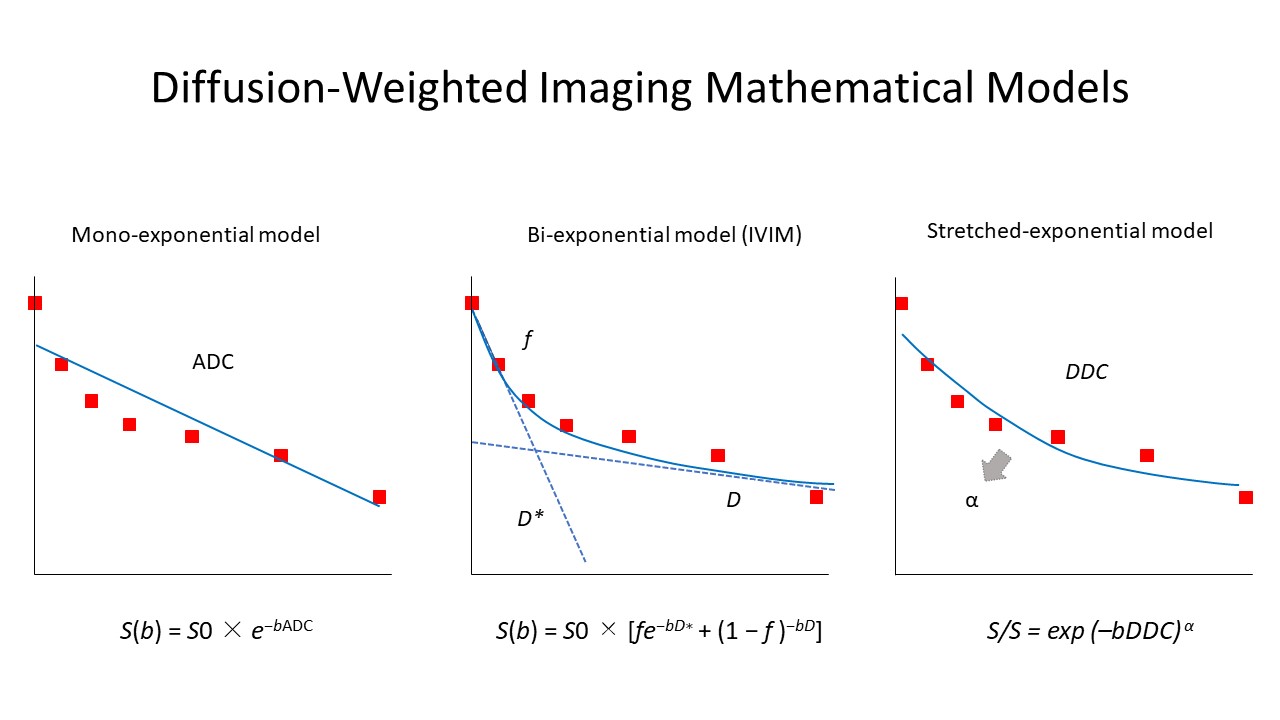
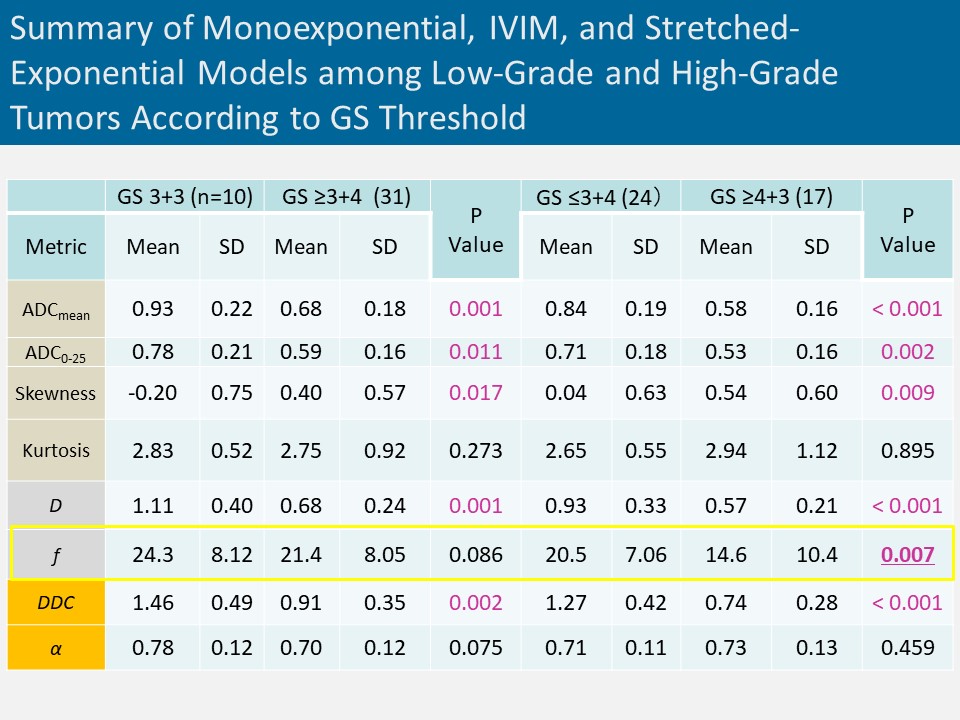
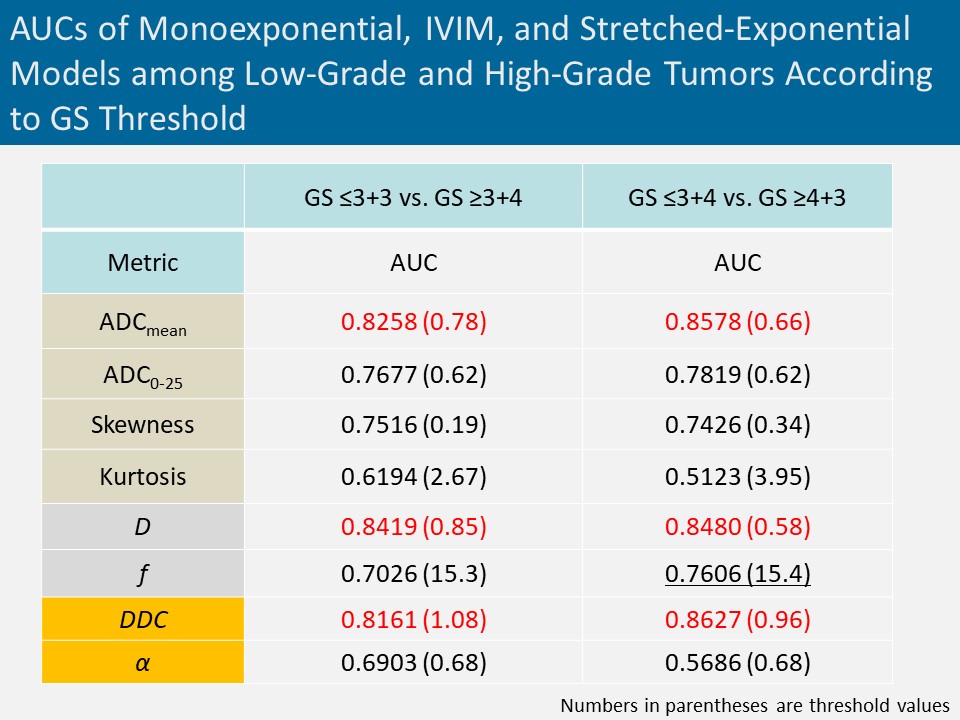
We compared monoexponential and non-Gaussian models including intravoxel incoherent motion imaging (IVIM) and stretched-exponential model in diffusion-weighted imaging (DWI) for characterization of prostate cancer. ADCmean in monoexponential model, D in IVIM, and DDC in stretched model showed high discrimination ability with AUC>0.80 between GS=3+3 and GS≥3+4 tumors as well as GS≤3 + 4 and GS≥4 + 3 tumors, but no significant difference among these metrics. Our study did not show a clear clinical value of non-Gaussian models including IVIM and stretched model compared with standard monoexponential model for assessment of tumor aggressiveness in prostate cancer.
INTRODUCTION
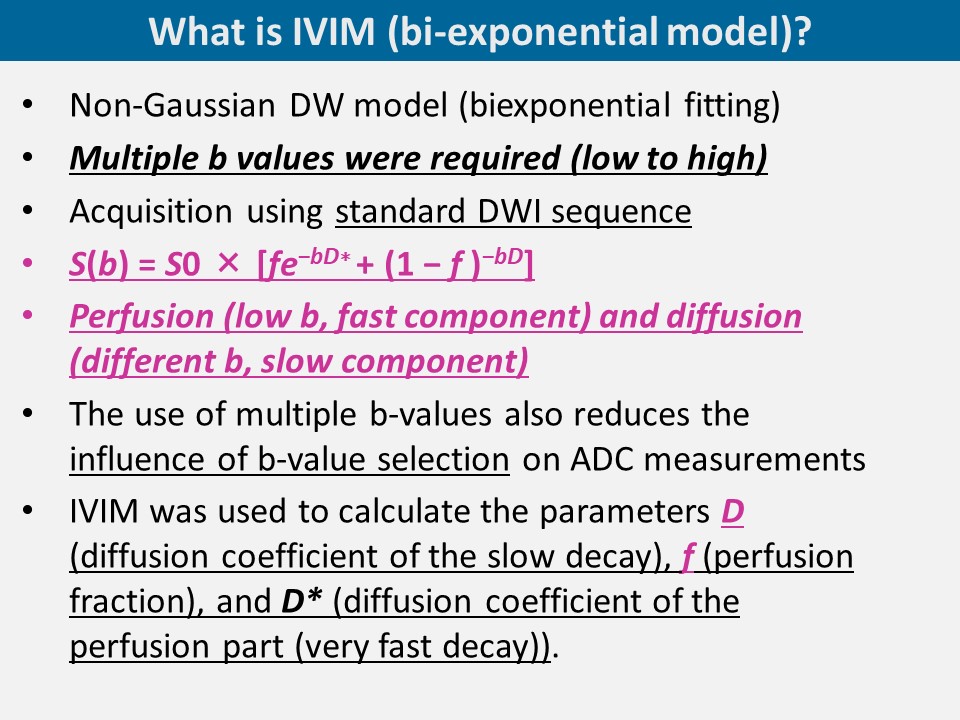
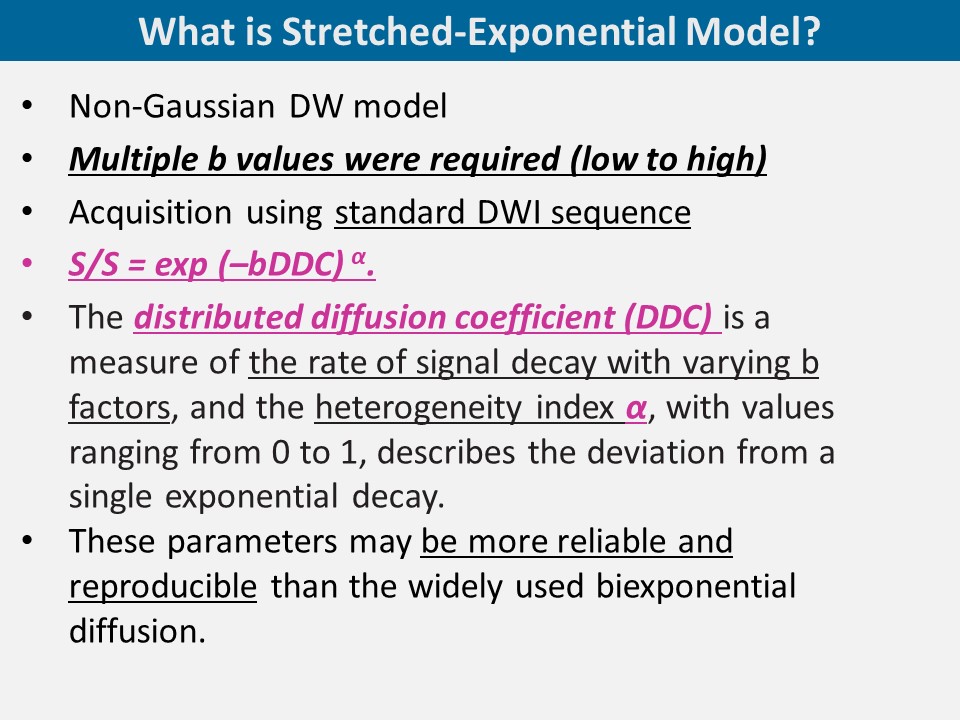
Diffusion-weighted imaging (DWI) which reflects the Brownian movement of water molecules primarily within extracellular space is a key component of prostate multiparametric magnetic resonance imaging (mpMRI) in patients with prostate cancer that contributes to tumor detection as well as assessment of tumor aggressiveness.1-2 In the assessment of tumor aggressiveness, the apparent diffusion coefficient (ADC) calculated using monoexponential model from DWI acquisitions has been shown in previous studies to discriminate between low-risk and moderate to high-risk prostate cancer.3 However, in prostate cancer tissues, water diffusion is obstructed by microstructural complexity, so a more complex non-Gaussian model may more appropriately characterize the diffusion behavior. Thus, the aim of this study to compare monoexponential and non-Gaussian models including intravoxel incoherent motion imaging model (IVIM) and stretched-exponential model for characterization of prostate cancer.
METHODS
A total of 41 prostate cancer patients undergoing 3-T mpMRI including DWI before MRI guided biopsy (MRI-ultrasound fusion-guided biopsy or cognitive biopsy) or radical prostatectomy were included. Axial fat-suppressed single-shot echo-planar DWI was acquired with b values of 0, 30, 50, 100, 200, 500, 1000, and 2000 s/mm2. ADC with histogram analysis (mean, 0-25th percentile, skewness, and kurtosis) and IVIM including D (diffusion coefficient of the slow decay) and f (perfusion fraction), and stretched model including distributed diffusion coefficient (DDC: the rate of signal decay with varying b factors) and α (the deviation from a single exponential decay) were obtained from region of interest (ROIs) placed on each patient’s dominant tumor. A radiologist with 19 years of experience in prostate MRI reviewed the mpMRI in conjunction with the pathologic results to identify a single dominant target lesion per patient for image analysis. Metrics were compared between Gleason score (GS)≤3+3 tumors and GS≥3+4 tumors, and between GS≤3 + 4 tumors and GS≥4 + 3 tumors by using Mann-Whitney U test and receiver operating characteristic (ROC) analysis.RESULTS
In the 41 patients, the dominant tumor was in the peripheral zone in 76% (31 of 41) and in the transition zone in 24% (10 of 41). The distribution of GS was 3+3 in 10 tumors, 3+4 in 14 tumors, 4+3 in 12 tumors, 3+5 in 1 tumor, 4+4 in 1 tumor, and 4+5 in 3 tumors. A tumor with GS=3+5 was classified as GS=4+4 tumor. ADCmean, ADC0-25, D, and DDC were significantly lower and ADCskewness was significantly higher in GS≥3+4 tumors (n = 31) than in GS=3+3 (n = 10) tumors, as well as in GS≥4+3 tumors (n = 17) than in GS≤3+4 tumors (n = 24) (P < 0.001 to P = 0.017). However, there was no significant difference in ADCkurtosis in both comparisons (P = 0.273 and 0.895, respectively). On the other hand, f was significantly lower in GS≥4+3 tumors than in GS≤3+4 tumors (P = 0.007), but no significant difference between GS=3+3 tumors and GS≥3+4 tumors (P = 0.086). In ROC analysis, the AUC of the metrics ranged from 0.619 to 0.842 for separating GS=3+3 tumors from GS≥3+4 tumors, and from 0.512 to 0.863 for separating GS≤3+4 tumors from GS≥4+3 tumors. There was no significant difference in AUC between ADCmean, D, and DDC with AUC>0.80 in both comparisons (P = 0.500 to P = 0.805 and P = 0.688 to P = 0.850, respectively).DISCUSSION
In discrimination between GS=3+3 tumors and GS≥3+4 tumors as well as GS≤3+4 tumors and GS≥4+3 tumors, not only monoexponential model such as ADCmean but also non-Gaussian model such as D and DDC showed high diagnostic performance, but no significant difference among those metrics. On the other hand, interestingly, f which is considered as a perfusion-related diffusion parameter in prostate cancer was associated with the difference between GS≤3+4 tumors and GS≥4+3 tumors (AUC: 0.761), but not between GS=3+3 tumors and GS≥3+4 tumors. Thus, f may be a new predictor for differentiating between low to intermediate-risk tumor and high-risk tumor in PC, which is effective for patient prognosis.4 However, further technical optimization of the acquisition method in DWI will be required for the improvement of diagnostic performance of the non-Gaussian model.CONCLUSION
These results using DWI with b values up to 2000 s/mm2 did not show a clear clinical value of non-Gaussian models including IVIM and stretched model compared with standard monoexponential model for assessment of tumor aggressiveness in prostate cancer.Acknowledgements
No acknowledgement found.References
REFERENCES:
- American College of Radiology. MR Prostate Imaging Reporting and Data System version 2.0. http://www.acr.org/Quality-Safety/Resources/ PIRADS/. Accessed October 29, 2018.
- Le Bihan D. Apparent diffusion coefficient and beyond: what diffusion MR imaging can tell us about tissue structure. Radiology. 2013;268(2):318–322.
- Tamada T, Sone T, Jo Y, et al. Diffusion-weighted MRI and its role in prostate cancer. NMR Biomed. 2014;27(1):25-38.
- Epstein JI, Egevad L, Amin MB, Delahunt B, Srigley JR, Humphrey PA; Grading Committee. The 2014 International Society of Urological Pathology (ISUP) Consensus Conference on Gleason Grading of Prostatic Carcinoma: Definition of Grading Patterns and Proposal for a New Grading System. Am J Surg Pathol. 2016;40(2):244-252.
Figures