4027
MRI Susceptibility Mapping Shows Decreased Venous Oxygen Saturation in Sickle Cell Anaemia1Department of Medical Physics and Biomedical Engineering, University College London, London, United Kingdom, 2Developmental Neurosciences, UCL Great Ormond Street Hospital Institute of Child Health, London, United Kingdom
Synopsis
Ischemic stroke is a common and severe occurrence in Sickle Cell Anaemia (SCA) but no accurate screening measures currently exist for adults. Changes in venous oxygen saturation (Yv) have been suggested as a potential biomarker but measuring Yv in vivo is challenging. This work explores the potential of MRI susceptibility mapping to measure Yv in SCA subjects. Susceptibility-mapping-based measures of Yv were compared between 25 SCA subjects and 15 healthy controls. Significantly lower Yv was measured in the superior sagittal sinus in the SCA group compared to healthy controls, showing that QSM is sensitive to changes in Yv in SCA.
Introduction
Sickle Cell Anaemia (SCA) is an inherited red blood cell (erythrocyte) disorder characterized by haemolytic anaemia, cerebral vasculopathy and a high risk of ischemic stroke and silent cerebral infarction (SCI). Transcranial Doppler examinations and SCI presence are currently used to identify children with increased risk of stroke. However, these screening methods lack specificity and are unsuitable in adults. In SCA, ischemic stroke is most frequent in adults aged between 35 and 651. Therefore, there is a clinical need for more accurate screening measures which can identify stroke risk in adults with SCA.
Brain oxygenation imaging is a potential screening measure to investigate stroke risk in SCA. Compromised oxygen delivery leading to stroke results in reduced venous oxygen saturation levels (Yv)2. Therefore, reduced Yv measures may identify tissue regions at increased risk of infarction and stroke. Measuring Yv in-vivo is challenging and there is not currently a clinically established method3.
The objective of this work is to assess the potential of MRI Susceptibility Mapping (QSM) to measure Yv within SCA subjects. Within venous blood, magnetic susceptibility (χ) values are dependent on oxygen saturation as paramagnetic deoxygenated haemoglobin molecules cause a measurable susceptibility shift (Δχvein-water) relative to surrounding tissue (assuming χtissue ≈ χwater). Yv can be calculated from this shift4:
$$Y_v = 1 - \frac{\triangle \chi_{vein-water} - \triangle \chi_{oxy-water}\cdot Hct }{\triangle \chi_{do}\cdot Hct} \hspace{30mm} [1]$$
where Hct is the percentage of erythrocytes in blood, Δχdo is the susceptibility shift between fully oxygenated and de-oxygenated erythrocytes (0.27x4π ppm [SI]) and Δχoxy-water is the susceptibility shift between oxygenated erythrocytes and water (-0.03x4π ppm [SI]). Previous work suggests there is no significant susceptibility difference between deoxyhaemoglobin in sickle and normal erythrocytes5.
QSM was applied in SCA subjects and healthy controls (HCs) to compare Yv values measured in the Superior Sagittal Sinus (SSS). We hypothesized that Yv would be reduced in the SCA subjects because haemolytic anaemia reduces global blood oxygen content6.
Methods
25 SCA subjects (Mean Age: 16.89±3.74 years) and 15 HCs (16.35±5.85 years) were recruited from the Prevention of Morbidity in Sickle Cell (POMS) and Sleep and Asthma Cohort (SAC) clinical studies7,8.
MRI data were acquired on a 3T Siemens Magnetom Prisma system at Great Ormond Street Hospital, London. Susceptibility maps were calculated from Multi-Echo Gradient-Recalled-Echo (GRE) images. Sequence parameters included: 7 echoes, TE1/ΔTE/TR: 3ms/4ms/38ms, 1.15mm isotropic resolution, FOV: 180x220x166mm3. For the SCA subjects, Hct measures were obtained from blood sampled during the clinical study, and for the HCs, Hct was estimated at 0.49.
QSM Pipeline: B0 field maps were obtained from a non-linear fit of complex multi-echo GRE images10. Field maps were unwrapped using a Laplacian-based method11. Brain masks were segmented using ITK-SNAP12 ensuring that the entirety of the SSS was within the mask. Background fields were removed using projection onto dipole fields13. Field to susceptibility inversion was performed using Tikhonov regularisation14 with regularization parameter α=0.06, selected using L-Curve methods.
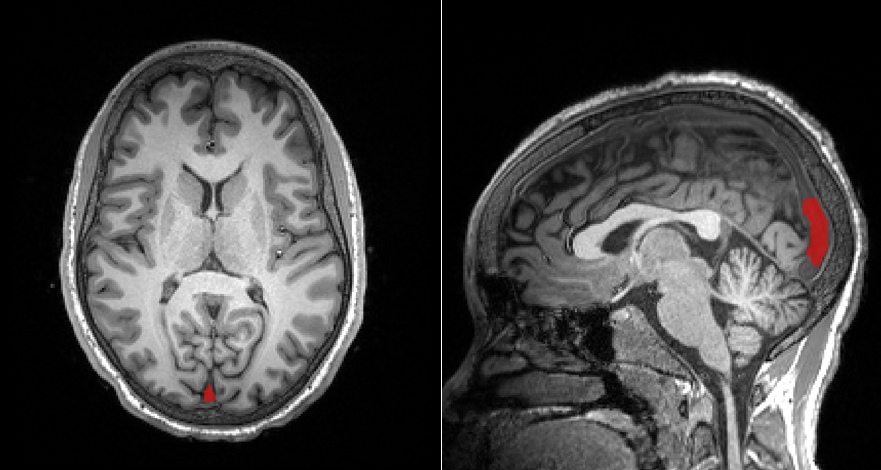
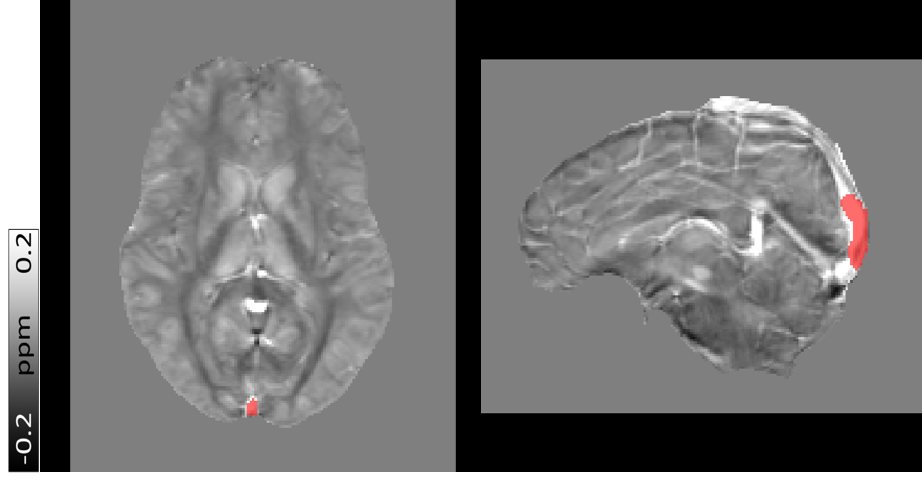
For each subject a single region of interest was segmented in the SSS on T1-weighted images (ROISSS) using a semi-automated approach in ITK-SNAP12 (Figure 1). The T1-weighted images were affinely registered to the fourth echo GRE magnitude images using NiftyReg15, and the corresponding transform was applied to ROISSS (Figure 2). Mean χ values within ROISSS were calculated and used to estimate Yv using Eq.[1].
An independent t-test was used to compare Yv between the SCA and HC groups.
Results and Discussion
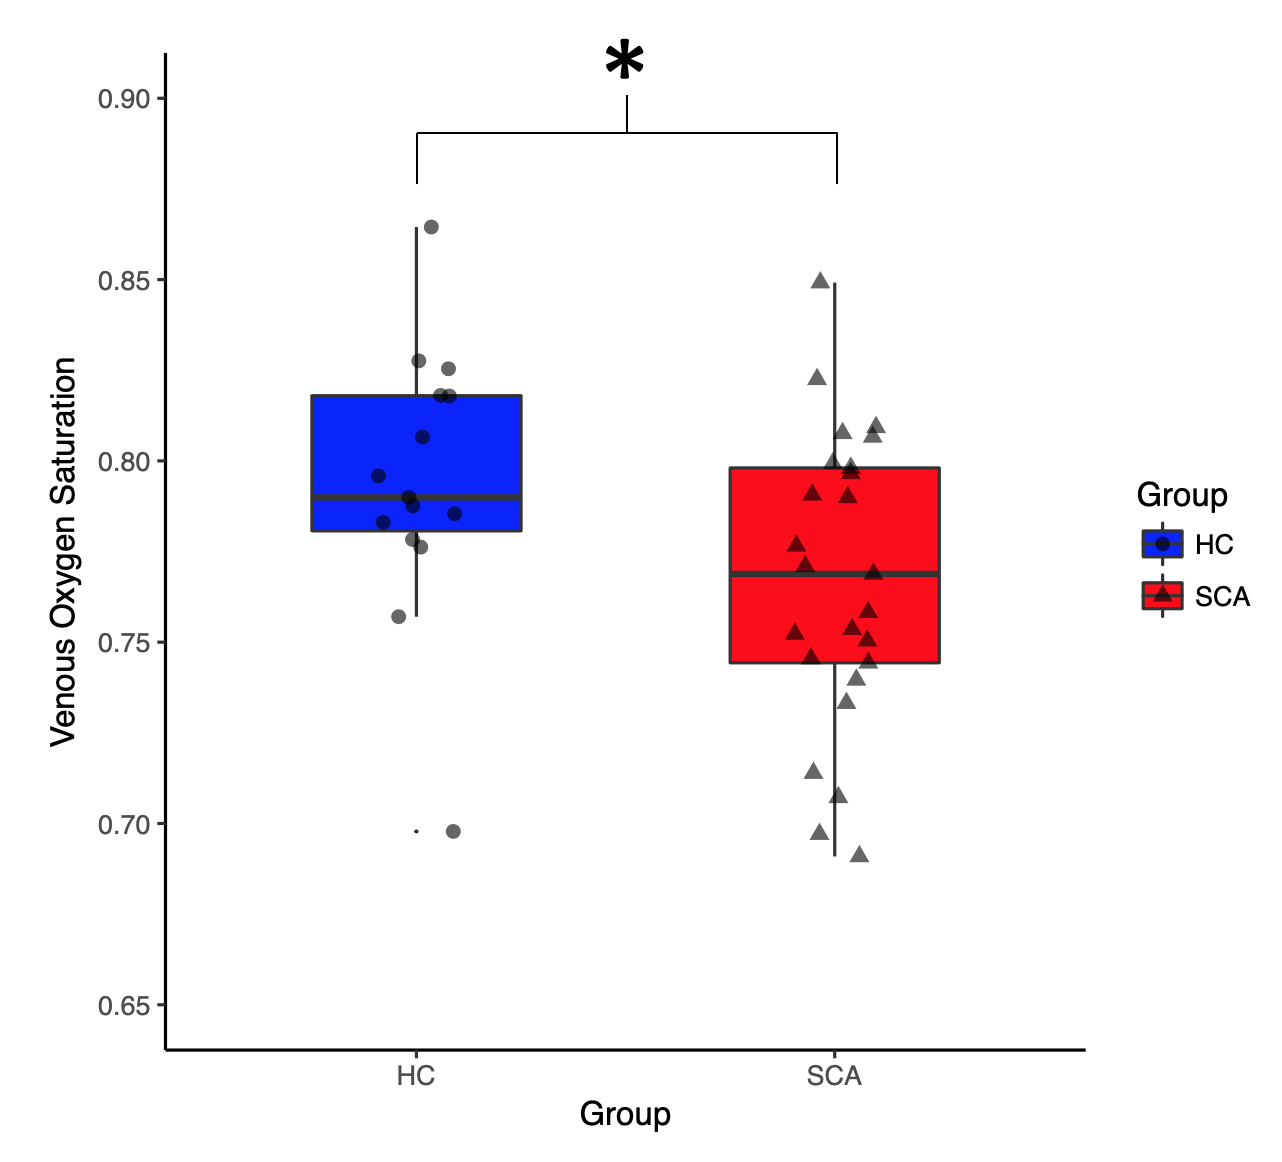
The SCA group had significantly lower SSS Yv values than the HC group [0.769-0.794, p=0.042] (Figure 3). Therefore, susceptibility-based measures of venous oxygenation are sensitive to the decreased oxygenation present in SCA subjects.
The Yv values we measured in both SCA and HC groups are larger than the range of Yv values measured in the SSS of healthy controls using QSM and alternative MRI methods (0.632-0.659)16,17. Larger Yv values may have been caused by inclusion of lower-χ tissue outside the SSS in the ROIs (see Figure 2). Furthermore, the acquisition sequence was not flow compensated which could have led to flow-induced phase errors.
Using automatic vessel segmentation algorithms as well as manual segmentation, future work will examine ROIs beyond the SSS and also close to neurological damage within SCA subjects.
Conclusion
MRI susceptibility mapping measured significantly lower Yv values in the superior sagittal sinus in an SCA group compared to healthy controls. This work demonstrates the potential of MRI susceptibility mapping to measure venous oxygen saturation in-vivo in the brain of SCA subjects. This provides a platform to investigate the potential of QSM-based measures of Yv as a screening measure of stroke risk in SCA.Acknowledgements
This work is supported by the EPSRC-funded UCL Centre for Doctoral Training in Medical Imaging (EP/L016478/1) and the Department of Health’s NIHR-funded Biomedical Research Centre at Great Ormond Street Hospitals.References
1. Strouse JJ, Lanzkron S, Urrutia V. The epidemiology, evaluation and treatment of stroke in adults with sickle cell disease. Expert Rev Hematol. 2011;4(6):597–606.
2. Jordan LC, Gindville MC, Scott AO, Juttukonda MR, Strother MK, Kassim AA, et al. Non-invasive imaging of oxygen extraction fraction in adults with sickle cell anaemia. Brain. 2016;139(3):738–50.
3. Lin W, An H, Ford AD, Vo KL, Lee JM, Zaharchuk G. Imaging of brain oxygenation. Clin Perfus MRI Tech Appl. 2010;75–88.
4. Weisskoff R, Kiihne S. MRI Susceptometry: Image-Based Measurement of Absolute Susceptibility of MR Contrast Agents and Human Blood. Magn Reson Med. 1992;383(24):375–83.
5. Guilliams KP, Fields ME, Ragan DK, Eldeniz C, Binkley MM, Chen Y, et al. Red cell exchange transfusions lower cerebral blood flow and oxygen extraction fraction in pediatric sickle cell anemia. Blood. 2018;131(9):1012–21.
6. Abdu A, Gómez-Márquez J, Aldrich TK. The oxygen affinity of sickle hemoglobin. Respir Physiol Neurobiol. 2008;161(1):92–4.
7. Howard J, Inusa B, Liossi C, Jacob E, Murphy PB, Hart N, et al. Prevention of Morbidity in sickle cell disease - qualitative outcomes, pain and quality of life in a randomised cross-over pilot trial of overnight supplementary oxygen and auto-adjusting continuous positive airways pressure (POMS2a): Study protocol for a. Trials. 2015;16(1).
8. Vanderbilt University School of Medicine Department of Pediatrics. The Sleep and Asthma Cohort (SAC) Study [Internet]. 2011. p. https://pediatrics.mc.vanderbilt.edu/interior.php? Available from: https://pediatrics.mc.vanderbilt.edu/interior.php?
9. Hall JE. Red Blood Cells, Anemia and Polycythemia. In: Guyton and Hall Textbook of Medical Physiology. 2016. p. 445–543.
10. Liu T, Wisnieff C, Lou M, Chen W, Spincemaille P, Wang Y. Nonlinear formulation of the magnetic field to source relationship for robust quantitative susceptibility mapping. Magn Reson Med. 2013;69(2):467–76.
11. Schweser F, Deistung A, Sommer K, Reichenbach JR. Toward online reconstruction of quantitative susceptibility maps: Superfast dipole inversion. Magn Reson Med. 2013;69(6):1582–94.
12. Yushkevich PA, Piven J, Hazlett HC, Smith RG, Ho S, Gee JC, et al. User-guided 3D active contour segmentation of anatomical structures: Significantly improved efficiency and reliability. Neuroimage. 2006;31(3):1116–28.
13. Liu T, Khalidov I, de Rochefort L, Spincemaille P, Liu J, Tsiouris AJ, et al. A novel background field removal method for MRI using projection onto dipole fields (PDF). NMR Biomed. 2011;24(9):1129–36.
14. Kressler B, De Rochefort L, Liu T, Spincemaille P, Jiang Q, Wang Y. Nonlinear regularization for per voxel estimation of magnetic susceptibility distributions from MRI field maps. IEEE Trans Med Imaging. 2010;29(2):273–81.
15. Modat M, Ridgway GR, Taylor ZA, Lehmann M, Barnes J, Hawkes DJ, et al. Fast free-form deformation using graphics processing units. Comput Methods Programs Biomed. 2010;98(3):278–84.
16. Fan AP, Bilgic B, Gagnon L, Witzel T, Bhat H, Rosen BR, et al. Quantitative oxygenation venography from MRI phase. Magn Reson Med. 2014;72(1):149–59.
17. Barhoum S, Rodgers Z, Langham M, Magland J, Li C, Wehrli F. Comparison of MRI Methods for Measuring Whole-Brain Venous Oxygen Saturation. Magn Reson Med. 2015;73(6):2122–8.
Figures