4025
Analysis of different phase unwrapping methods to optimize QSM in the abdomen1Department of Diagnostic and Interventional Radiology, Medical Faculty, Heinrich Heine University, Düsseldorf, Germany, 2Institute of Clinical Neuroscience and Medical Psychology, Medical Faculty, Heinrich Heine University, Düsseldorf, Germany
Synopsis
We evaluated six different phase unwrapping algorithms for their use in QSM in the abdomen. Therefor a numerical phantom of the abdomen was simulated using a forward model. The resulting unwrapped phases and susceptibility maps were compared with the ground truth and root mean squared error maps were calculated. Results suggest that the “graph-cuts” algorithms should be used for phase unwrapping in the abdomen, as it was the most robust around the lungs and bones and further showed the smallest difference to the ground truth susceptibility.
Purpose
Quantitative Susceptibility Mapping (QSM) is a novel MRI technique that calculates the underlying local tissue susceptibility from its effect on the static main magnetic field. It is commonly used to study iron deposit in different neurodegenerative diseases of the human brain1,2. Phase unwrapping is a mathematical operations that heavily impacts the accuracy of QSM. Until now different phase unwrapping algorithms were evaluated only in brain studies3,4. This work aims to analyze the performance of six different unwrapping algorithms in a numerical simulation of the abdomen, where strong changes in susceptibility and low signal to noise ratio (SNR) occur.Methods
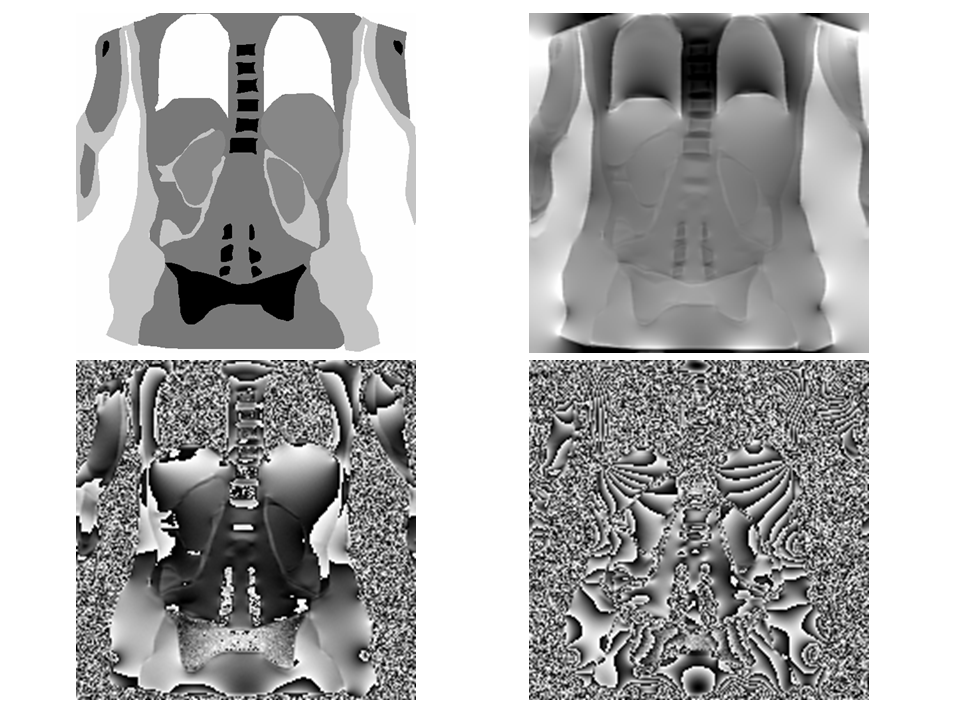
Six commonly used unwrapping algorithms were tested. We selected three Laplacian-based algorithms: One of them is part of the STI-Suite5, the second is the preconditioned conjugate gradient (PCG) method6 and the third algorithm is a locally implemented version of the algorithm described by Schofield et al.7. In addition a region-growing technique and a graph-cuts method were used. Both algorithms are part of the morphology enabled dipole inversion (MEDI) QSM toolbox8. The last tested algorithm is a quality-guided unwrapping as described by Fortier et al.3. To evaluate the above mentioned unwrapping methods, a numerical abdomen phantom was created. For this purpose an abdominal volunteer data set (2D T2-weighted singleshot-TSE, 3T, 0.8 x 0.8 x 4mm3, TE=92ms, TR=1s) was acquired and segmented into different structures inside the abdomen. The susceptibility of water was used as reference and set to 0 ppm. Therefore bones, fat and air were set to -2.5, 1.2 and 9.4 ppm respectively. The susceptibility value of the liver changes heavily with iron concentration and was set to 0.23 ppm, which corresponds to a healthy individual9. Since no further organs or structures in the abdomen have been investigated yet, we decided to set the kidney susceptibility to 0.23 ppm as well. The remaining tissue was set to a susceptibility of 0.001 ppm which was used for brain tissue in former studies3. Ground-truth phase maps were then calculated from this susceptibility distribution at 6 echo times (3T, TE = 4.92, 9.84, 14.76, 19.68, 24.60 and 29.52 ms) by using a forward model10. Afterwards Gaussian noise was added to the complex k-space data before the final magnitude and wrapped phases were calculated. A second series of data was simulated with a constant TE but different noise levels (3T, TE = 4.92 ms, SNR = 5, 10, 15, 20, 30, 40, 60, 80, 100). Figure 1 shows the resulting numerical phantom. Both, the ground-truth and the unwrapped phases, were then further processed using the STI-Suite to remove the background field and to calculate susceptibility maps. Each simulation at different noise levels and echo times was repeated 50 times. To evaluate the performance of the algorithms, the Root Mean Squared Error (RMSE) of the voxel-wise difference between the unwrapped phases and the ground truth was calculated. The same procedure was conducted for the susceptibility maps. To test the statistical differences between the six algorithms the Wilcoxon signed-rank test was used (after denying normal-distribution with the Kolmogorov-Smirnov test). Differences were considered significant for p < 0.05.Results and Discussion
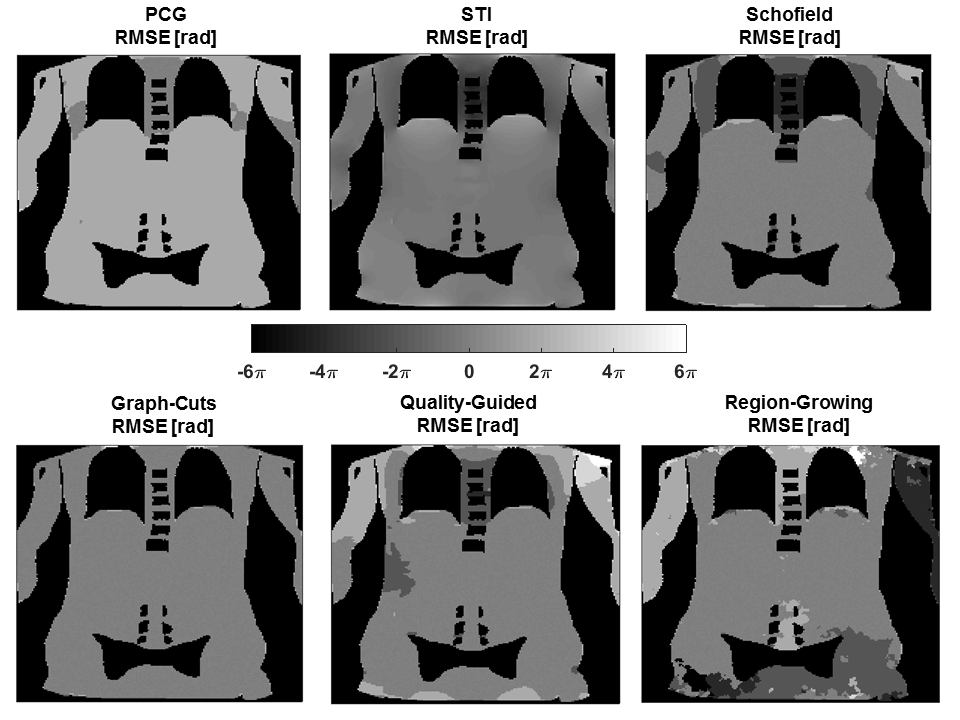
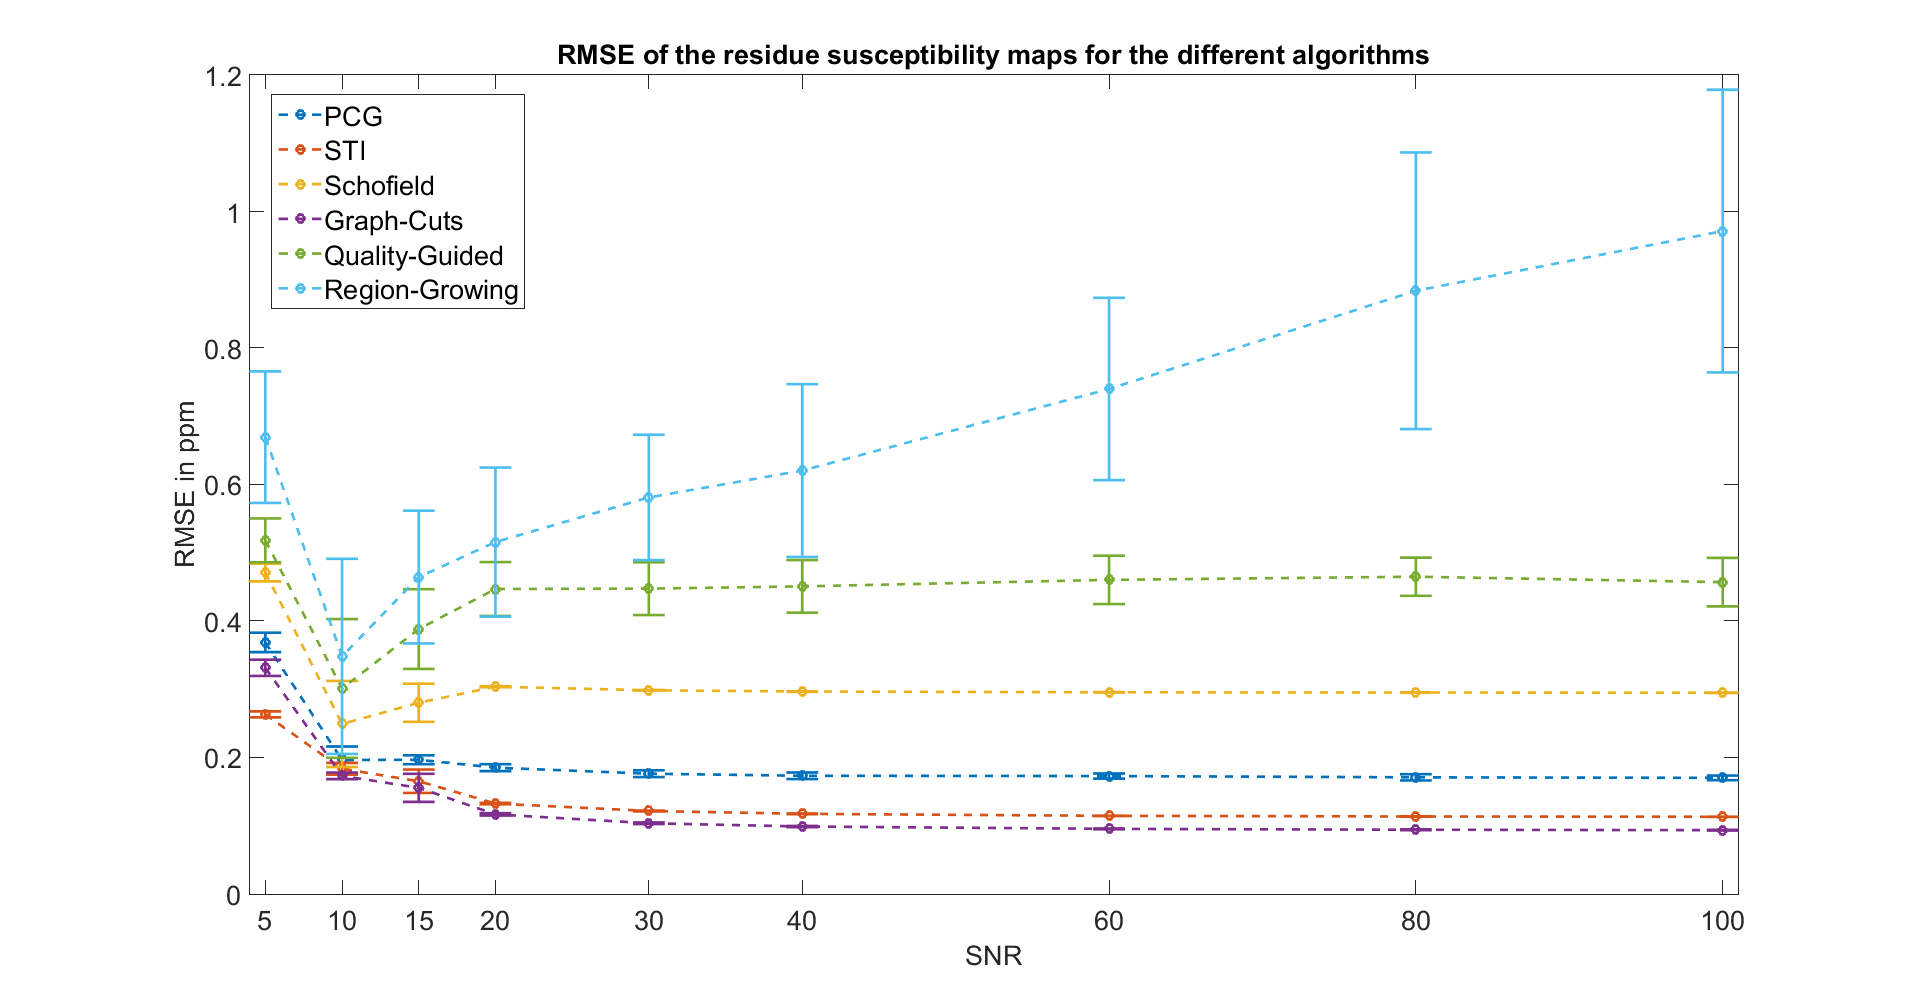
Figure 2 depicts the RMSE maps for the six algorithms at SNR 100. While Graph-cuts and the STI-Suite exhibit a homogenous error map, the other algorithms have severe problems to correctly unwrap areas with strong susceptibility changes around the lungs. Region-growing further shows deviations in the neighborhood of low SNR structures such as bones. Figure 3 displays the RMSE of the susceptibility maps for the different SNRs. Up to a SNR of 20 all six of the algorithms show varying RMSE amounts. A higher SNR leads to stable RMSE and small standard deviations for all the algorithms, except the region-growing algorithm which shows an increase in both. Graph-cuts demonstrates the most promising results i.e. the lowest RMSE. This is conclusive with the literature, where graph-cuts has successfully been used for QSM in the liver9. The statistical analysis revealed that the difference between the six algorithms presented in figure 3 is highly significant (p < 0.001). The only exception to this is at SNR 10, where no difference between the STI-Suite and the PCG algorithm was found.Conclusion
We
evaluated six different phase unwrapping algorithms for the use of QSM in the
abdomen. The results suggest that graph-cuts should be used for QSM in the
abdomen, as it was the most robust algorithm around the lungs and bones.
Furthermore the resulting susceptibility maps exhibited the smallest difference
to the ground truth.Acknowledgements
We would like to thank Dr. Chunlei Liu and Dr. Hongjiang Wei (EECS, UC Berkeley) for their continuous support with the STI-Suite.References
1. Zivadinov, R. et al. Brain Iron at Quantitative MRI Is Associated with Disability in Multiple Sclerosis. Radiology 180136 (2018). doi:10.1148/radiol.2018180136
2. Li, D. T. H. et al. Quantitative susceptibility mapping as an indicator of subcortical and limbic iron abnormality in Parkinson’s disease with dementia. NeuroImage Clin. 20, 365–373 (2018).
3. Fortier, V. & Levesque, I. R. Phase processing for quantitative susceptibility mapping of regions with large susceptibility and lack of signal. Magn. Reson. Med. 79, 3103–3113 (2018).
4. Robinson, S. D. et al. An illustrated comparison of processing methods for MR phase imaging and QSM: combining array coil signals and phase unwrapping. NMR Biomed. 30, e3601 (2017).
5. Li, W., Avram, A. V, Wu, B., Xiao, X. & Liu, C. Integrated Laplacian-based phase unwrapping and background phase removal for quantitative susceptibility mapping. NMR Biomed. 27, 219–27 (2014).
6. Ghiglia, D. C. & Pritt, M. D. Two-dimensional phase unwrapping : theory, algorithms, and software. (Wiley, 1998).
7. Schofield, M. A. & Zhu, Y. Fast phase unwrapping algorithm for interferometric applications. Opt. Lett. 28, 1194 (2003).
8. Liu, J. et al. Morphology enabled dipole inversion for quantitative susceptibility mapping using structural consistency between the magnitude image and the susceptibility map. Neuroimage 59, 2560–2568 (2012).
9. Dong, J. et al. Simultaneous Phase Unwrapping and Removal of Chemical Shift (SPURS) Using Graph Cuts: Application in Quantitative Susceptibility Mapping. IEEE Trans. Med. Imaging 34, 531–540 (2015).
10. Haacke, E. M. et al. Quantitative susceptibility mapping: current status and future directions. Magn. Reson. Imaging 33, 1–25 (2015).
Figures