4024
CEST MRI with dual-echo readout for the functional assessment of transplanted kidney in vivo: a preliminary study1Department of Diagnostic and Interventional Radiology, Heinrich Heine University Düsseldorf, Düsseldorf, Germany, 2Department of Nephrology, Heinrich Heine University Düsseldorf, Düsseldorf, Germany, 3Institute of Clinical Neuroscience and Medical Psychology, Heinrich Heine University Düsseldorf, Düsseldorf, Germany
Synopsis
In this study we present the first application of dual-echo CEST MRI technique in renal transplant recipients. Our goal was to optimize the CEST-MRI acquisition and analysis for kidney graft imaging at 3T, which remains technically challenging and volatile due to large B0 inhomogeneity and presence of fat. Strong lipid signals upfield from the water resonance may lead to erroneous CEST contrast. In this preliminary work we demonstrate that the combination of dual-echo CEST with Dixon provides effective fat signal removal, allowing for more accurate quantification of the CEST effects in the transplanted kidney.
Introduction
Kidney transplantation is the treatment of choice for most patients with end stage renal disease (ESRD)1. A comprehensive assessment of the allograft renal function and management of post-transplant complications are crucial for graft survival. Numerous techniques, including measurement of biochemical markers, allograft biopsies and imaging modalities, are used clinically for monitoring changes in renal function2.
Chemical exchange saturation transfer (CEST) imaging is a novel MRI contrast method that has been reported being useful for detecting low-concentration endogenous metabolites such as urea3 and creatine4 as well as for in vivo pH mapping5. A recent study in a rat model showed that the glucose-weighted CEST imaging (glucoCEST) may be a valuable tool for the assessment and follow up treatment of acute cellular renal allograft rejection (AR)6.
Here we investigate the feasibility of performing CEST imaging of the human kidney transplant in vivo on a clinical 3T MRI system. The primary focus was to optimize the CEST MRI acquisition for renal imaging, which remains technically challenging because of the presence of bulk fat in and around the kidney, large B0 inhomogeneity and physiological motion7. We obtained the effective fat separation using the modified bipolar two-point Dixon method (b-2pt Dixon)8. Respiratory motion artifacts have been reported to be negligible in renal allograft recipients, since the kidney graft is usually placed in the iliac fossa9.
Methods
The study was approved by the local ethics committee and the written informed consent was obtained from all participants. All the experiments were performed on a 3T MAGNETOM Prisma MRI system (Siemens Healthcare, Erlangen, Germany) using an 18-channel torso array coil. Seven renal transplant recipients were examined with a multi-echo CEST sequence. The pulsed CEST saturation module consisted of 15 Gaussian-shaped RF pulses with a single pulse duration tpd = 100 ms, an interpulse duration tipd = 100 ms and B1 = 1.2 µT, followed by a dual-echo gradient echo imaging. Images were acquired at 41 frequency offsets (from -6 ppm to 6 ppm) and corrected employing a water shift referencing (WASSR) map10. The imaging parameters were: transversal FOV = 380 x 380 mm2, voxel size = 1 x 1 mm2, slice thickness = 5 mm, TR/TE1/TE2 = 4.2/1.5/2.5 ms, number of averages = 2. The b-2pt Dixon technique was used to generate the water-only and fat-only images for each frequency offset8.Results and Discussion
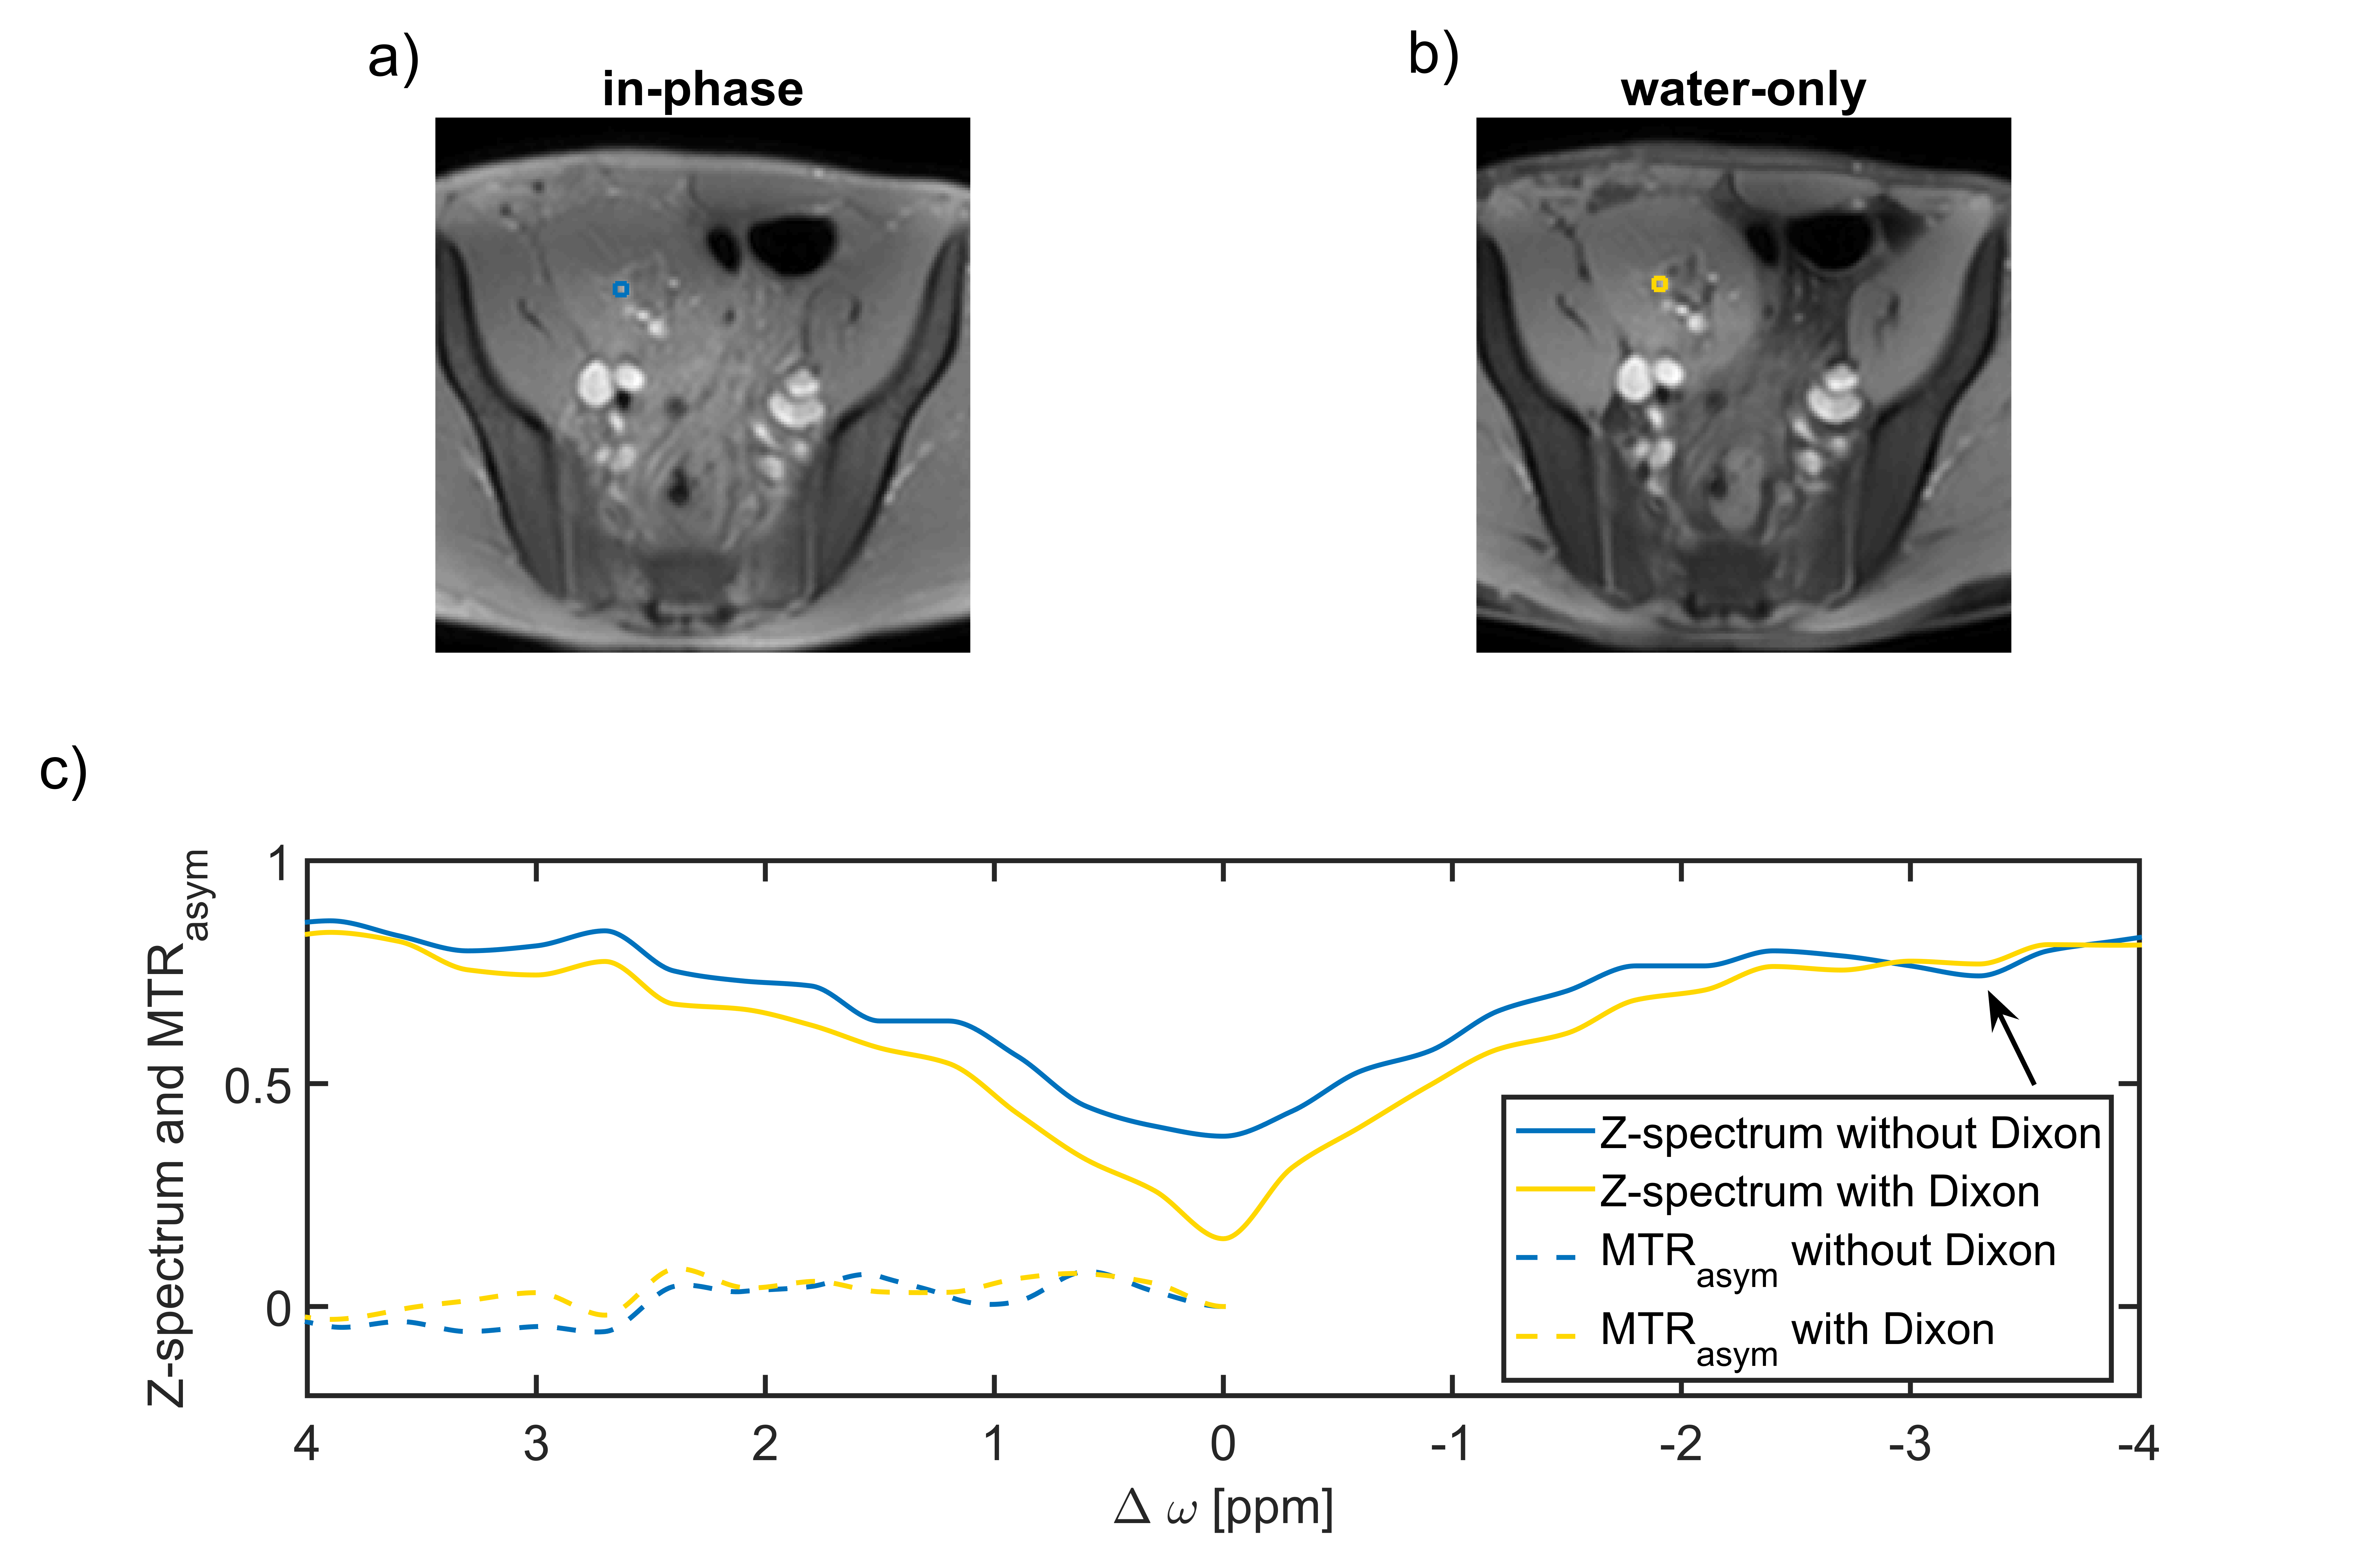
Figure 1 displays the Z-spectra and MTRasym curves obtained for a single pixel denoted as a square marker on the reference non-Dixon (using the second echo) and Dixon image. In the water-only Z-spectrum, the signal from lipids at -3.5 ppm is effectively suppressed, producing positive MTRasym values at the amide frequencies. Moreover, the CEST-Dixon method leads to a smoother Z-spectrum and higher suppression level around the water resonance. This is consistent with previous results in7,11.
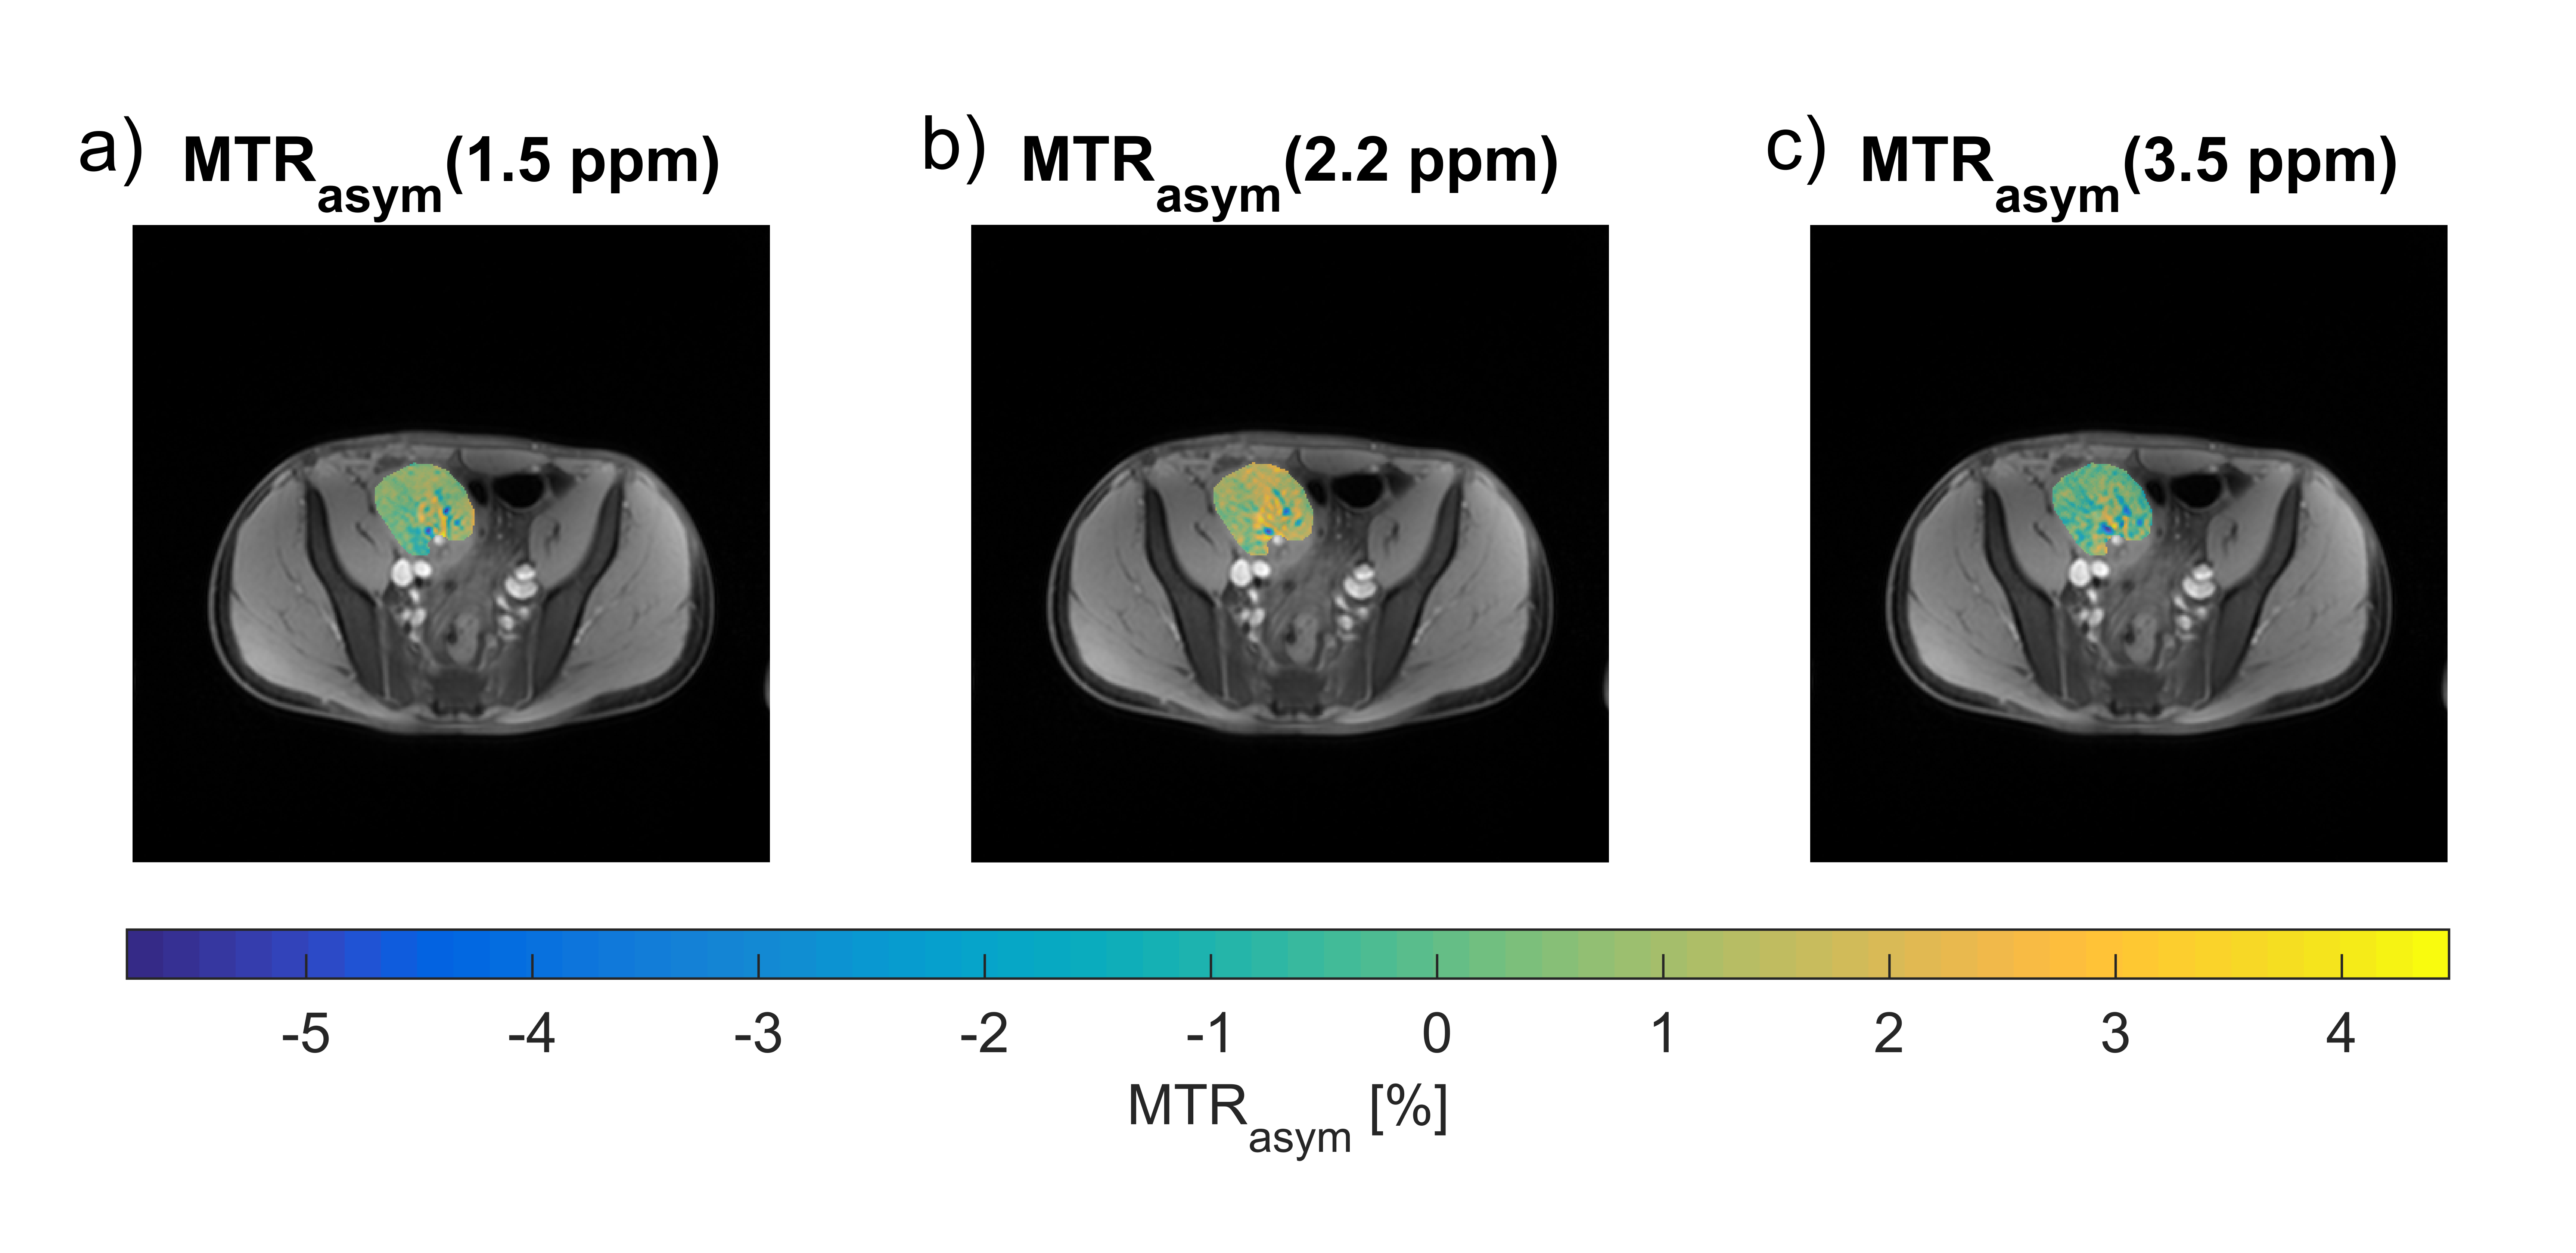
Figure 2 shows the color-coded magnetic transfer ratio asymmetry maps (MTRasym) at different frequency offsets: 1.5 ppm, 2.2 ppm and 3.5 ppm overlaid on the reference water-only image. Previous studies have identified urea as a major contributor to the kidney/urine chemical exchange at about 1.5 ppm3,12,13. The CEST effect at ca. 2.2 ppm downfield of the water signal may be assigned to the amino protons14, whereas the CEST peak at 3.5 corresponds possibly to the amide signals in proteins and peptides14. Nevertheless, further investigations are required in order to get a better understanding of the competing magnetization transfer (MT) effects in kidney.
Conclusion
We have demonstrated the successful implementation of the dual-echo CEST imaging in kidney transplant on a clinical 3T MRI system. By applying a modified b-2pt Dixon method, we were able to separate water and fat and thus to supress the lipid artifact. The next step is to further optimize the 2-pt Dixon technique in order to estimate reliable B0 maps for each frequency offset. A larger patient population is needed to evaluate the feasibility of CEST MRI at 3T in the functional assessment of renal allografts.Acknowledgements
The authors thank Erika Rädisch for her assistance in gathering the MRI scans.
The study was supported by a grant from the Forschungskomission of the Faculty of Medicine, Heinrich-Heine-University, Düsseldorf (Grant No. 13/2015).
References
1. Abecassis M, Bartlett ST, Collins AJ, et al. Kidney Transplantation as Primary Therapy for End-Stage Renal Disease: A National Kidney Foundation/Kidney Disease Outcomes Quality Initiative (NKF/KDOQI™) Conference. Clin J Am Soc Nephrol. 2008 Mar; 3(2): 471–480.
2. Wang YT, Li YC, Yin LL, et al. Functional assessment of transplanted kidneys with magnetic resonance imaging. World J Radiol. 2015 Oct 28; 7(10): 343–349.
3. Guivel-Sharen V, Sinnwell T, Wolff SD, et al. Detection of proton chemical exchange between metabolites and water in biological tissues. J Magn Reson. 1998; 133,36-45.
4. Haris M, Nanga RP, Singh A, et al. Exchange rates of creatine kinase metabolites: feasibility of imaging creatine by chemical exchange saturation transfer MRI. NMR Biomed. 2012 Nov;25(11):1305-9.
5. Wu Y, Zhou IY, Igarashi T, et al. A generalized ratiometric chemical exchange saturation transfer (CEST) MRI approach for mapping renal pH using iopamidol. Magn Reson Med. 2018 Mar;79(3):1553-1558.
6. Kentrup D, Bovenkamp P, Busch A, et al. GlucoCEST magnetic resonance imaging in vivo may be diagnostic of acute renal allograft rejection. Kidney Int. 2017 Sep;92(3):757-764.
7. Zhang S, Li B, Greer J, et al. Toward CEST MRI of renal masses: protocol optimization and first preliminary data. Joint Annual Meeting ISMRM-ESMRMB, Paris, France, 2018.
8. Liu J, Peters DC, Drangova M. Method of B0 mapping with magnitude‐based correction for bipolar two‐point Dixon cardiac MRI. Magn Reson Med. 2016;78(5).
9. Ren T, Wen CL, Chen LH, et al. Evaluation of renal allografts function early after transplantation using intravoxel incoherent motion and arterial spin labeling MRI. Magn Reson Imaging. 2016 Sep;34(7):908-14.
10. Kim M1, Gillen J, Landman BA, et al. Water saturation shift referencing (WASSR) for chemical exchange saturation transfer (CEST) experiments. Magn Reson Med. 2009 Jun;61(6):1441-50.
11. Zhang S, Seiler S, Wang X, et al. CEST-Dixon for human breast lesion characterization at 3 T: A preliminary study. Magn Reson Med. 2018 Sep;80(3):895-903.
12. Dagher AP, Aletras A, Choyke P, et al. Imaging of urea using chemical exchange-dependent saturation transfer at 1.5 T. J Magn Reson. 2000; 12:745-748.
13. Vinogradov E, Liu Z, Madhuranthakam AJ, et al. Endogenous urea CEST (urCEST) for MRI monitoring of kidney function. ISMRM, 23th Annual Meeting and Exhibition, Toronto, Canada, 2015.
14. Wang F, Kopylov D, Zu Z, et al. Mapping murine diabetic kidney disease using chemical exchange saturation transfer MRI. Magn Reson Med. 2016 Nov;76(5):1531-1541.
Figures