4022
Thermal measurement in fatty tissues with Z-Spectrum ImagingAlessandro M Scotti1,2, Li Li3, Fred Damen1, Weiguo Li2,4, Victoria Gil5, Wenzhen Zhu3, Chong Wee Liew5, and Kejia Cai1,2
1Radiology, University of Illinois at Chicago, Chicago, IL, United States, 2Bioengineering, University of Illinois at Chicago, Chicago, IL, United States, 3Radiology, Tongji Medical College, Wuhan, China, 4Research Resources Center, University of Illinois at Chicago, Chicago, IL, United States, 5Biophysics and Biophysiology, University of Illinois at Chicago, Chicago, IL, United States
Synopsis
Z-spectrum imaging (ZSI) has been recently introduced as a method to quantify fat-water fraction based on the direct saturation of both water and fat. Here we demonstrate that ZSI can also assess temperature in fatty tissues, by measuring the relative fat-water chemical shift (FWCS) change due to the shift of water resonance at increased temperature. The protocol was tested on a whipped cream phantom and showed FWCS changing linearly with temperature. The protocol was also tested on healthy mice and subjects, paving the way for the study of fat metabolism, in particular of brown adipose tissue.
Introduction
Temperature mapping is a fundamental need in biological research and noninvasive methods to reliably assess the variation in temperature due to pathology progression or treatment are highly required. In the MRI realm, the most widely used technique for temperature measurement is Proton Resonance Frequency (PRF), which relies on the change of water chemical shift triggered by a temperature-dependent modulation of the hydrogen’s electronic shielding1. The measurement is often performed by tracking the change in the MR phase with respect to a reference temperature state. However, fat protons don’t undergo the same change in chemical shift and the computation is therefore complicated in fatty tissues2. Z-spectrum imaging (ZSI) has been recently introduced as a method to quantify fat-water fraction (FWF) in brown adipose tissue, an organ with a mixed composition of lipid and water and with the capability of generating heat through cold-induced nonshivering thermogenesis3,4. Here we demonstrate that ZSI can also measure temperature in fatty tissues.Methods
As a proof of principle, experiments were first carried out on a phantom containing heavy whipped cream having 36% fat content. Temperature in the phantom was increased from 18 to 36 °C by regulating the warm air flow into the scanner bore. MRI was carried out at an Agilent Varian 9.4T preclinical scanner and included a CEST sequence used to acquire Z-Spectra with a 500 ms long square saturation pulse with amplitude 0.5 μT. Frequency offsets ranged dynamically from -5 to 5 ppm. The saturation pulses were followed by a single-slice fast spin echo (FSE) readout. The reproducibility of the ZSI procedure was also tested in vivo on healthy male mice. Finally, the protocol was also tested on healthy subjects at a clinical 3T scanner. All Z-Spectral data were fitted to a multi-Lorentzian model including the direct saturation of water, of fat and the semi-solid MT component. Fat spectral profile was described by 6 peaks and used as internal reference for removing B0-related shifts5. Curves amplitudes, widths and chemical shifts were loosely constrained in order to take into account inhomogeneous fat content and thermal shifting of the water resonance. FWF and Fat-Water Chemical Shift (FWCS) maps were computed from the peaks of water and methylene-fat.Results
Figure 1 shows the Z-spectra at different temperatures from a region of interest in the phantom. When the temperature rises, the water peak is evidently shifted upfield, while the methylene peak can be used as reference. The chemical shift detected from the cream phantom showed a homogeneous distribution throughout the phantom, independent from B0 inhomogeneity (Fig.2a). The correlation between chemical shifts and temperature changes were assessed by a linear regression (R2=0.99), with corresponding coefficient α = 0.01 (Fig.2b). The test-retest analysis in 5 ROIs on the mice study showed a coefficient of variation CV < 5%. Exemplary FWF and chemical shift maps from a mouse and a subject are shown in Fig.3.Conclusion
Z-spectrum imaging can measure chemical shift and therefore temperature, exploiting the fat signal as an internal reference. Given its effectiveness in measuring also FWF, it can be an ideal technique for the study of fat metabolism, in particular the study of brown adipose tissue.Acknowledgements
No acknowledgement found.References
1Quesson, JMRI, 2000; 2Soher, MRM, 2010; 3Scotti, JMRI, 2018; 4Liu, NMR Biomed, 2014; 5Kijowski, JMRI, 2009.Figures
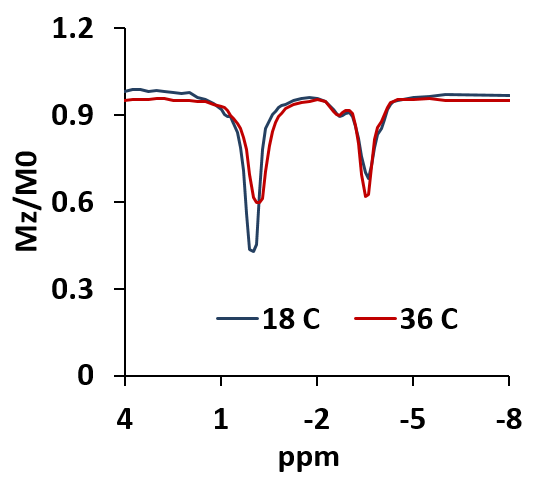
Z-spectra from cream phantom at low and high temperature show clearly
the shift in the water peak.
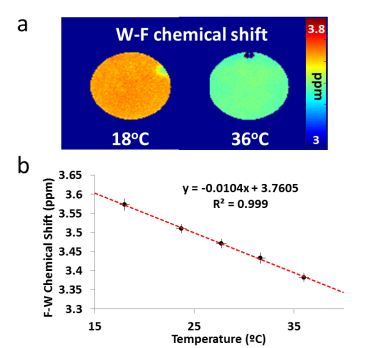
Fat-water chemical shift decrease linearly with temperature in a whipped
cream phantom.
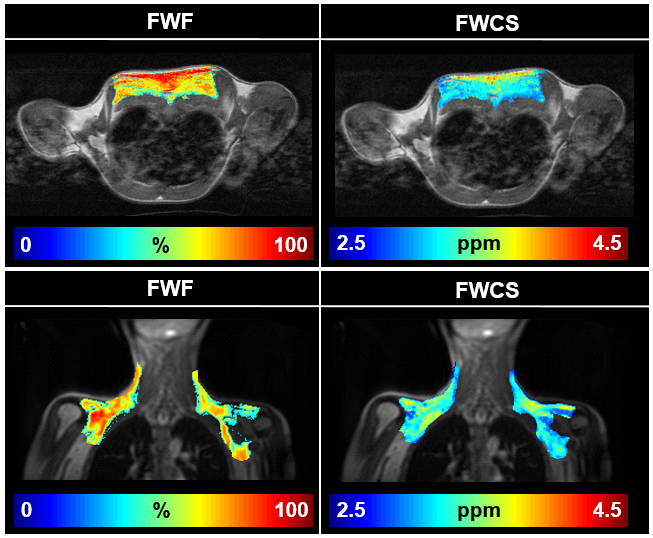
Fat-water fraction and chemical
shift maps from interscapular and intraclavicular depots of brown adipose
tissue in mice and men.