4021
An Automated Approach for the Optimised Estimation of Breast Density with Dixon Methods1CRUK Cancer Imaging Centre, The Institute of Cancer Research and Royal Marsden Foundation Trust, London, United Kingdom, Sutton, United Kingdom, 2The Royal Marsden NHS Foundation Trust, Sutton, United Kingdom, 3St George's University Hospitals NHS Foundation Trust, London, United Kingdom
Synopsis
In Breast MRI, Dixon fat-water separation techniques have been invaluable for the measurement of breast-density in studies of breast cancer risk. A fundamental source of error in Dixon methods arises from differences in the signal intensity from water and fat, associated with differences in proton density and relaxation times. We propose an automated method to introduce a scaling factor that minimizes these errors. We demonstrate our method in a group of 14 subjects, imaged at 3T with different levels of T1-weighting.
Introduction
High breast-density has been shown to be a risk factor for the development of breast cancer. The breast-density, defined as % breast-volume occupied by parenchyma1, can be measured with great accuracy in three-dimensional MRI datasets, and was shown to correlate with breast-density measured in X-Ray Mammography2-4.
A Dixon-based approach that produces “water” and “fat” images can account for partial volume effects in low resolution images by obtaining a water fraction ($$$\%W$$$) for every voxel5. For breast-density measurements relying on water-fraction estimates, the fact that voxels containing either 100% water or 100% fat do not yield the same signal intensity is a fundamental problem6,7. Because Dixon images can be generated with different contrast characteristics, and because the proton density and relaxation times may vary over the breast parenchyma, any scaling of the water signals must be undertaken on a patient-by-patient basis.
Here, we propose and implement an automated method designed to determine a scaling factor to compensate for the difference between water and fat signal in Dixon breast MRI.
Data Acquisition
14 patients underwent MRI with 2-point Dixon techniques at 3T (mDixon, Achieva, Philips Healthcare, Best, Netherlands). Water and fat images were acquired for two levels of T1-weigthing with a 16-channel breast coil and the following parameters: flip angles (FA) 16°/4°, TR 3.60ms, 2NEX, 2mm slices, acquisition matrix 172x172 reconstruction matrix 432x432, PI-acceleration 2.Methods
Breast Segmentation: Simple segmentation was performed in OsiriX (OsiriX Foundation, Geneva) using a single plane to separate each breast from the chest wall. These volumes were reproduced for all images in MATLAB (Mathworks, MA) using a binary mask constructed from the sum of the high-FA fat and high-FA scaled-water volumes.
Data Correction: To account for the fact water and fat voxels yield different signal intensities, water images were multiplied by a scaling factor (SF). Considering that breast is occupied by either water (parenchyma/skin) or fat, the sum of fat and SF-corrected water (F+SFW) must produce an image with few image-intensity variations. The calculation of SF thus aims to identify a value that yields a relatively featureless F+SFW image.
Calculating SF: Software was written in MATLAB to perform the following steps, where SFs are iteratively tested from 1.0 to 6.0. 1) Multiply water image volume by SF. 2) Sum water and fat image volumes and smooth resulting volume. 3) Multiply smoothed volume by the previous mask that is eroded in an attempt to remove voxels near the tissue-air boundary. 4) Calculate the map of the absolute value of the image-intensity spatial gradient as $$$|G|=\sqrt{G_x^2+G_y^2+G_z^2}$$$. 5) Choose the SF which yields the lowest 95th-percentile voxel-value of the gradient magnitude histogram.
Calculating Breast-Density: Water image volumes were multiplied by their respective SF. Maps of $$$\%W$$$ (with and without SFs) were calculated voxelwise as $$\%W=100\times{I_W/(I_W+I_F)}$$ where $$$I_W$$$/$$$I_F$$$ are intensity of water/fat images. Finally, breast-density was calculated as the mean $$$\%W$$$ within the masked volume.
Results and Discussion
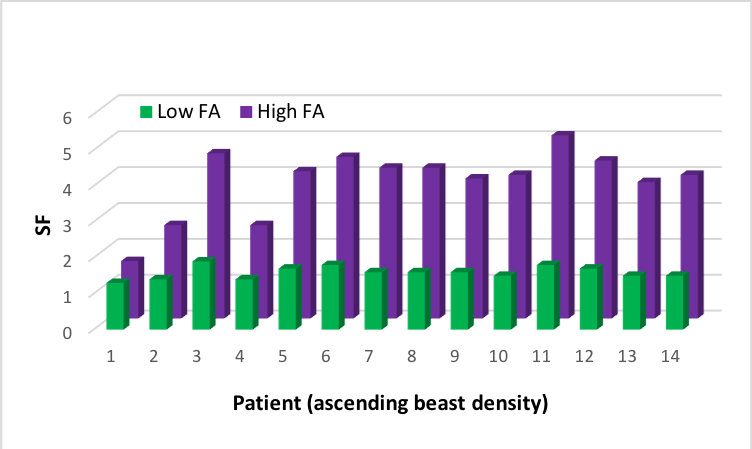
Figure 1 illustrates how SF-correction affects a $$$\%W$$$ map. Figure 2 shows the range of SFs calculated for the low- and high-FA data (1.6±0.1, 3.8±0.7, mean±absdev, respectively). As expected, there is less variability of SF for the low-FA data due to the almost complete absence of T1-weighting. Figure 3 demonstrates the steepness of the breast-density change with SFs from 1.0 to 6.0. The error associated with the precision in the determination of the SF is <~5%. Figure 4 shows the breast-density values calculated with and without SFs. For the majority of the patients, the change in breast-density % is >5% (2.5-8.3%, 3.6-25.7% absolute increases for low and high-FA data, respectively). Figure 5 shows the breast-density values calculated with high- and low-FA data. Breast-density values are closer after SF correction with the method we propose, but do not coincide. It is expected that the effects of T1-weighting cannot be completely removed from the high-FA data. In the absence of a true gold-standard, we expect the low-FA data to be more reliable, as it is less affected by T1-weighting8.
Calculation of SFs for Dixon breast imaging has been employed previously6,7, where a region-of-interest based approach was used to estimate the ratio between the intensity of “pure” parenchyma and “pure” fat. Our approach is expected to hold two main advantages over these methods. First, automation removes errors that may occur due to intra- and inter-user variation. Second, our approach does not require that such pure regions in fat and water images are present.
Conclusion and Future Work
Our method is a feasible approach for improving the accuracy of breast-density measurements with Dixon methods. Future work will aim to improve segmentation using an algorithm to isolate breast tissue, and we will further investigate the accuracy of our new methodology in clinical trials.Acknowledgements
CRUK and EPSRC support to the Cancer Imaging Centre at ICR and RMH in association with MRC & Dept of Health C1060/A10334, C1060/A16464 and NHS funding to the NIHR Biomedical Research Centre and the Clinical Research Facility in Imaging. This report is independent research funded partially by the National Institute for Health Research. The views expressed in this publication are those of the author(s) and not necessarily those of the NHS, the National Institute for Health Research or the Department of Health. MOL is an NIHR Emeritus Senior Investigator.References
1.
Thompson DJ, Leach MO, Kwan-Lim G, Gayther SA,
Ramus SJ, Warsi I, et al. Assessing the useful- ness of a novel MRI-based
breast density estimation algorithm in a cohort of women at high genetic risk
of breast cancer: the UK MARIBS study. Breast Cancer Res. 2009; 11: R80. doi:
10.1186/bcr2447.
2. Wang J, Azziz A, Fan B, Malkov S, Klifa C, Newitt D, et al. Agreement of mammographic measures of volumetric breast density to MRI. PLOS ONE. 2013; 8: e81653. doi: 10.1371/journal.pone.0081653.
3. McCormack VA, dos Santos Silva I. Breast density and parenchymal patterns as markers of breast cancer risk: A meta-analysis. Cancer Epidemiol Biomarkers Prev. 2006; 15: 1159–1169.
4. Gubern-Merida A, Kallenberg M, Platel B, Mann RM, Mart R, Karssemeijer N. Volumetric breast density estimation from full-field digital mammograms: a validation study. PLoS One. 2014; 43: 2870–2876.
5. Boyd N, Martin L, Chavez S, Gunasekara A, Salleh A, Melnichouk O, et al. Breast-tissue composition and other risk factors for breast cancer in young women: a cross-sectional study. Lancet Oncol. 2009; 10: 569–580.
6. Ledger AE, Scurr ED, Hughes J, Macdonald A, Wallace T, Thomas K, et al. Comparison of Dixon Sequences for Estimation of Percent Breast Fibroglandular Tissue. PLoS One. 2016;11(3):e0152152. doi: 10.1371/journal.pone.0152152.
7. Doran SJ, Hipwell JH, Denholm R, Eiben B, Busana M, Hawkes DJ, et al. Breast MRI segmentation for density estimation: Do different methods give the same results and how much do differences matter? Med Phys. 2017; 44(9): 4573–4592.
8. Liu CY, McKenzie CA, Yu H, Brittain JH, Reeder SB. Fat Quantification with IDEAL Gradient Echo Imaging: Correction of Bias from T1 and Noise. Magnetic Resonance in Medicine 2007; 58: 354–364.
Figures