4020
Validation of a tool for body fat and skeletal muscle quantification using MRI and application in the assessment of body composition in patients with colorectal and lung cancer1Centre for Medical Imaging, University College London, London, United Kingdom
Synopsis
Body composition analysis holds considerable promise in clinical prognostication. For example, sarcopenia (particularly sarcopenic obesity) is associated with poor outcomes in cancer patients. To date, most clinical studies using body composition analysis have used data derived from volumetric CT; however, whole-body MRI (WB-MRI) is increasingly used in cancer staging and analysis of these MRI data could be an alternative means to calculate body composition. In this study, we describe and validate a simple, practical tool for quantification of body fat and skeletal muscle from WB-MRI and demonstrate its application to two cohorts of patients with lung and colon cancer.
Introduction
Body composition, particularly the proportion of fat and lean tissue, is a powerful clinical prognosticator in a range of neoplastic and inflammatory diseases. For example, sarcopenia (loss of skeletal muscle mass) in cancer patients is associated with increased treatment toxicity, delayed recovery following surgery and decreased survival1,2, and this effect is more severe when sarcopenia coexists with obesity. Changes in body composition are also of interest in a range of inflammatory conditions such as Crohn’s disease, where sarcopenia predicts poor response to biological drug therapy. Identification of high-risk patients might enable optimisation of nutritional status prior to and during treatment, with the potential to improve clinical outcomes.
Computed tomography (CT) has been considered the standard for body composition analysis in clinical practice; however, whole-body MRI is increasingly used in cancer staging and analysis of these MRI data could represent an alternative method of assessing body composition.
There is currently no freely-available simple method for body fat and skeletal muscle quantification using MRI. We have developed a tool which is quick, accurate and simple to use. Here, we have validated the tool by comparing measurements of subcutaneous adipose tissue (SAT), visceral adipose tissue (VAT) and skeletal muscle (SM) in patients using CT and MRI, and demonstrated application of the tool to assessment of body composition in patients with colorectal and lung cancer.
Methods
81 patients with colorectal (n=51) or lung cancer (n=30) were prospectively recruited as part of an ongoing study investigating the use of MRI in cancer staging. Subjects underwent a research fat-water MRI on a 3T Philips Ingenia System (figure 2a) at the time of diagnosis. All patients also underwent a CT scan as part of routine clinical care.
Images were post-processed using an in-house tool for segmenting adipose tissue and muscle (figure 1). Using paired fat-only and water-only images as input data, the tool assigns pixels to one of three clusters (air, fat, soft tissue) using k-means clustering (implemented in MATLAB). User defined boundaries were used to separate subcutaneous and visceral adipose tissue, and calculate areas of SAT, VAT and SM. Processing time was approximately 3 minutes per slice.
We compared the cross-sectional areas of SAT, VAT and SM at L3 using CT and MRI in a subset of 10 patients who had CT and MRI within a period of 8 days. For CT, tissues were segmented using the following Hounsfield Unit (HU) thresholds: -29 to +150 (SM), -190 to -30 (SAT) and -150 to -50 (VAT)3. Bland-Altman limits of agreement were used to compare the two methods.
We subsequently measured cross-sectional areas of SAT, VAT and SM at L3 in all 81 patients based on their MRI scan. Total body fat mass (FM) and fat-free mass (FFM) were calculated using regression equations described previously3 and adjusted for height to give FM and FFM indices. Sarcopenia was defined based on a previous study: L3 SM index (L3 SM mass normalised for stature) ≤38.5cm2/m2 for women and ≤52.4cm2/m2 for men2.
Comparisons of FM and FFM between the colorectal and lung cancer groups were made using the unpaired t-test. The association between cancer type and sarcopenia was assessed using the chi-squared test.
Results and discussion
There was no significant difference in age or sex between the two cancer cohorts (figure 2b).
Bland-Altman plots comparing the measured areas of SAT, VAT and skeletal muscle at L3 are shown in figures 3d-f. There was good agreement between the two methods.
FM and FFM indices were significantly higher in patients with colorectal cancer compared with lung cancer at diagnosis (p = 0.035 and p = 0.006 respectively). Patients with colorectal cancer were less likely to be sarcopenic than patients with lung cancer (p = 0.04).
Conclusions
We present a simple tool for body fat and skeletal muscle quantification using fat-water MRI which is quick to use, requires minimal technical expertise and demonstrates good agreement with CT measurements. The potential applications are wide and include assessment and follow-up of body composition (and nutritional status) in patients with cancer and other long-term health conditions.
FM and FFM indices were significantly higher in patients with colorectal cancer than lung cancer. In addition, patients with lung cancer were more likely to be sarcopenic. This may reflect differences in the pathogenesis of the two diseases and suggests that patients with lung cancer are more likely to require additional nutritional support. Further analysis of follow-up imaging will enable investigation of change in body composition over time and correlation with clinical outcome.
Acknowledgements
NS, ST and MHC receive funding from the UCL/UCLH BRC. This work was undertaken at UCLH/UCL, which receives funding from the UK Department of Health’s the National Institute for Health Research (NIHR) Biomedical Research Centre (BRC) funding scheme. The views expressed in this publication are those of the authors and not necessarily those of the UK Department of Health.References
1. Lieffers JR, Bathe OF, Fassbender K, Winget M, Baracos VE. Sarcopenia is associated with postoperative infection and delayed recovery from colorectal cancer resection surgery. Br J Cancer. 2012;107:931–6.
2. Prado CM, Lieffers JR, McCargar LJ, Reiman T, Sawyer MB, Martin L, et al. Prevalence and clinical implications of sarcopenic obesity in patients with solid tumours of the respiratory and gastrointestinal tracts: a population-based study. Lancet Oncol. 2008;9:629–35.
3. Mourtzakis M, Prado CMM, Lieffers JR, Reiman T, McCargar LJ, Baracos VE. A practical and precise approach to quantification of body composition in cancer patients using computed tomography images acquired during routine care. Appl Physiol Nutr Metab. 2008;33:997–1006.
Figures
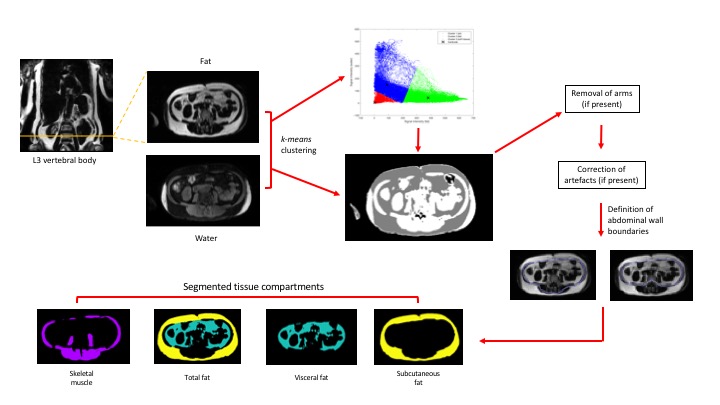
Image processing flowchart using the tool.
The user inputs paired fat and water images into the tool. Pixels are assigned to one of 3 clusters (air, fat, soft tissue) based on their signal intensities (using the MATLAB ‘k-means’ function). User defined boundaries of the abdominal wall are used to calculate areas of SAT, VAT and SM.
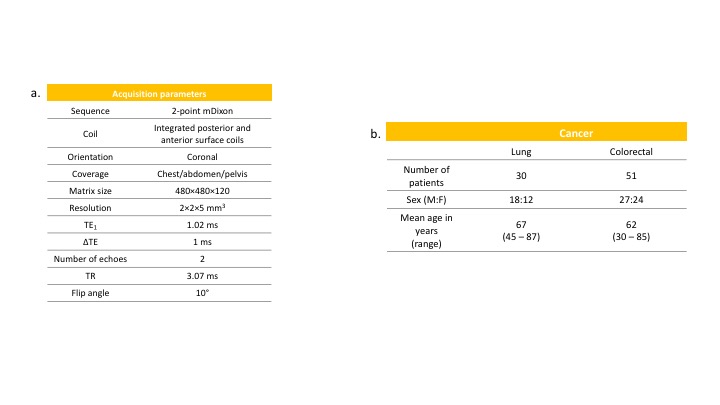
a. MRI acquisition parameters
b. Demographics of subjects
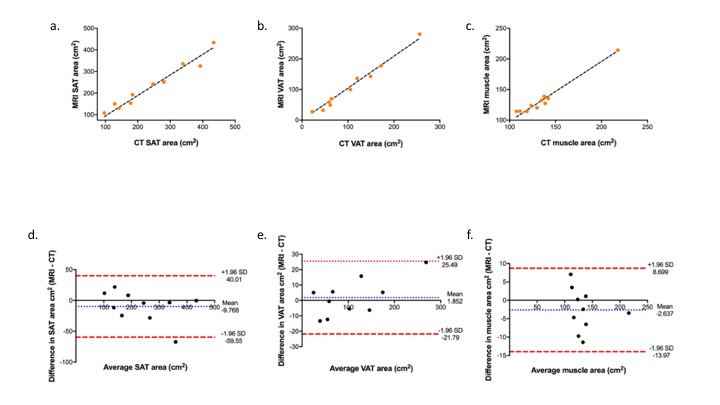
Scatterplots and Bland-Altman plots for CT and MRI measurements at the L3 vertebral body in 10 patients.
a. Scatterplot of SAT area measured using MRI vs. CT, with linear regression line
b. Scatterplot of VAT area measured using MRI vs. CT, with linear regression line
c. Scatterplot of SM area measured using MRI vs. CT, with linear regression line
d. Bland-Altman plot of mean difference in SAT area measured using MRI compared with CT
e. Bland-Altman plot of mean difference in VAT area measured using MRI compared with CT
f. Bland-Altman plot of mean difference in SM area measured using MRI compared with CT
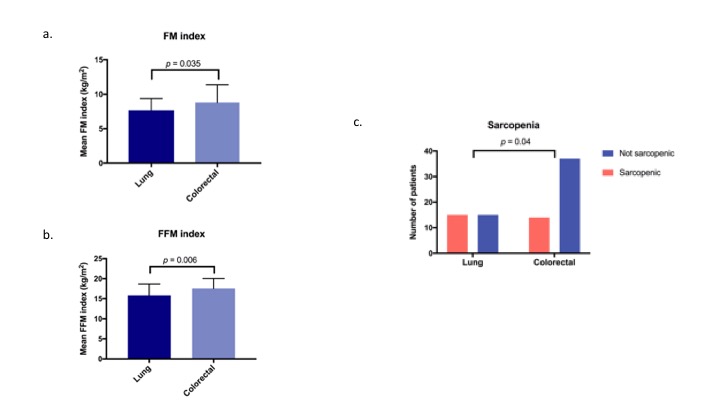
Use of the tool in comparisons between body composition in patients with lung and colorectal cancer.
a. FM index (kg/m2) in subjects with colorectal and lung cancer
b. FFM index (kg/m2) in subjects with colorectal and lung cancer
c. Bar chart showing number of colorectal cancer and lung cancer subjects with sarcopenia