4018
Characterization of B1 calibration curves with respect to durations for myo-Inositol CEST ( MICEST) in the healthy human brain at 7.0T1Radiology, University of Pennsylvania, Philadelphia, PA, United States
Synopsis
myo-Inositol (MI) is one of the important brain metabolites. In the recent years, MICEST technique has emerged as a neuroimaging biomarker and its application was shown in an Alzhemer’s mouse model. In this study, we tried to explore and evaluate the behavior of MICEST at different saturation parameters in healthy human volunteers at 7.0T with an aim to understand and set optimal saturation parameters for the human studies.
Introduction
myo-Inositol (MI) is one of the human brain metabolites found in a large amount in the glial cells region (1). The glial cells proliferation and change in the concentration of MI serves as a bio-marker to detect many brain disorders like Alzheimer’s disease (AD) and brain tumors (2-4). Using chemical exchange saturation transfer (CEST) mechanism, MI OH-protons were exploited (5) and its application was shown in vivo in Alzheimer's mouse model at 9.4T (6). With the prevalence of ultra high field 7.0T MRI scanners, it has potential translation for in vivo clinical studies. Therefore, in this study, the behavior of MICEST to different saturation parameters has been evaluated in healthy human volunteers at 7.0T and the results are presented.Methods
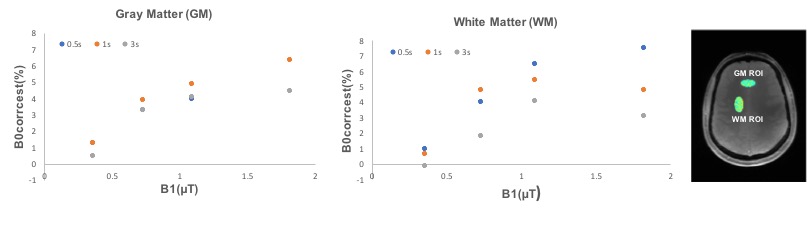
A healthy male volunteer aged ~ 38 years old was scanned in multiple sessions on different days at 7.0T using 32 channel head coil to collect data for different peak amplitudes and saturation durations. To get exactly the same slice position between different scanning sessions imscribe software (7) was used. MICEST was performed using Siemens turbo flash sequence using a saturation preparation segment followed by a turbo flash read out (8) on an axial slab superior to corpus callosum with the following parameters: number of slices = 12, slice thickness = 2mm, in-plane resolution = 1x1mm2, matrix size = 240x180, GRE readout TR/TE = 3.5/1.79ms, averages = 1, shot TR = 6000ms, dummy shots = 2, shots per slice = 3, PAT mode = GRAPPA, Acceleration factor PE = 2, Reference lines PE = 24, RF pulse type = Normal, Gradient mode = Fast, Excitation = Slab-selective, Turbo factor = 550, Bandwidth = 690 Hz/Px, Elliptical scanning = on, Reordering = combined slice and phase encode spiral, and a saturation pulse of B1rms = 0.36, 0.73, 1.09 and 1.82μT and with duration of 0.5, 1, and 3 seconds. CEST images were acquired at varying saturation offset frequencies from ±0 to ±5ppm (relative to the water resonance set to 0ppm) with a step-size of 0.2ppm. To compute B0 maps for correction of B0 field inhomogeneity, water saturation shift referencing (WASSR) images (9) were collected from ±0 to ±1.5ppm (step-size 0.15ppm) with a saturation pulse of B1rms = 0.29μT with 200ms duration and imaging parameters identical to those used for CEST as described above. For gray matter (GM), white matter (WM), and cerebrospinal fluid segmentation, MP2RAGE Siemens product sequence was used with the same spatial parameters as CEST. A relative B1 map was generated from three images obtained using square preparation pulses with flip-angles of 20°, 40° and 80°. The total acquisition time for the CEST images, and B0 and B1 field maps were ~60 min for each imaging session. Three imaging sessions were used to create the data presented here. B1 calibration curves for MICEST were generated using 2 ROIs drawn (1 in GM and 1 in WM) from slices 2 and 3. All post processing was done using in-house MATLAB codes as described previously (5). M0 normalization was used for MICEST contrast generation.Results & Discussion
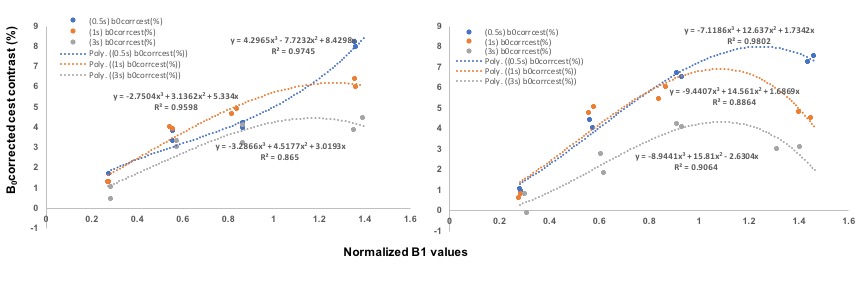
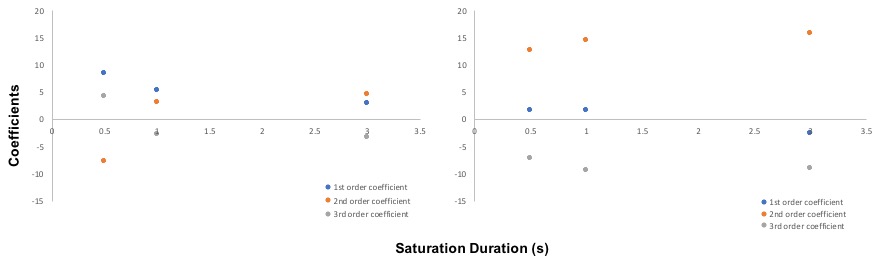
Calculated MICEST values for GM and WM ROIs from one slice are shown in Figure 1. The CEST contrast values obtained for GM and WM seem to be highest for 0.5s duration ( 6.4% and 7.5%) with saturation B1rms of 1.82μT used in this study. This is different from the previous MICEST study where a saturation duration of 5s and saturation B1rms of 1.09μT was used to provide MICEST contrast values of 4.4% for GM and 5.2% for WM. The B1 calibration curves (Figure 2) show that a third order polynomial function fits the observed CEST contrast very well for all durations. The saturation duration dependence of the B1 calibration coefficients for GM and WM as shown in Figure 3 suggests that WM coefficient sensitivity to duration is less in comparison to GM. While these preliminary results helps in characterizing the B1 calibration curves with respect to saturation durations used for MICEST, additional data from more volunteers needs to be studied.Conclusions
This preliminary study provides guidance for setting optimum saturation parameters to be used for MICEST in human studies.Acknowledgements
This project was supported by the National Institute of Biomedical Imaging and Bioengineering of the National Institute of Health under award number P41EB015893.References
1. Brand A, Richter-Landsberg C, Leibfritz D. Multinuclear NMR studies on the energy metabolism of glial and neuronal cells. Dev. Neurosci. 1993, 15:289–298.
2. Miller BL, Moats RA, Shonk T, et al. Alzheimer disease: depiction of increased cerebral myo-inositol with proton MR spectroscopy. Radiology 1993, 187:433–437.
3. Kinoshita Y, Yokota A. Absolute concentrations of metabolites in human brain tumors using in vitro proton magnetic resonance spectroscopy. NMR Biomed. 1997, 10:2–12.
4. Castillo M, Smith JK, Kwock L. Correlation of myo-inositol levels and grading of cerebral astrocytomas. Am. J. Neuroradiol. 2000, 21:1645–1649.
5. Haris M, Cai K, Singh A, et al. In vivo mapping of brain myo-inositol. Neuroimage 2011, 54:2079-85.
6. Haris M, Singh A, Cai K, et al. MICEST: a potential tool for non-invasive detection of molecular changes in Alzheimer's disease. J Neurosci Methods 2013, 212:87-93.
7. Wolf DH, Satterhwaite TD, Loughead J, et al. Amygdala abnormalities in first-degree relatives of individuals with schizophrenia unmasked by benzodiazepine challenge. Psychopharmacology 2011, 218:503-512.
8. Krishnamoorthy G, Nanga RPR, Bagga P, et al. High quality three-dimensional gagCEST imaging of in vivo human knee cartilage at 7 Tesla. Magn Reson Med. 2017, 77:1866-1873.
9. Kim M, Gillen J, Landman B.A, et al. Water saturation shift referencing (WASSR) for chemical exchange saturation transfer (CEST) experiments. Magn Reson Med. 2009, 61:1441-1450.
Figures