4015
Detecting the presence of fat using PLANET-based parameter mapping1Center for Image Sciences, Imaging Division, UMC Utrecht, Utrecht, Netherlands, 2Department of Radiotherapy, Imaging Devision, UMC Utrecht, Utrecht, Netherlands
Synopsis
The PLANET method was introduced to simultaneously map T1, T2, banding free magnitude, local off-resonance, and RF phase using phase-cycled bSSFP data. All these parameters are estimated from a linear least squares fitting of an ellipse to complex data.
The PLANET method is based on a Lorentzian single-component relaxation model, which results in symmetric bSSFP magnitude profile and elliptical behavior of the complex transverse magnetization. However, when a second or more components with different frequency distributions are present within a voxel, the complex signal might not lie on an ellipse anymore. Hence, PLANET post-processing would return erroneous quantitative parameters.
In this study we show that the sensitivity of PLANET to the presence of multiple components can be exploited to map the spatial distribution of voxels in which multiple spectral peaks are present. We demonstrate that this feature of PLANET can be used to create fat-only map.
Purpose
The PLANET method was introduced to simultaneously map T1, T2, banding free magnitude, local off-resonance, and RF phase using phase-cycled bSSFP data.1 All these parameters are estimated from a linear least squares fitting of an ellipse to complex phase-cycled bSSFP data.
The PLANET method is based on a Lorentzian single-component relaxation model, which results in symmetric bSSFP magnitude profile and elliptical behavior of the complex transverse magnetization. However, when a second or more components with different frequency distributions are present within a voxel, the complex signal might not lie on an ellipse anymore. Hence, PLANET post-processing would return erroneous quantitative parameters.2
The purpose of this study was to show that the sensitivity of PLANET to the presence of multiple components can be exploited to map the spatial distribution of voxels in which multiple spectral peaks are present. We demonstrate that this feature of PLANET can be used to create fat-only map.
Methods
The complex phase-cycled bSSFP signal can be represented as 3,4:
$$I = M_{eff}\frac{1-ae^{i(2πTR∆f_0+Δθ)}}{1-b\cos(2πTR∆f_0+Δθ)}e^{i(2πTE∆f_0+φ_{RF})} [1]$$
where Meff, a, b depend on T1, T2, TR, FA. ∆θ is the user-controlled RF phase increment, Δf0 is the local off-resonance, φRF is the combined RF transmit and receive phase.
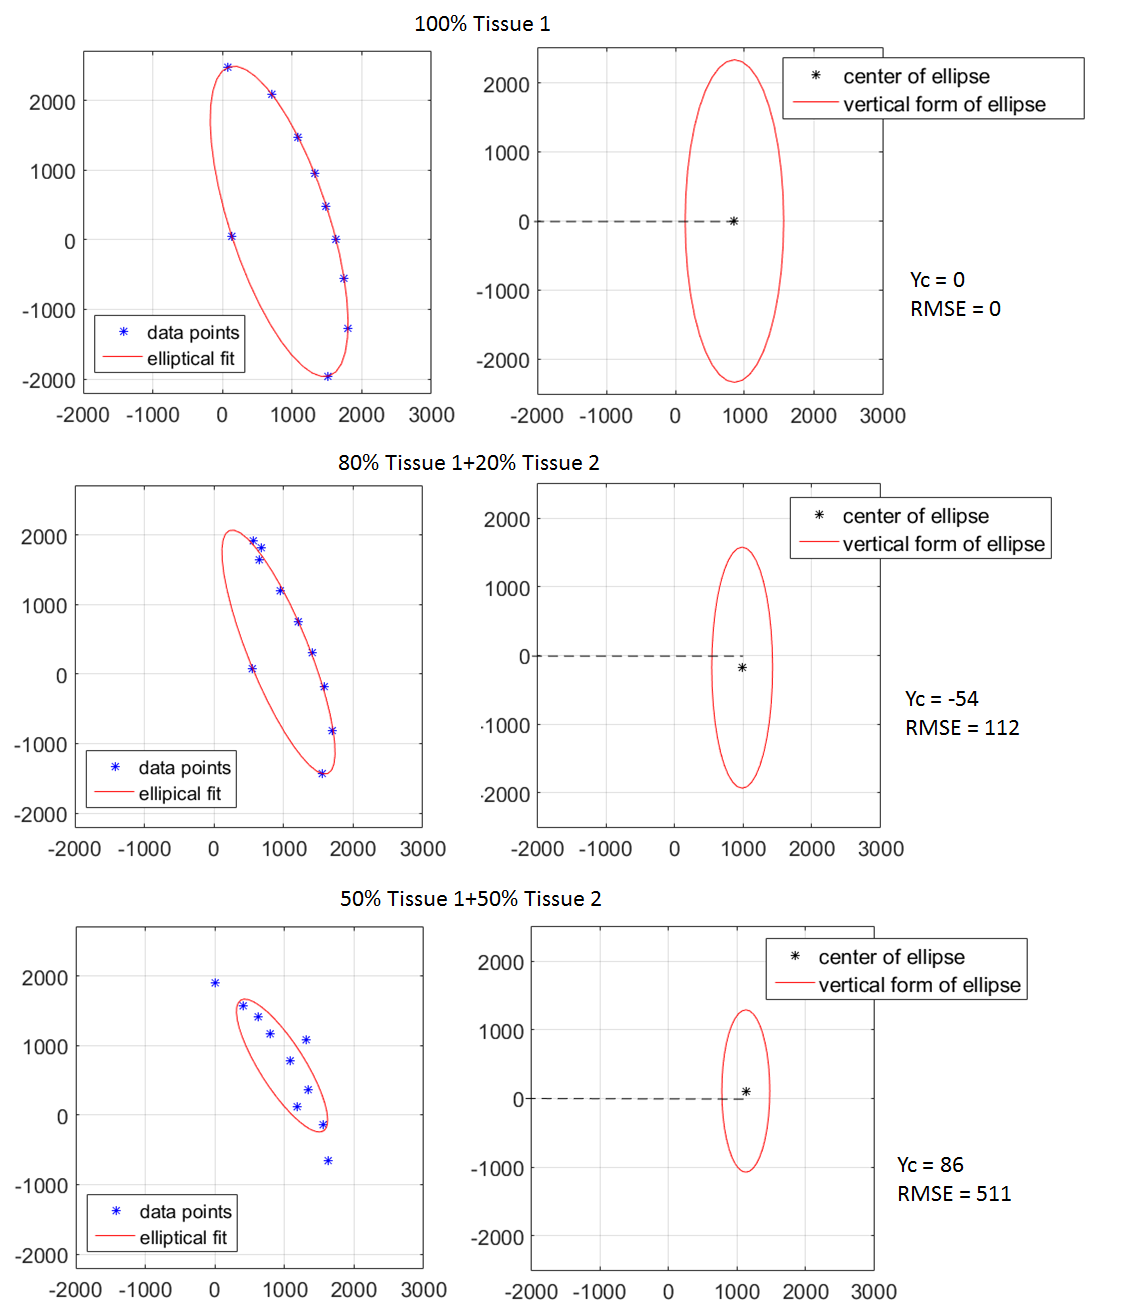
For a single-component, Eq.1 describes an ellipse in the complex signal plane. The conic vertical form of the ellipse is:
$$\frac{(X-X_{c})}{A^{2}}^{2}+\frac{(Y-Y_{c})}{B^{2}}^{2}=1 [2]$$
where (Xc,Yc) - is the geometrical center of the vertical ellipse, A,B - are semi-axes. Xc,Yc, A, B can be found by fitting a general quadratic polynomial function to the complex data points.1 Note, that in case of a single-component tissue model the ellipse lies on the real axis (Yc = 0).
The complex phase-cycled bSSFP signal in case of multiple components is a complex sum of single-component signals. When the components have different frequency distributions, the complex signal might not describe an ellipse anymore, and interestingly, in that case the geometrical center of a fitted ellipse (after PLANET post-processing) does not lie on the real axis (Yc ≠ 0).
To show how the complex signal from a two-component tissue depends on the fraction of the second component, numerical simulations were performed for different fractions of the second component: 0%, 20%, 50%. (first component:T1,1 = 2000 ms, T2,1 = 500 ms; second component T1,2 = 300 ms, T2,2 = 80 ms, ∆f = 220 Hz).
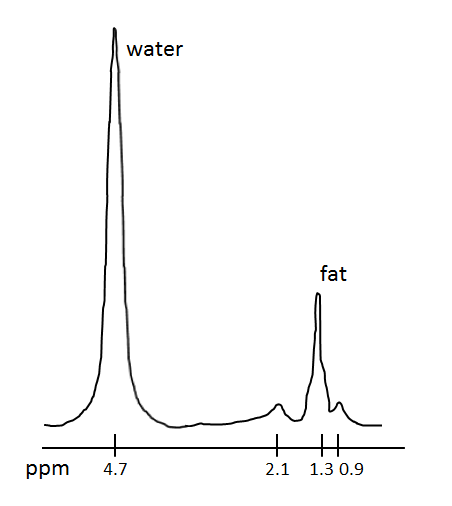
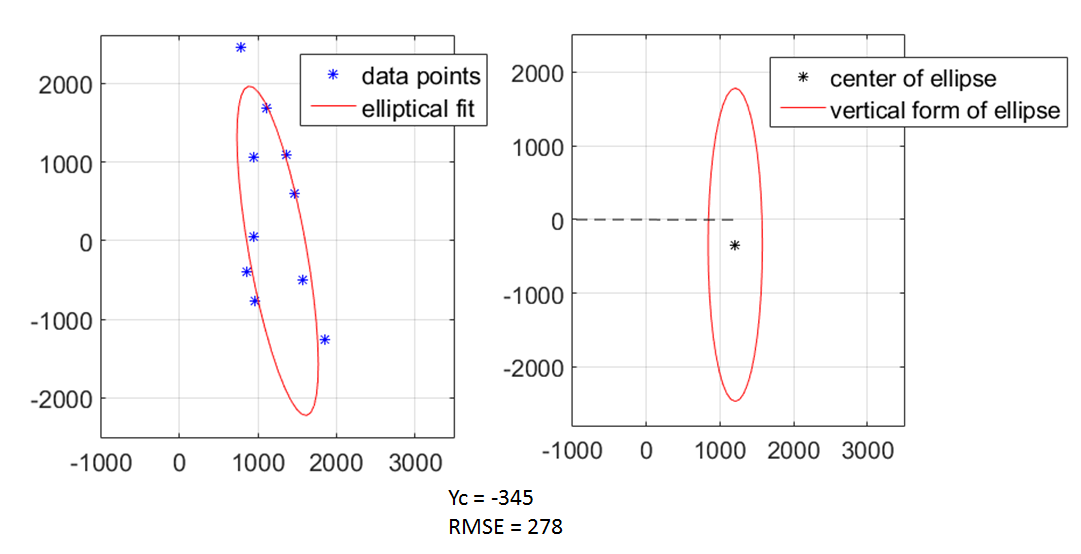
A second simulation was performed specifically for fat tissue including 3 main components into the model (Figure 1).
In both simulations, the root mean square error was used as a goodness of fit parameter for the ellipse fitting problem:
$$RMSE =\sqrt{\sum_{n=1}^{N_{cycles}}D_n^2} [3]$$
where Dn - the minimal distance from a nth data point to the fitted ellipse, n - the number of dynamic acquisition. The parameter Yc was calculated as well.
MRI experiments in the calf of a healthy volunteer were performed using
a clinical 1.5T MR scanner (Philips Ingenia, Best, The Netherlands). Phase-cycled
bSSFP images were acquired with the parameter settings: FOV 200x200x45
mm3, voxel size 1x1x3 mm3, TR 9.2 ms, FA 20˚, 10
phase cycles with Δθ =
π/5, 6s of dummies before each dynamic acquisition. Total scan
time 05:17 min. T2w multi-slice mDiXON scan with the same FOV and voxel size was
performed for fat imaging (01:38
min).
Results
For a two-component tissue, the signal deviates from the elliptical shape with increasing fraction of the second component (Figure 2). The RMSE increases with increasing fraction of the second component. Moreover, the geometrical center of the vertical ellipse shifts, and Yc increases its absolute value with increasing fraction of the second component.
Figure 3 shows the simulation results for 3-peak fat model: again, data points deviate from the elliptical shape and Yc has a higher absolute value.
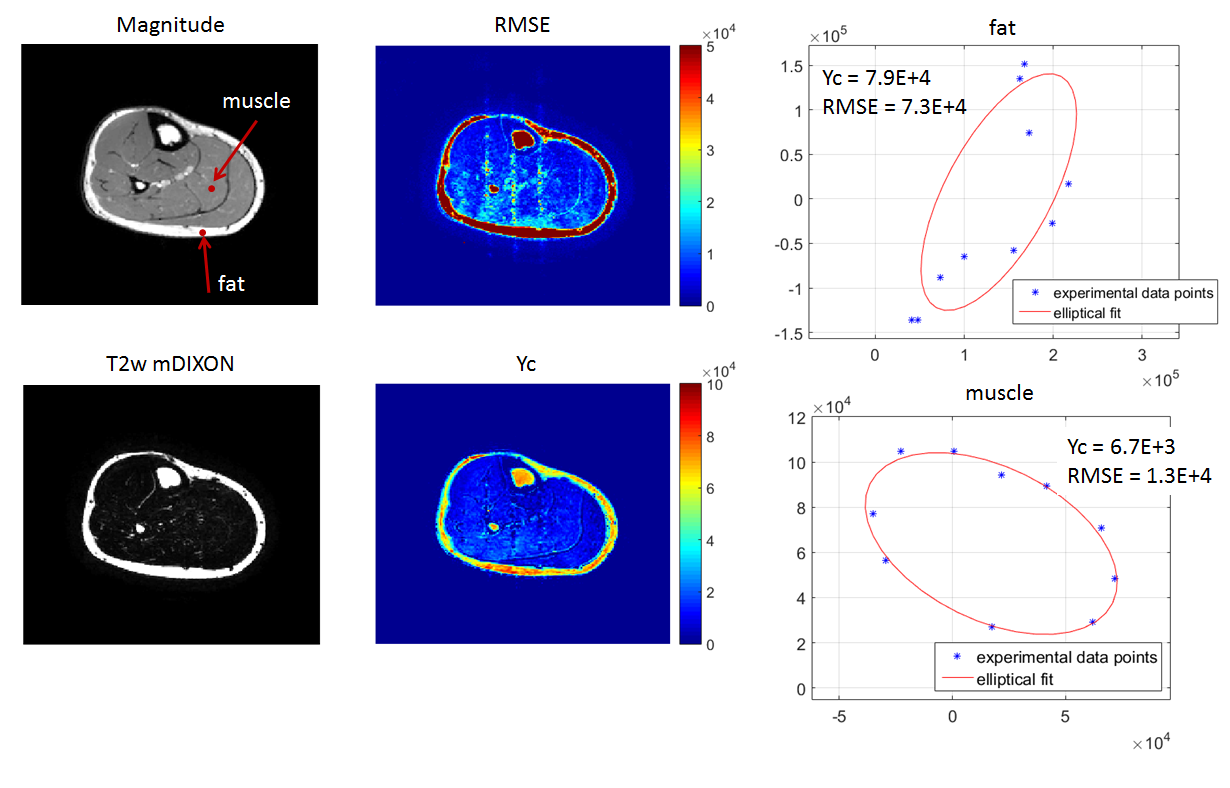
Figure 4 shows the in vivo experimental results in calf muscle. The RMSE is significantly higher in fat than in muscle. The voxels with high Yc value seem to correspond to fat voxels in reference T2w mDIXON image. The vertical stripes are due to ghosting caused by pulsatile blood flow.
Discussion and Conclusion
We have demonstrated that in case of a multiple components with different frequency distribution the complex phase-cycled bSSFP signal deviates from the elliptical shape. Consequently, quantitative parameters estimated with PLANET might be biased, as was previously shown for brain tissue.2 However, by calculating the RMSE and Yc, one could identify regions returning erroneous estimates. Furthermore, PLANET-estimated parameter Yc appears to be very sensitive to the presence of multiple components.
In fat tissue consisting of multiple spectral peaks, value of Yc can be used to return a fat-only map. This suggests that the PLANET method can be used for fat detection.
Acknowledgements
This research was supported by The Netherlands Foundation for Scientific Research Institutes (NWO), Domain Applied and Engineering Sciences; grant 12813.References
(1) Shcherbakova et.al. Magn. Reson. Med. 79 (2018);
(2) Shcherbakova et.al. Magn. Reson. Med. 00 (2018);
(3) Xiang et.al. Magn. Reson. Med. 71 (2014);
(4) Lauzon et.al. Concepts Magn.Reson. 34A (2009).
Figures