4012
Robust Chemical Exchange Spin-lock performed using adiabatic pulse with Toggling Inversion Preparation at 3.0T1Department of Imaging and Interventional Radiology, The Chinese University of Hong Kong, Hong Kong, Hong Kong, 2Department of Radiology, University of Pittsburgh, Pittsburgh, PA, United States
Synopsis
The measurement of R1rho (1/T1rho) spectrum and its asymmetry have several advantages over Chemical Exchange Saturation Transfer (CEST) to probe chemical exchange effect. However, these approaches suffer from B1 Radiofrequency (RF) and B0 field inhomogeneities. In this work, we proposed a new approach to perform robust R1rho asymmetry measurement using adiabatic spin-lock RF pulse and demonstrated its potential to probe metabolites.
Introduction
The endogenous chemical exchange sensitive MRI imaging approaches provide valuable insights into probing metabolites, proteins, and tissue pH, which has significant clinical benefits. The measurement of R1rho (1/T1rho) spectrum and its asymmetry may have advantages over Chemical Exchange Saturation Transfer (CEST) to probe chemical exchange effect.1,2 However, these approaches suffer from B1 RF and B0 field inhomogeneities. In this work, we present a new approach to improve the robustness of measurement of R1rho-spectrum and asymmetry for imaging of metabolites. Simulations, phantom, and in vivo data were used to demonstrate the performance of our proposed approach.Methods
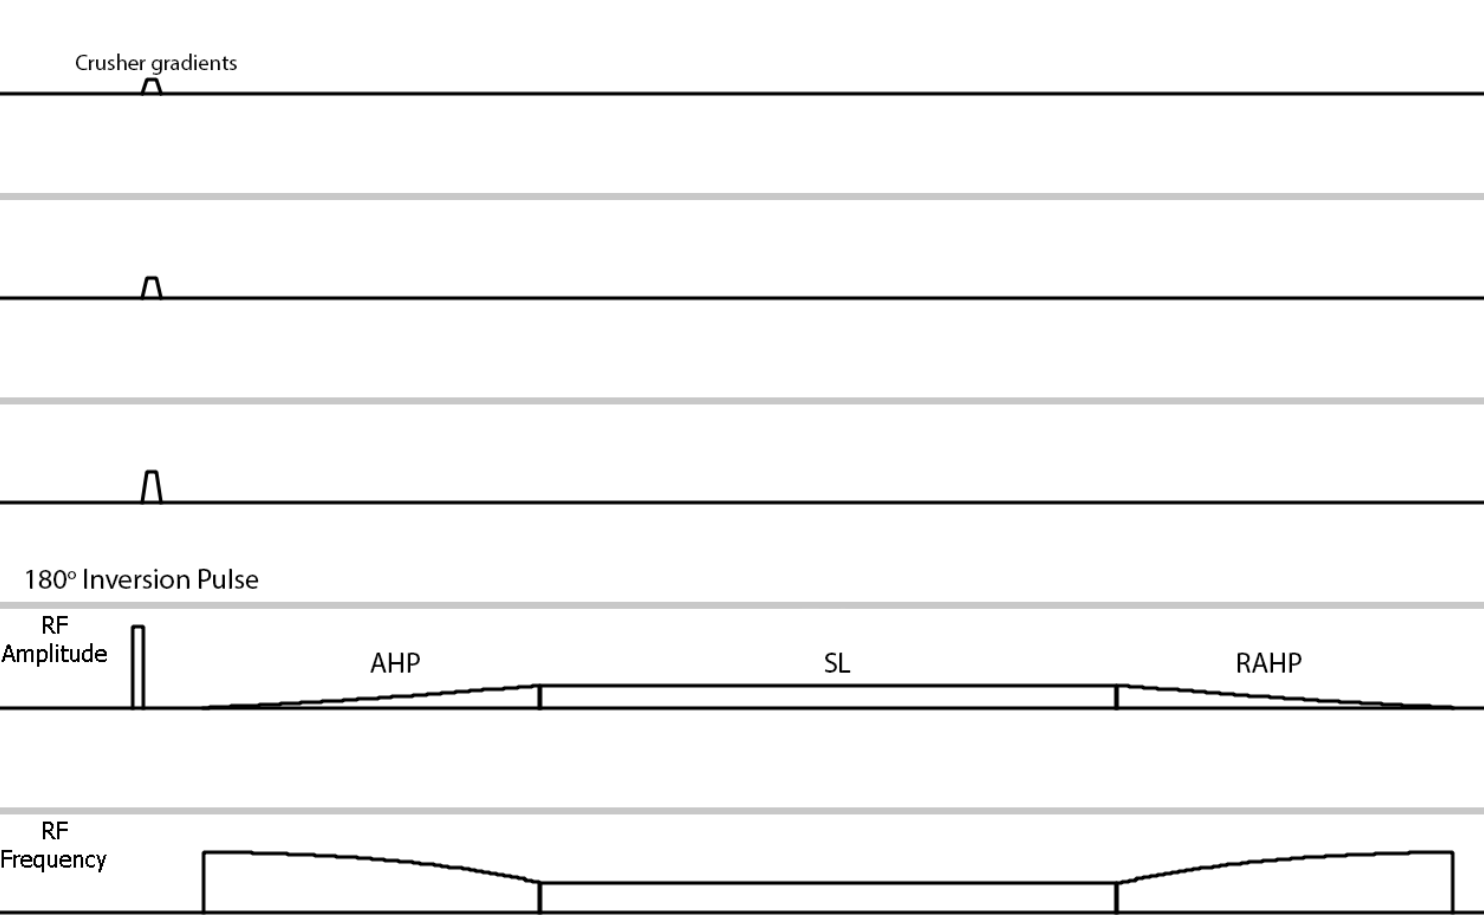
We used a toggling inversion approach reported,1 and combine it with the adiabatic spin-lock approach3,4 to address the aforementioned problem. The proposed spin-lock RF pulse cluster is shown in Figure 1. A toggling inversion pulse and crushers are applied preceding off-resonance adiabatic spin-lock. When the inversion pulse is turned off, the magnetization after spin-lock can be expressed as:$$M^{tsl}=M_{01}\cdot e^{-R_{1\rho }\cdot tsl}+M_{01}S_{ss}\cdot (1-e^{-R_{1\rho }\cdot tsl}), [1]$$and when the inversion pulse is turned on, the magnetization can be expressed as:$$M_{i}^{tsl}=-M_{02}\cdot e^{-R_{1\rho }\cdot tsl}+M_{02}S_{ss}\cdot (1-e^{-R_{1\rho }\cdot tsl}), [2]$$where $$$M_{01}$$$ and $$$M_{02}$$$ are the magnetizations when TSL = 0ms, $$$S_{ss}$$$ is the steady state signal. Note that $$$M_{01}$$$ and $$$M_{02}$$$ are different at the presence of field inhomogeneities. Therefore, it is not possible to remove them by subtracting the two equations. To address this, two additional pairs of data at TSL 0ms are collected to remove $$$M_{01}$$$ and $$$M_{02}$$$. After this process, the R1rho-spectrum can then be calculated from the difference of the magnetization with and without the inversion RF pulse. The R1rho asymmetry at the chemical shift of the metabolites can be calculated from the R1rho-spectrum.
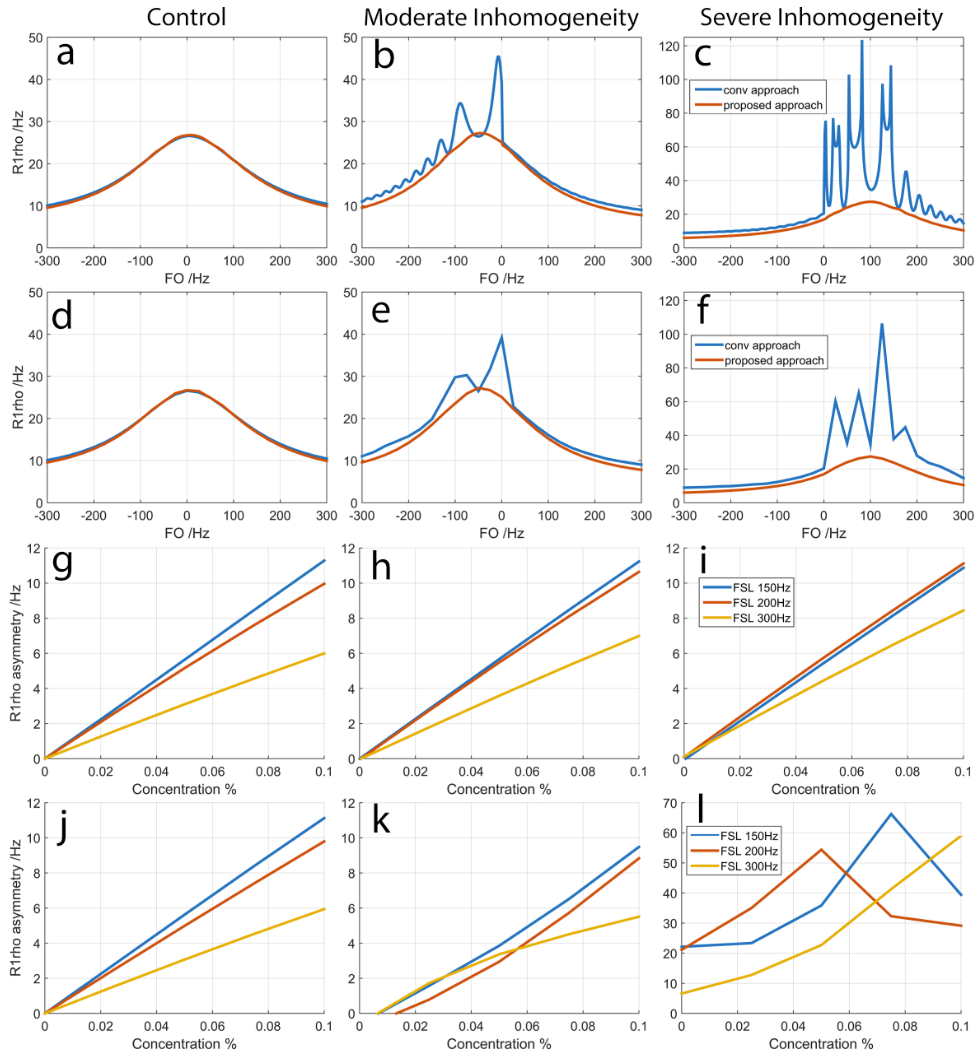
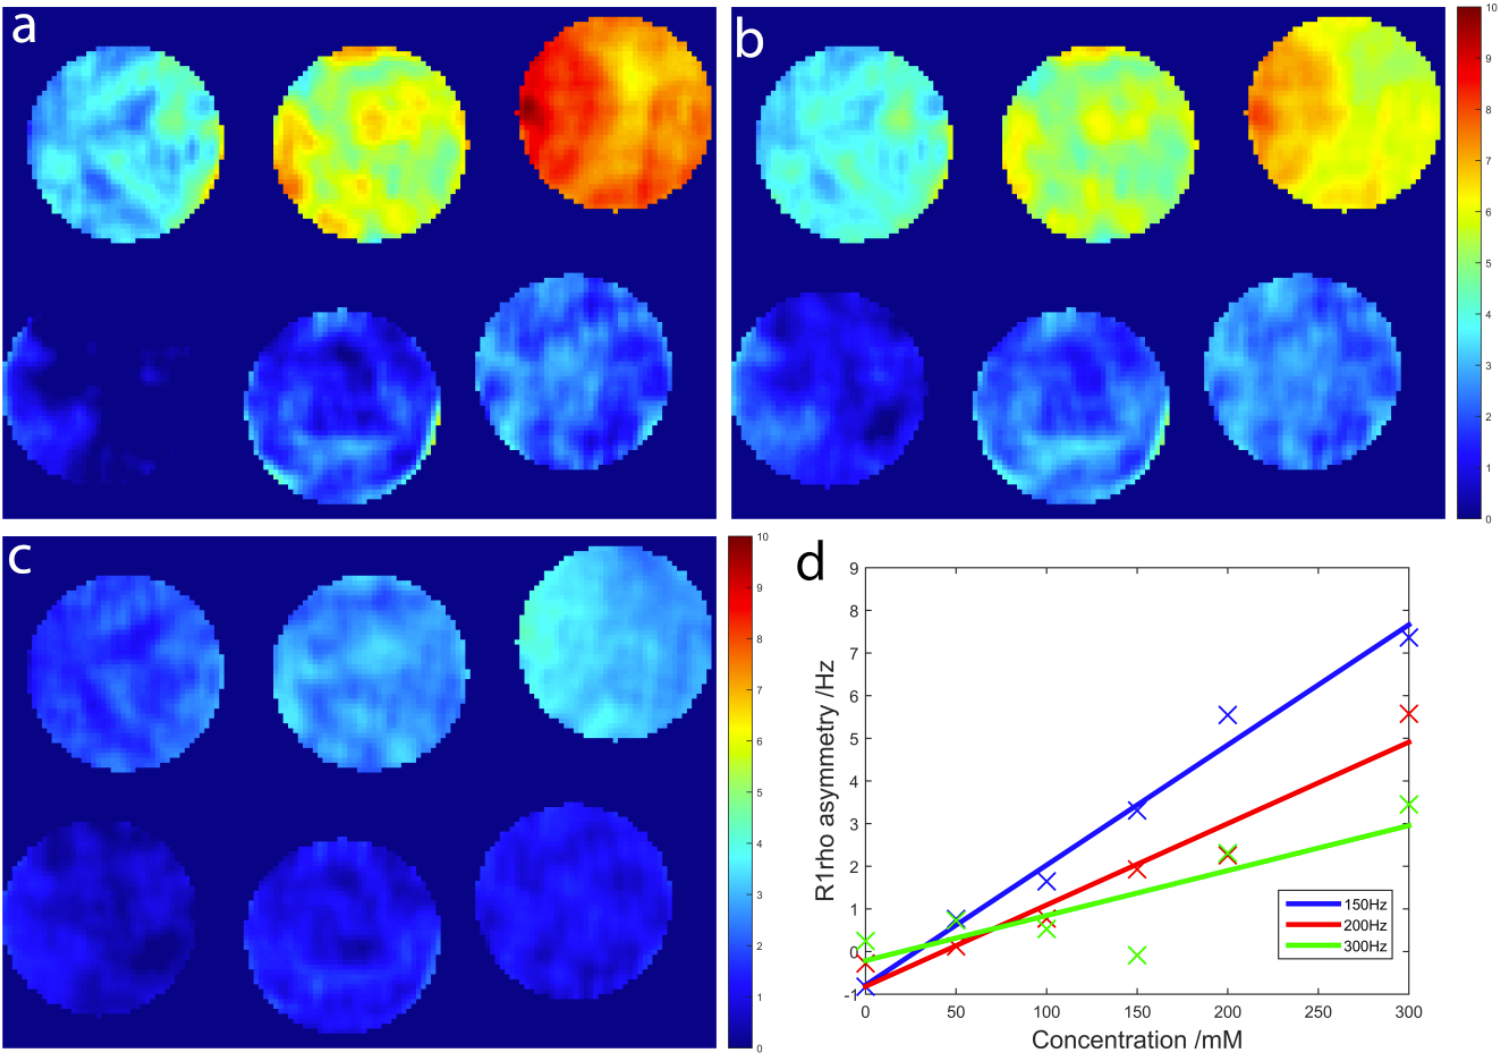
We performed the conventional approach1 and our proposed approach using simulation, phantom and in vivo experiments. Simulations were performed using parameters of cartilage, five concentrations of metabolites are selected from 0 to 0.1. Three groups of B1 RF and B0 field inhomogeneities were added: control (no B1 RF and B0 inhomogeneity), moderate (90% B1 and 50Hz B0) and severe (80% B1 and -100Hz B0). Six tubes of 4% agarose and myo-inositol concentration 0mM, 50mM, 100mM, 150mM, 200mM and 300mM were used in the phantom study. Phantoms and in vivo knee data sets were acquired from a Philips Achieva TX 3.0T system using eight-channel head and knee coils, respectively. Volunteer scan was conducted under the approval of the Institutional Review. 2D Fast Spin Echo was used for imaging data acquisition. Scans were performed at resonance frequency offsets (FO) from -300 to 300Hz with 25Hz increment, the same frequency offset was used to run simulations, and repeated with 2Hz increment. Frequencies of spin-lock (FSL) for simulations and phantoms were 150Hz, 200Hz and 300Hz, for in vivo were 150Hz and 250Hz. Time of spin-lock was 60ms. For Phantom and in vivo experiments, an order of 15 polynomial fitting was used to fit the R1rho-spectrum to perform asymmetry analysis. R1rho asymmetry was calculated at 0.9ppm to 1.1 ppm.
Results and Discussion
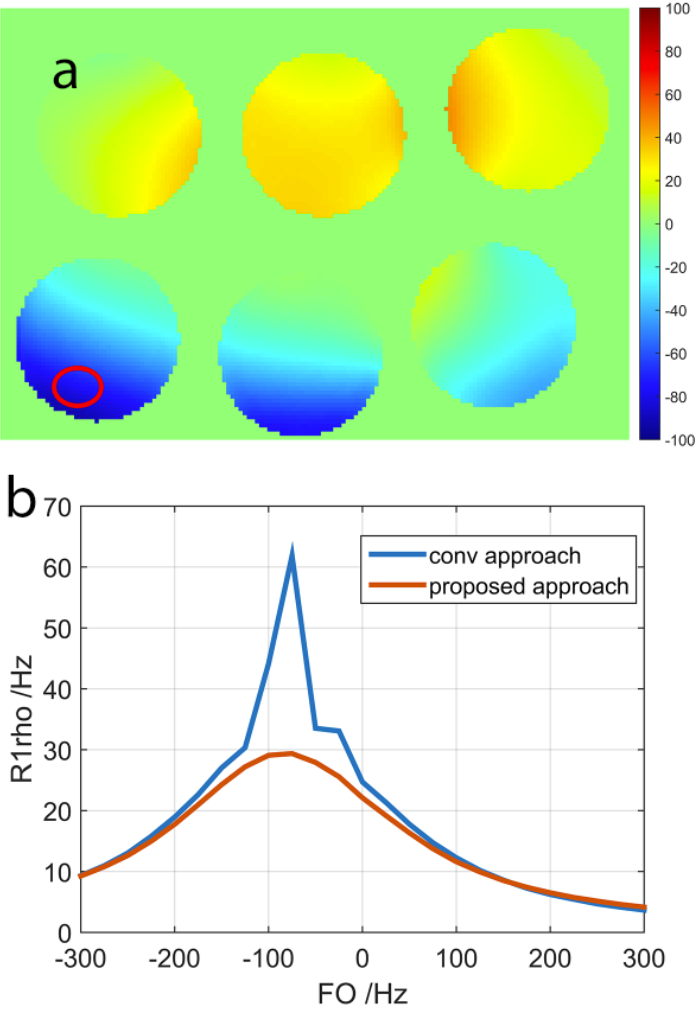
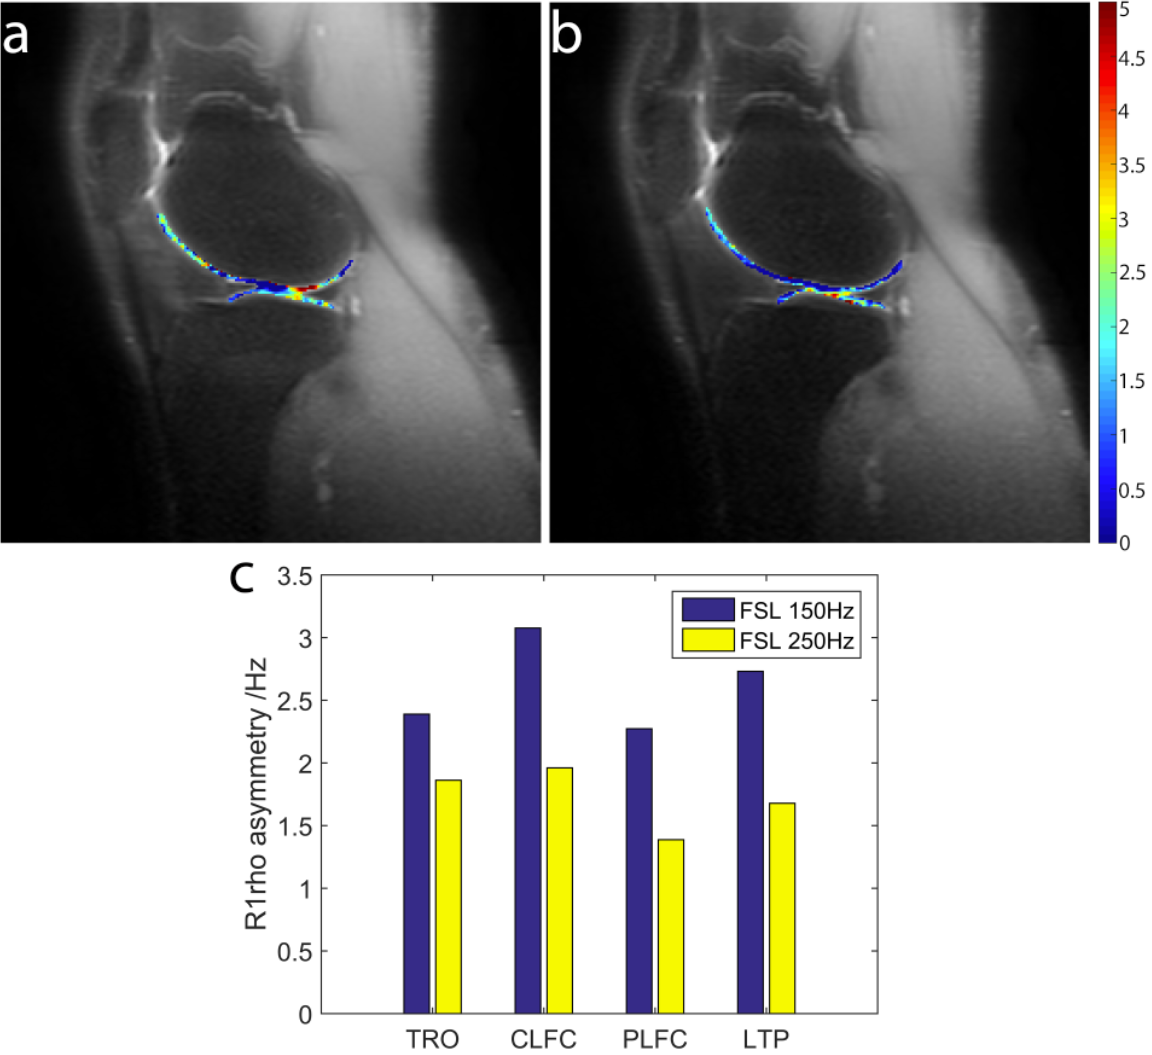
Figure 2 shows the simulation results. The conventional approach results in oscillation in R1rho-spectrum when there are field inhomogeneities. In contrast, the proposed approach results in smooth R1rho-spectrum regardless of field inhomogeneities. The same effect was observed in the linear relationship between R1rho measurement and the concentration of metabolites. Figure 3 shows the phantom results of the proposed approach. Note the linear relationship of measured R1rho asymmetry and the concentration of metabolites. Note the signal decreases when FSL increases. Figure 4 shows the conventional approach results in a distorted R1rho-spectrum from phantom scanning at regions with obvious B0 inhomogeneity. In contrast, the new approach results in a smooth R1rho-spectrum, which is consistent with simulation. Figure 5 shows the in vivo knee cartilage at FSL 150Hz and 250Hz of our proposed approach. The signal distribution is similar between the two, and the signal decreases with increasing FSL.Conclusion
Our preliminary results demonstrated a more robust approach to perform R1rho asymmetry that is not affected by the presence of field inhomogeneities. It has the potential to probe metabolites in vivo.Acknowledgements
This study is supported by a grant from the Research Grants Council of the Hong Kong SAR (Project SEG CUHK02). We would like to acknowledge general support from Philips Healthcare.References
- Jin T, and Kim S-G. Quantitative Chemical Exchange Sensitive MRI Using Irradiation with Toggling Inversion Preparation. Magnetic Resonance in Medicine, 2012, 68(4), pp. 1056–1064., doi:10.1002/mrm.24449.
- Ling W, Nicholls, F. J, Jin T, et al. Selective Detection of Chemical Exchange Specific R1rho by iTIP gagCEST. ISMRM 2014.
- Jiang B and Chen W. On-Resonance and off-Resonance Continuous Wave Constant Amplitude Spin-Lock and T1ρ Quantification in the Presence of B1 and B0 Inhomogeneities. NMR in Biomedicine, 2018, 31(7), doi:10.1002/nbm.3928.
- Chen W. Artifacts correction for T1rho imaging with constant amplitude spin-lock. J Magn Reson. 2017;274:13‐23. https://doi.org/10.1016/j.jmr.2016.11.002.
Figures