4011
Sub-voxel Estimation of Fat Infiltration in Degenerative Muscle Disorders using Multi-T2 Analysis – a Quantitative Disease Biomarker1Department of Biomedical Engineering, Tel Aviv University, Tel Aviv, Israel, 2CNRS, CRMBM, Aix Marseille University, Marseille, France, 3Sagol School of Neuroscience, Tel Aviv University, Tel Aviv, Israel, 4Center for Advanced Imaging Innovation and Research (CAI2R), New-York University Langone Medical Center, New York, NY, United States
Synopsis
T2 relaxation is an effective biomarker for muscle pathologies including inflammation, necrosis, or fatty infiltration. Accurate quantification of T2 values is hampered due to the inherent bias of fast multi-echo spin-echo (MESE) protocols by stimulated echoes. The echo-modulation curve (EMC) algorithm overcomes this problem and provides accurate T2 values which are stable across scanners and scan-settings. In this work, we present an extension of the EMC algorithm for T2-based fat/water quantification, alongside two new quantitative biomarkers of
Introduction
T2 relaxation is a highly efficient biomarker of muscle health, being sensitive to both macro- and micro-structural changes in muscle tissue, and associated with various muscle dystrophies, inflammatory processes, or neuromuscular disorders1,2. One of the hallmarks of peripheral muscle disorders is the infiltration of subcutaneous fat and a corresponding loss of muscle volume, causing a mixture of two T2 components to appear in each image voxel. A prerequisite of probing these components is to achieve reliable quantification of single-T2 values – a challenging task due to the contamination of fast multi-echo-multi-slice (MESE) protocols by stimulated echoes3. A
recently introduced method, the echo-modulation-curve (EMC) algorithm4,5, can overcome MESE limitations and deliver accurate and
reproducible T2 maps. Relying on precise Bloch simulations of the
experimental pulse-sequence timing-diagram, RF's, and gradient pulses, the EMC
algorithm produces accurate and precise T2 values that are stable across scanners and scan
parameters6.
In
this work, we present two new quantitative biomarkers for muscle health, based on
two T2 component EMC fitting, simultaneously estimating fat and water
fractions within a single voxel, along with the T2 and proton density values of each component.
Methods
MRI scans: the calf muscle of a patient suffering from Dysferlinopathy was scanned on a whole-body 3 T scanner (Siemens Prisma) using a standard MESE protocol. Scan parameters: orientation=axial; TR/TE=1479/8.7 ms; NEchoes=17; 1.5x1.5 mm2; Slice Thickness=10 mm; Tacq=5:07 min; acceleration=2xGRAPPA. Three point DIXON fat/water fraction data was acquired as a reference.
EMC algorithm: Bloch simulations of the MESE protocol were performed using the exact pulse-sequence scheme. Simulations were repeated for a range of T2 and B1+ values (T2=1…1000 ms, B1+ = 85…115 % of nominal value), producing a database of EMCs, each associated with a unique [B1+,T2] value pair (DBWater). A similar DB was created for the fat signal by repeating this process at 3.5 ppm off-resonance (DBFat).
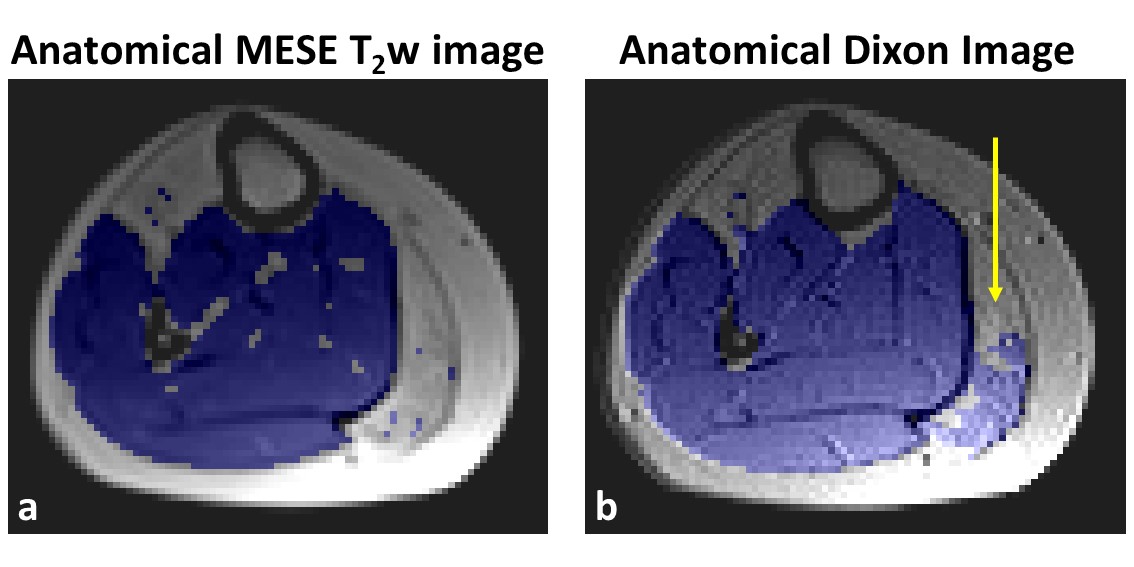
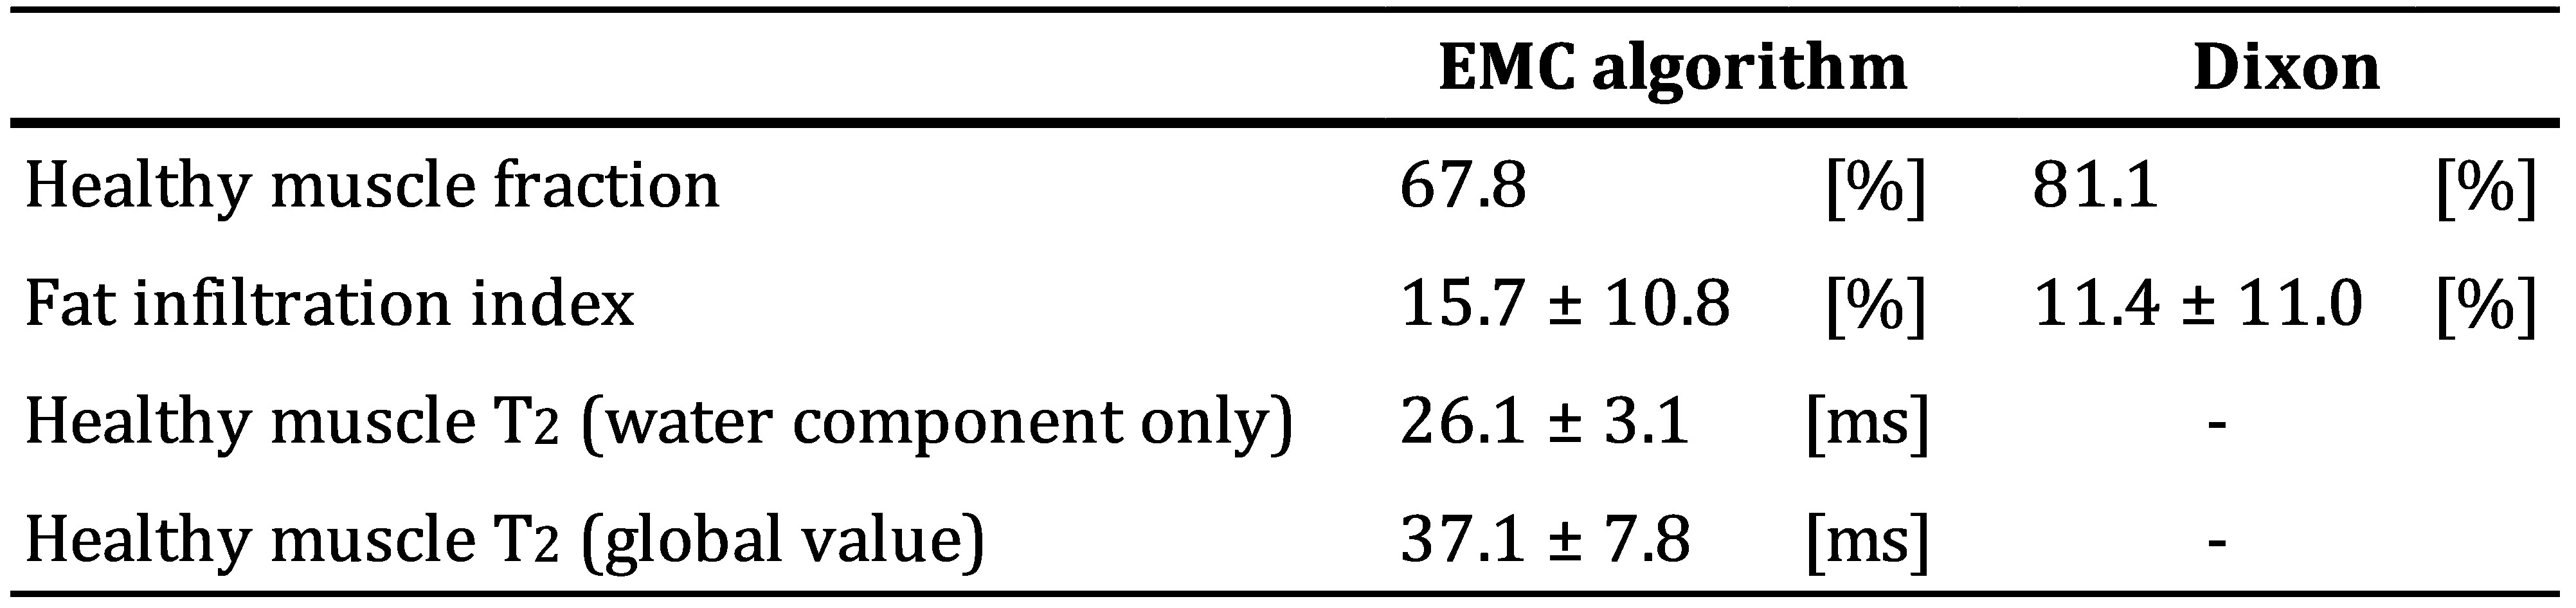
Postprocessing: Water T2, fat T2, and water-fat fraction were calculated based on a two T2 decomposition of the signal in each voxel. Maps of the patient’s calf muscle were segmented to exclude the subcutaneous (SC) fat, and the tibia and fibula bones. Biomarker 1: voxels whose fat fraction was > 50% were labelled as ‘fat’ (i.e. diseased muscle), and the rest were labelled as ‘muscle’ (i.e., healthy muscle marked as a blue shaded area in Figure 1). The % fraction of healthy muscle to whole muscle was then calculated (see Table 1). Biomarker 2: was calculated as the average fat fraction across all voxels in the healthy muscle area, yielding a “fat infiltration index” (Table 1).
Results
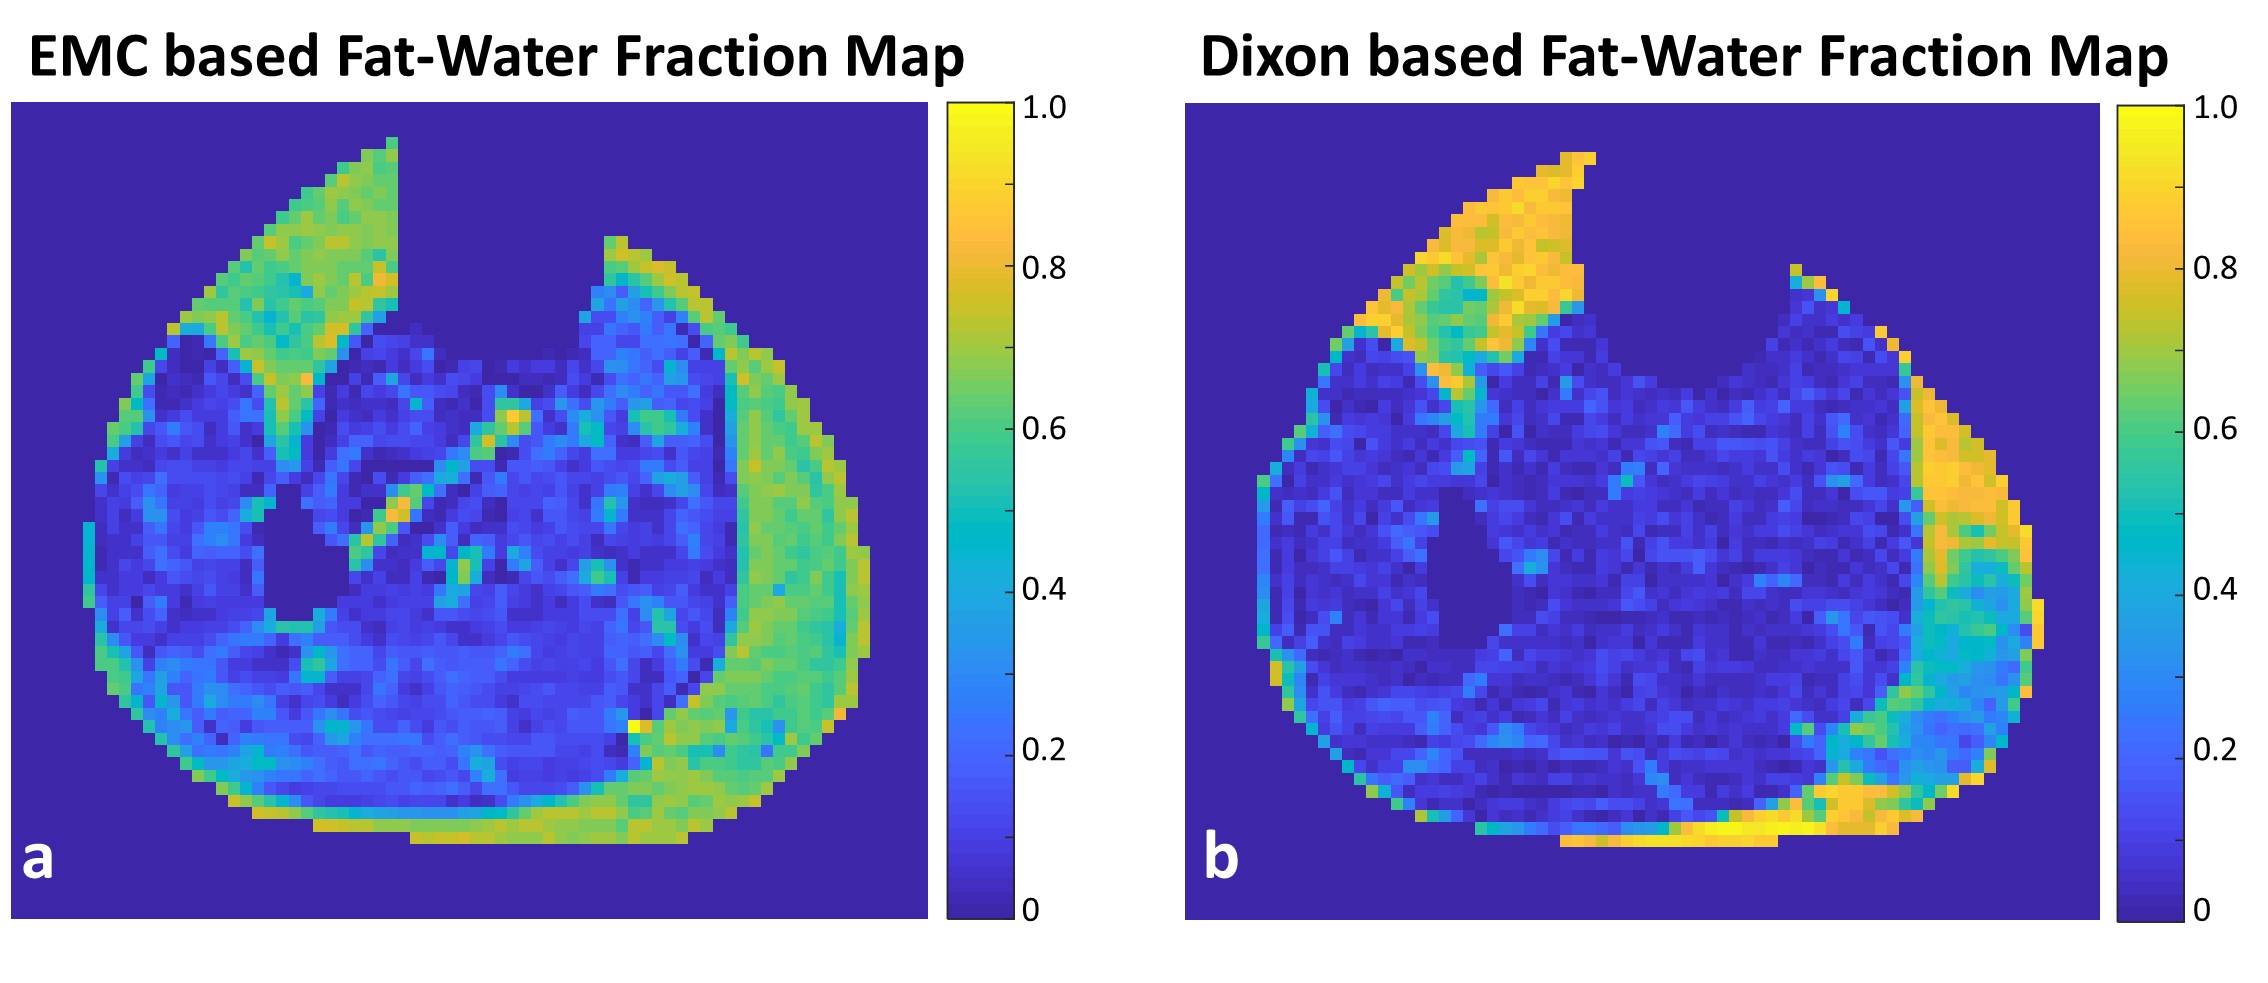
Fig. 1 presents anatomical images of the patient’s calf muscle, superimposed with a mask of the healthy muscle tissue (< 50% fat fraction threshold). Segmentation based on MESE and on reference DIXON data showed similar delineation of the muscle, while the DIXON-based mask erroneously classified part of the diseased muscle tissue as healthy muscle area (yellow arrow). Fig. 2 presents the quantitative fat-water fraction maps of the healthy and diseased muscle segments based on the EMC algorithm and the DIXON technique. Quantitative analysis of these maps is presented in Table 1. Higher estimation of heathy muscle volume (biomarker 1) is produced by the Dixon method due to the mis-labeling shown in Fig 1b. Similar fat infiltration index (biomarker 2) was produced by both methods. In addition to conventional fat/water fraction, the EMC also produced the tissue’s global T2 value, and the T2 value of the water component only.Discussion and Conclusions
The ability to quantify sub-voxel tissue components is highly valuable in clinical applications. Using an extension of the EMC algorithm, we can quantify the relative fraction (i.e., proton density) of both the fat and water components, while at the same time probing changes in their corresponding T2 values, indicative of underlying inflammatory processes7. This allows us to estimate the ratio of healthy to total muscle volume (biomarker 1) and evaluate the "fat infiltration index" in the healthy muscle region (biomarker 2), which can lead to improved diagnosis and treatment planning in muscle pathologies and in other body organs. This suggested approach employs a standard MESE protocol scheme, making it readily available on any clinical or preclinical scanner. It is further attractive as it produced quantitative maps which are invariant across vendors, scanners and scan settings. This gives rise to a standardization of both quantitative T2 and fat/water fraction mapping, facilitating the translation of these parameters from bench to clinic.Target Audience
MSK clinicians & radiologists; basic MR relaxometry scientists.Acknowledgements
ISF Grant 2009/17
NIH P41 EB017183
Dr’s Ben-Eliezer and Bendahan are shared senior authors.
References
[1] Eugenio Mercuri, MD, Anna Pichiecchio, MD, Joanna Allsop, DCR, Sonia Messina, MD, Marika Pane, MD, Francesco Muntoni, MD. Muscle MRI in Inherited Neuromuscular Disorders: Past, Present, and Future. . J Magn Reson Imag 25:433–440 (2007).
[2] Monika Gloor, PhD, Susanne Fasler, MD, Arne Fischmann, MD, Tanja Haas, RT, Oliver Bieri, PhD, Karl Heinimann, MD, PhD, Stephan G. Wetzel, MD, Klaus Scheffler, PhD, and Dirk Fischer, MD. Quantification of Fat Infiltration in Oculopharyngeal Muscular Dystrophy: Comparison of Three MR Imaging Methods. J Magn Reson Imag 33:203–210 (2011).
[3] Hennig J. Multiecho imaging sequences with low refocusing flip angles. J Magn Reson 1988;78:397–407.
[4] Ben-Eliezer N, Sodickson, DK, and Block, KT. Rapid and accurate T2 mapping from multi-spin-echo data using Bloch-simulation-based reconstruction. Magn Reson Med 2015; 73(2): 809-17.
[5] Ben-Eliezer N, Sodickson DK, Shepherd T, Wiggins GC, Block KT. Accelerated and motion robust in vivo T2 mapping from radially undersampled data using Bloch-simulation-based iterative reconstruction. Magn Reson Med 2016; 75(3): 1346-54.
[6] Shepherd TM, Kirov I, Charlson E, Bruno M, Babb J, Sodickson DK, Ben-Eliezer N. "New rapid, accurate T 2 quantification detects pathology in normal-appearing brain regions of relapsing-remitting MS patients." NeuroImage: Clinical 14 (2017): 363-370.
[7] Benjamin M, Pierre-Yves B, Harmen R, Noura A, Ericky AA, Pierre GC, Paulo L de Sousa. Simultaneous muscle water T2 and fat fraction mapping using transverse relaxometry with stimulated echo compensation. NMR in Biomed, 29 (4): 431–443
[8] Jannette Nassar, Dvir Radunsky, Noam Omer, Yann Le Fur, David Bendahan, and Noam Ben-Eliezer. Quantitative estimation of sub-voxel fat and water fractions based on two T2 component fitting in calf muscle. 27th ISMRM Annual Meeting, p.4254, Paris 2018.
Figures