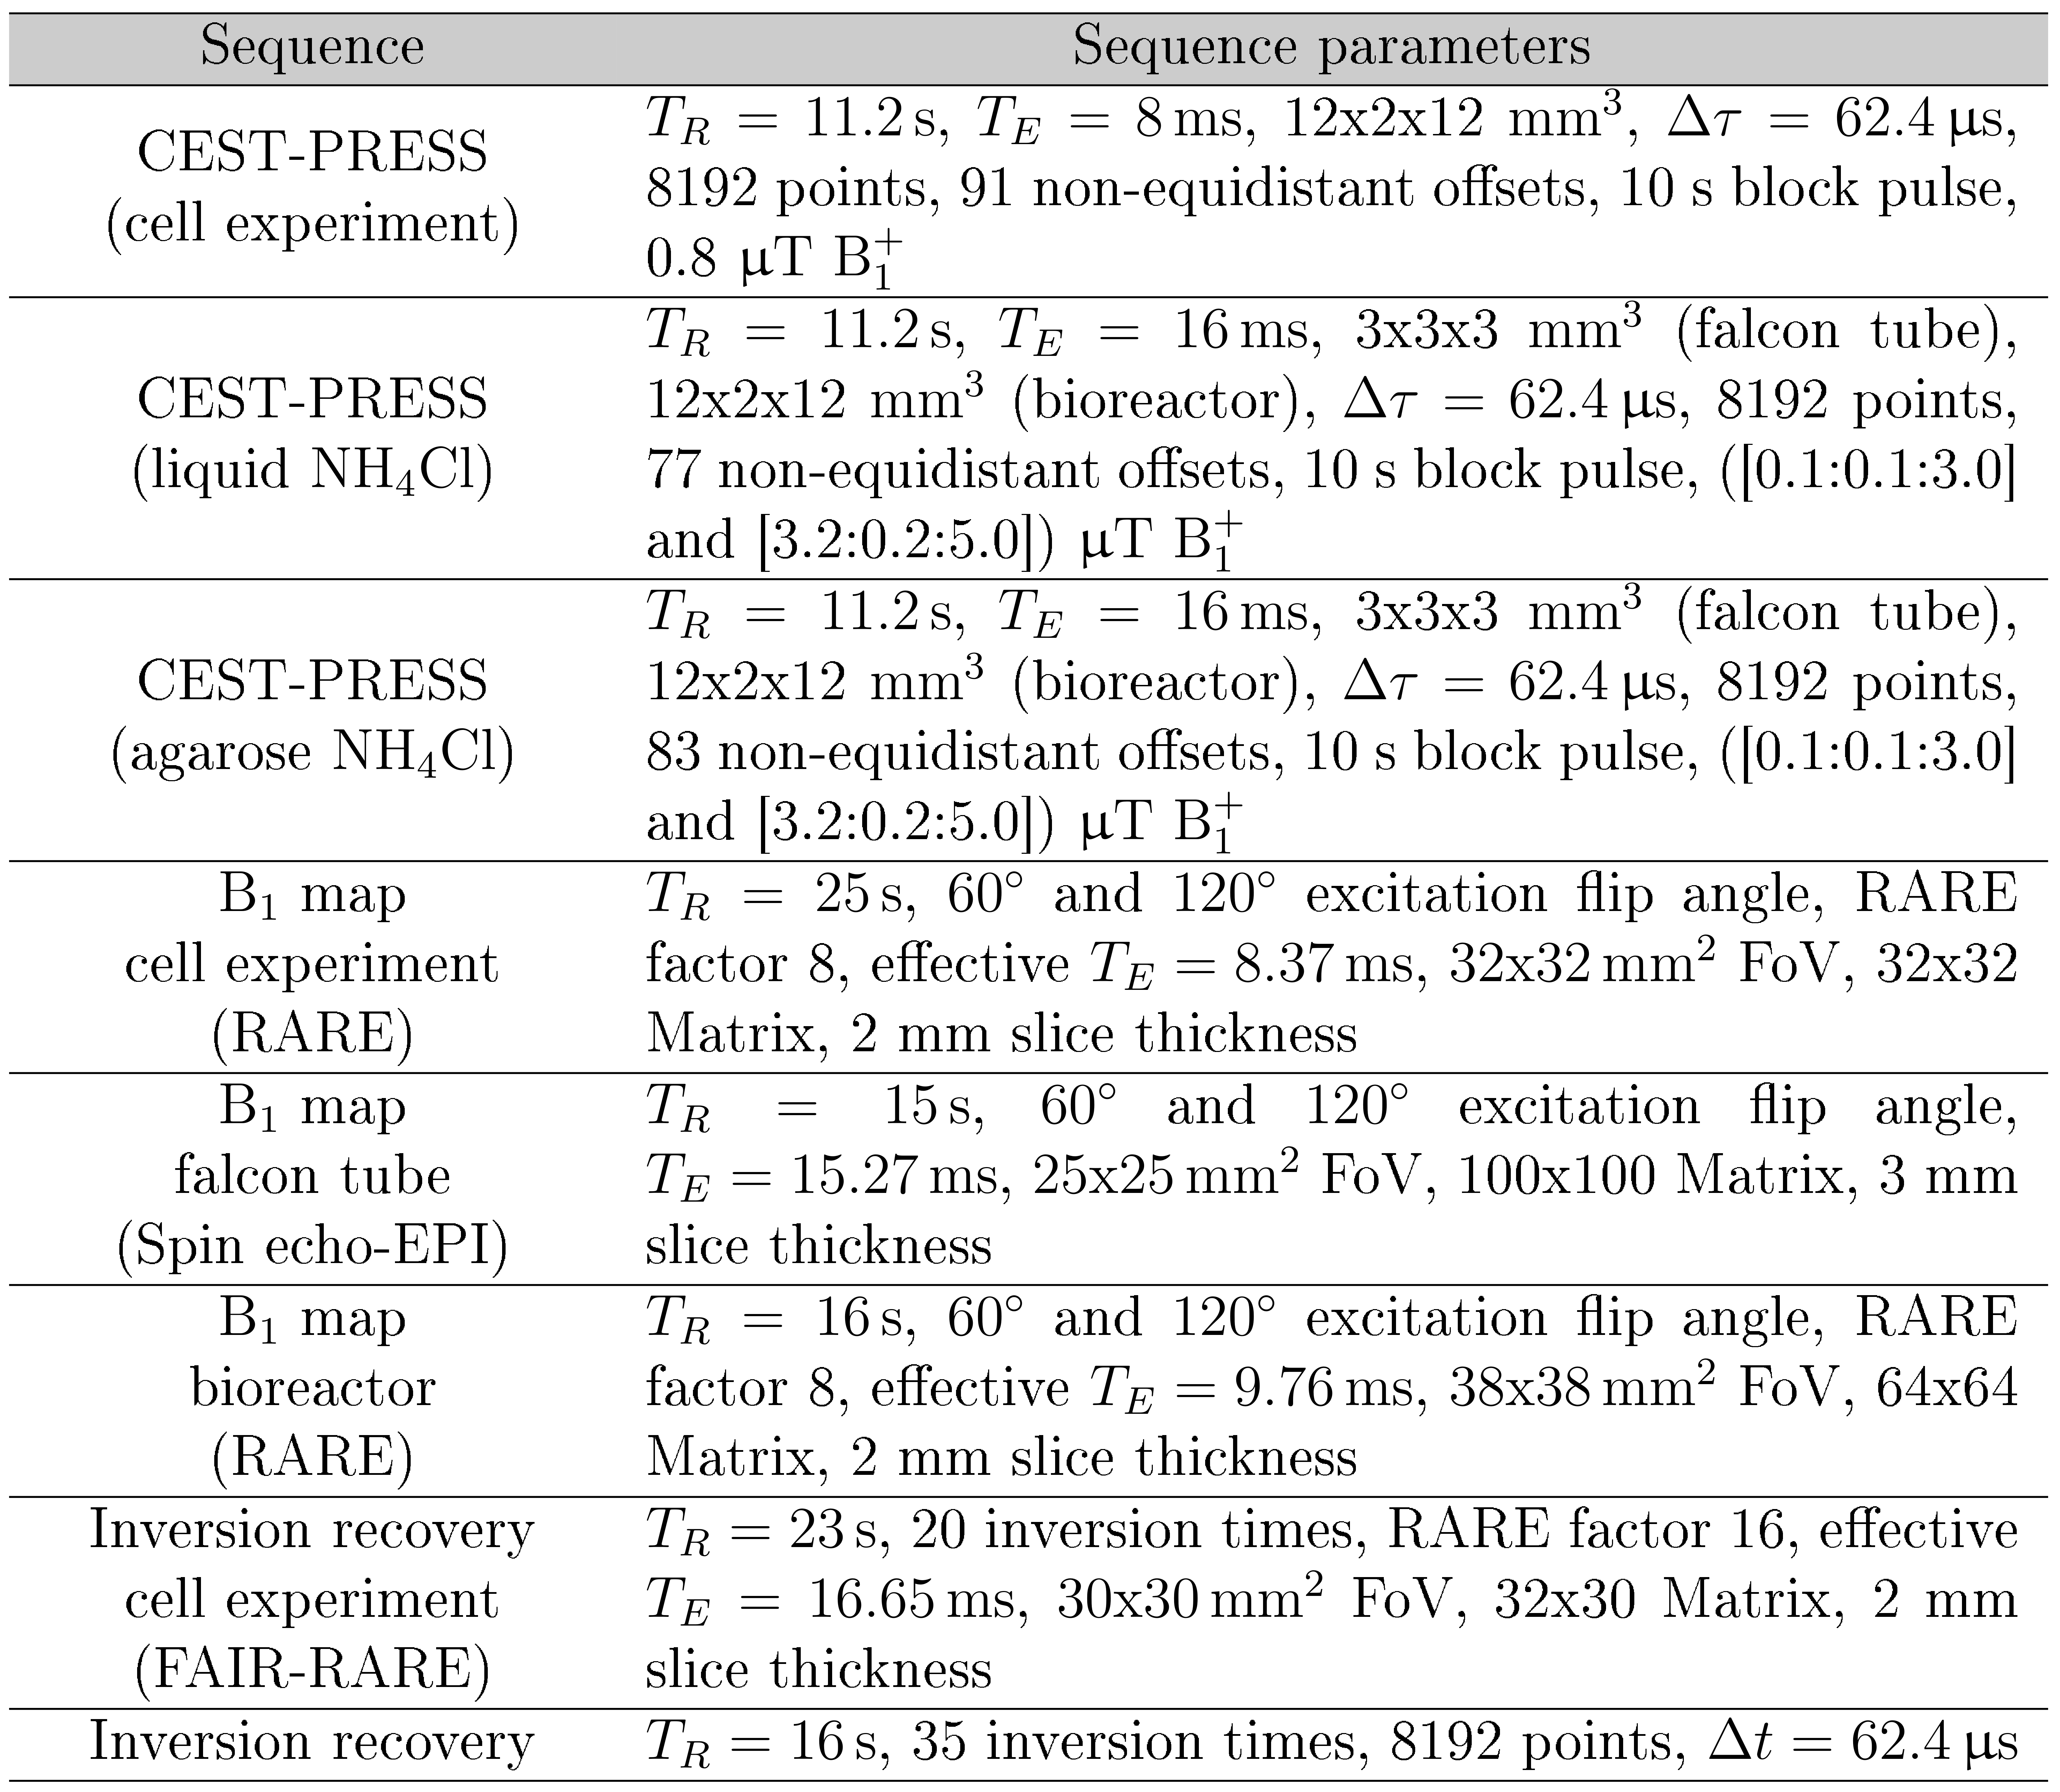
4000
Initial CEST study in a microcavity array based 3D cell culture system1Computer Assisted Clinical Medicine, Heidelberg University, Mannheim, Germany, 2Division of Medical Physics in Radiology, German Cancer Research Center (DKFZ), Heidelberg, Germany, 3Institute of Functional Interfaces, Karlsruhe Institute of Technology, Karlsruhe, Germany
Synopsis
Chemical exchange saturation transfer (CEST) is a powerful method for the investigation of biomolecules. An MR-compatible bioreactor, on the other hand, creates a well-controlled environment for human cells. The combination of both methods should make it possible to extract cellular signals from the bioreactor. Therefore, we investigated the possibility of performing CEST measurements in an actively-perfused bioreactor with HepG2 cells. We could show that perfusion had no effect on the CEST signals and that the main signals originated from the cells. However, the sub-optimal shim condition in the bioreactor led to a reduction in CEST signals.
Purpose:
Chemical exchange saturation transfer (CEST) is a promising method to study biomolecules (e.g. proteins/peptides), their conformational (i.e. folding states1,2) and pH changes3 with an image resolution comparable to conventional MRI. In general, the transfer of phantom to in vivo-studies is complicated because the control of physiological parameters is lost. Furthermore, the clean separation of CEST signal alterations in living tissue is complicated due to the combination of different effects (different tissues, different tissue reactions etc.). An MR-compatible bioreactor system4 simplifies in vivo-conditions (one type of living human cells). This system allows for controlling physiological parameters and can also resemble human in vivo-conditions more closely.
This study investigated the feasibility of performing CEST measurements with an actively perfused bioreactor system equipped with human liver cancer cells (HepG2). Furthermore, the influence of the sub-optimal shim condition within the bioreactor on the CEST signal was evaluated with simple CEST phantoms.
Methods:
A 9.4T preclinical small animal scanner (Bruker Biospec 94/20, Ettlingen Germany) equipped with a quadrature 1H Bruker volume-coil and a Bruker rat receiver surface array was used for the experiments. For all CEST measurements, a localized continuous wave CEST-PRESS sequence was used in combination with a B1+ map (double angle method5). T1 was evaluated either with a global inversion recovery or a FAIR-RARE sequence (Fig.1).
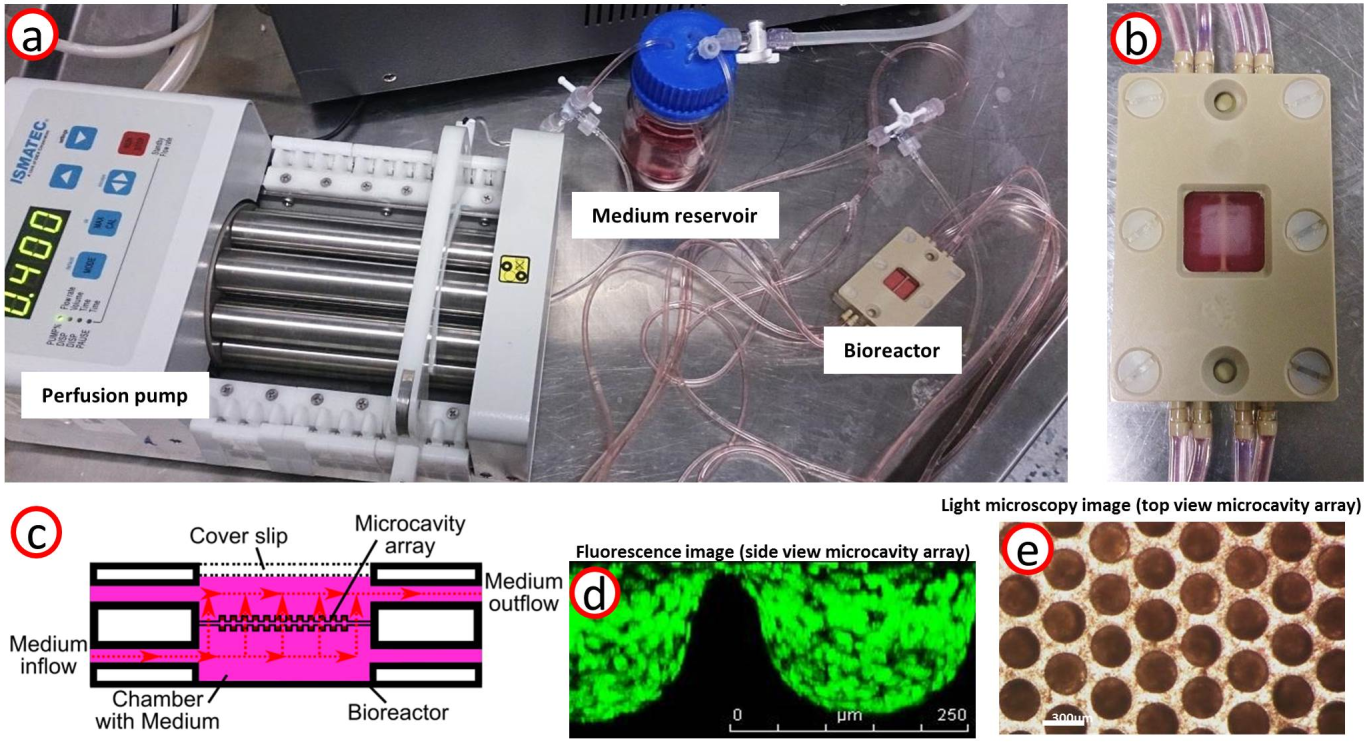
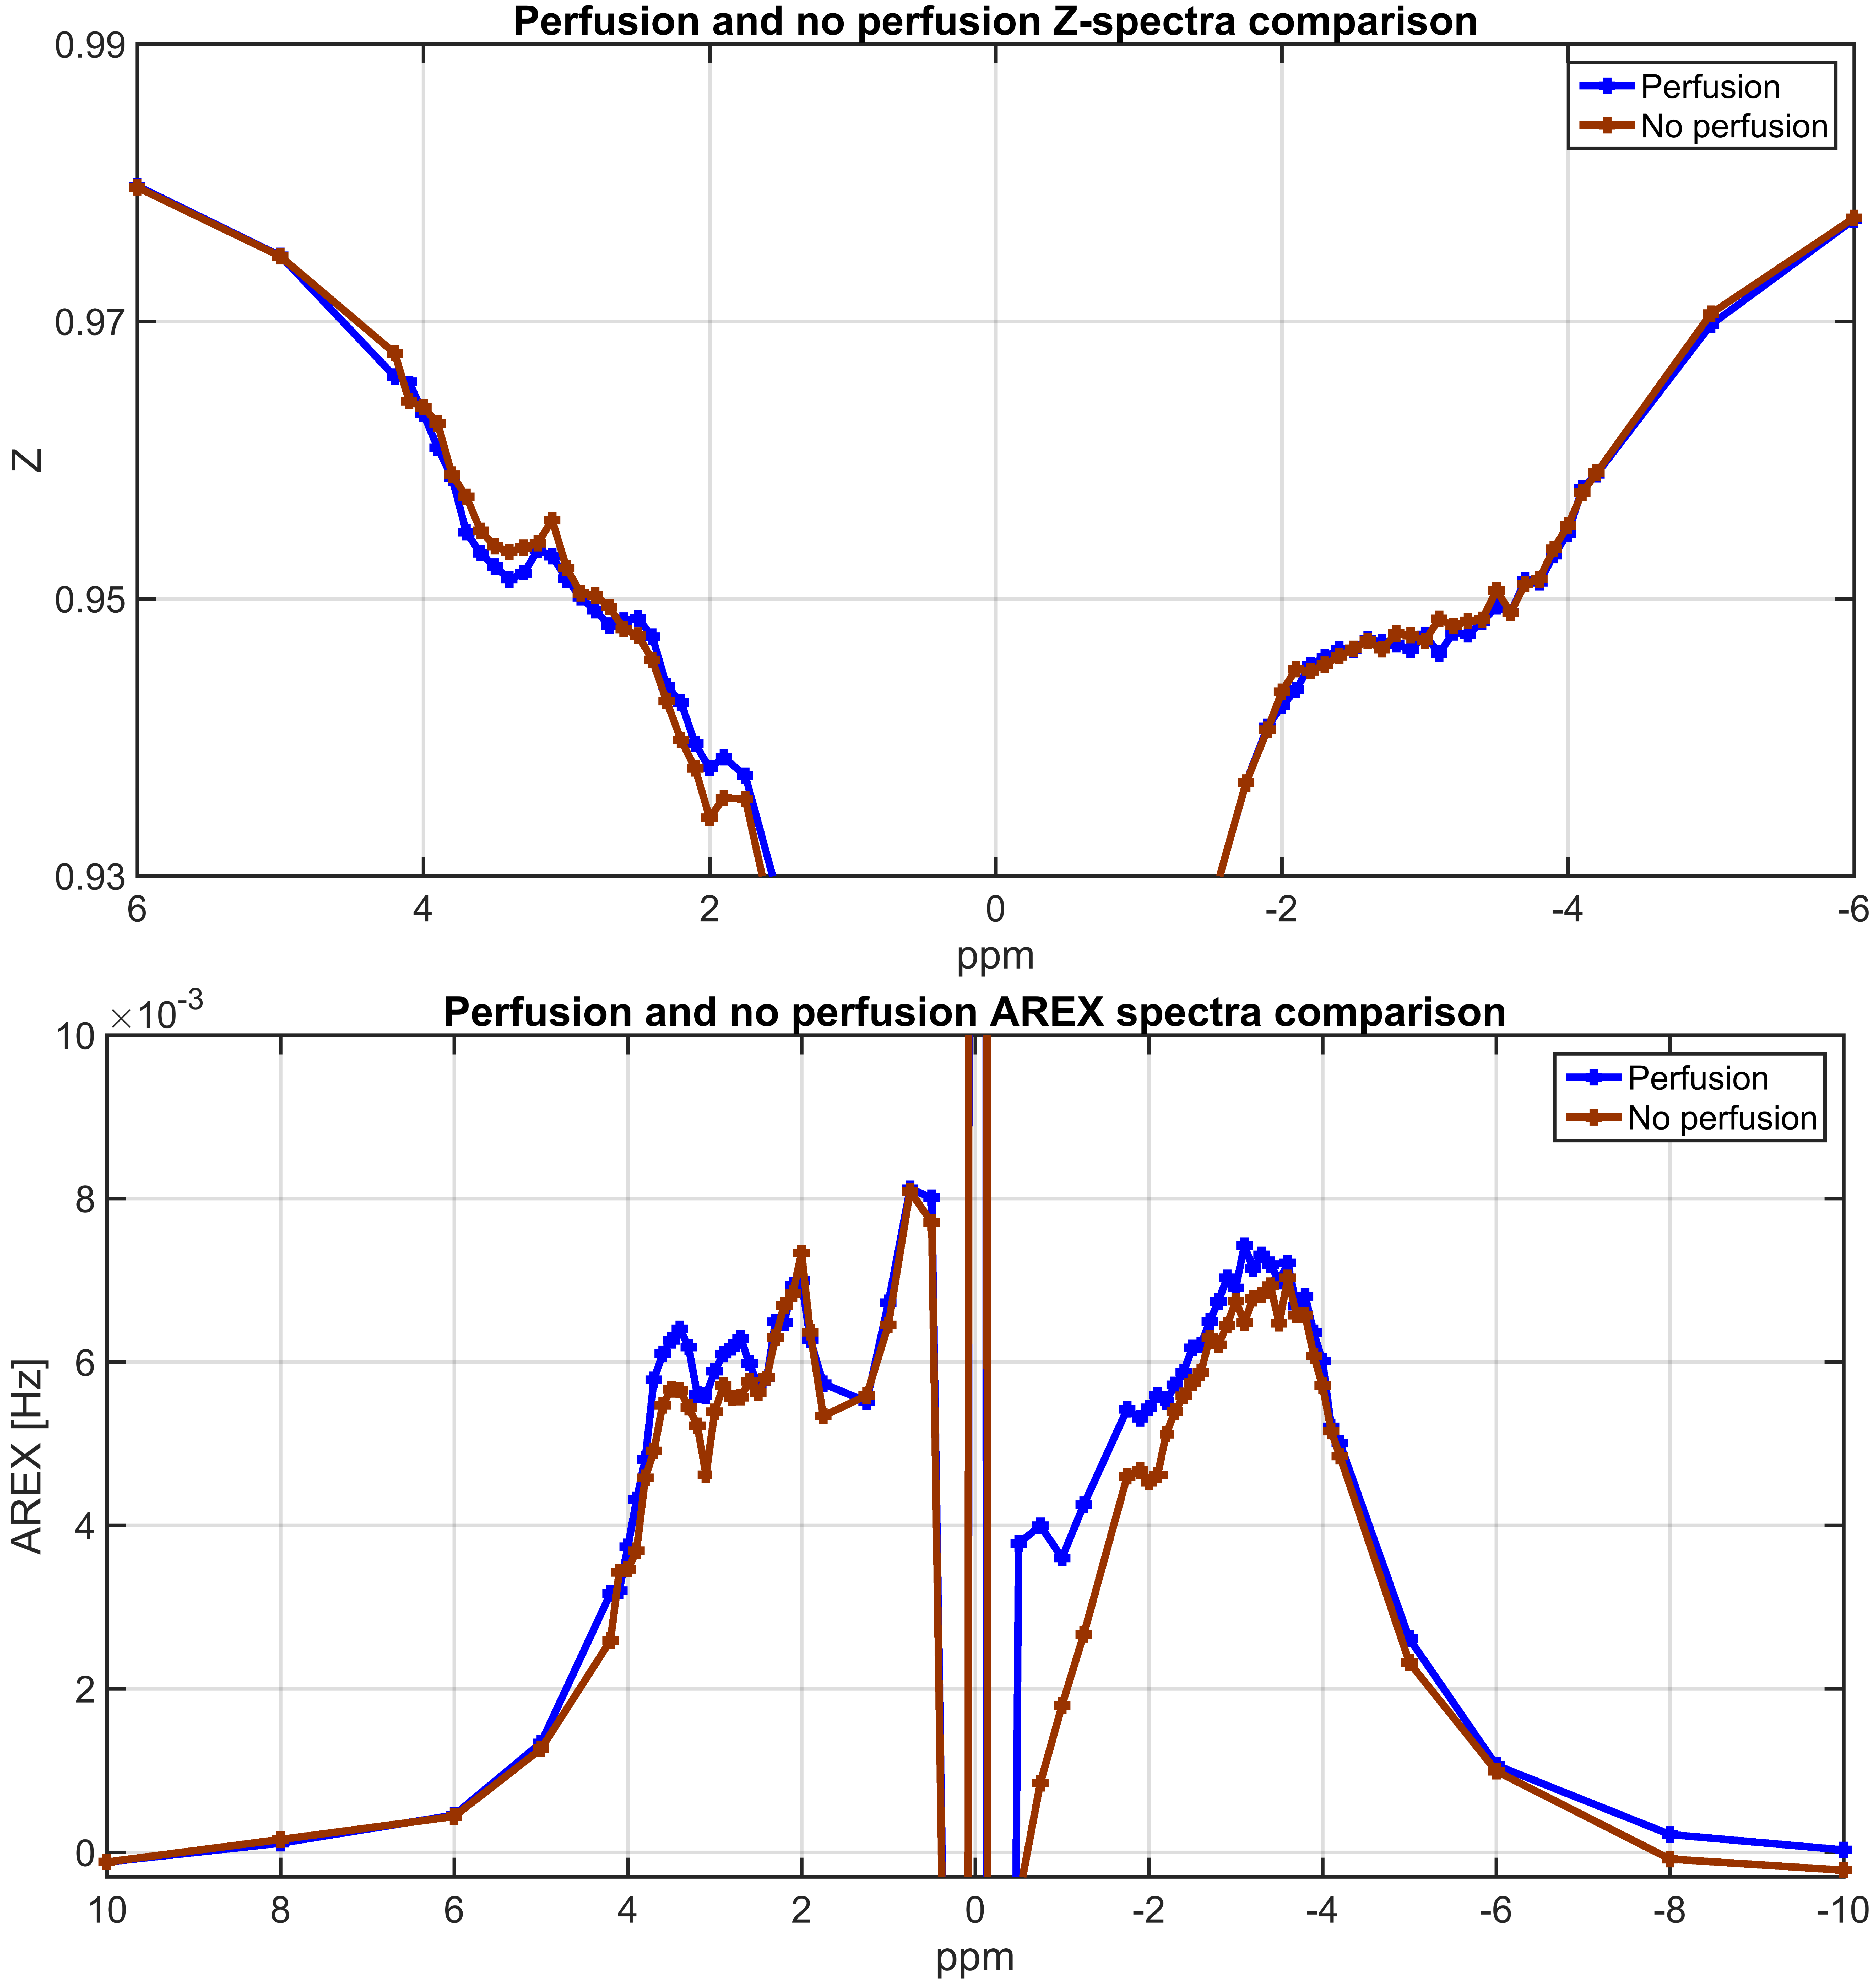
A 3D cell culture contained in a microcavity array (DYNARRAYS©) was actively perfused (400μl/min) under normoxic conditions at 37°C (Fig.2). The HepG2 cells (ATCC, HB-8065, Manassas, USA) were prepared according to4,6,7. To isolate CEST signals, the AREX metric8 (T1=(4165.2±19.3)ms) was calculated by Lorentzian fitting of direct water saturation (DS) and semi-solid magnetization transfer (ssMT)9. The influence of the perfusion on the CEST saturation pulse was investigated by comparing AREX and Z-spectra of perfused and non-perfused cells. Separate measurements of culture medium, of the collagenized microcavity array and of cells allowed for determining each contribution to the AREX/Z-spectrum.
Saturation curves (variation of B1+ to obtain each time the CEST pool amplitude) of a liquid phantom (PBS and 20mM NH4Cl, pH 5.30, 20°C, T1=(2885.0±5.0)ms) and a 2% agarose phantom (PBS and 19.3mM NH4Cl, pH 4.92, 20°C, T1=(2736.6±50.8)ms) were used to evaluate the influence of the bioreactor shim condition on the NH4Cl CEST amplitude. The saturation curves within the bioreactor (+ microcavity array) were compared to a falcon tube measurement (good shim condition). AREX spectra were calculated by Lorentzian fitting of DS and one CEST pool (liquid phantom). For the agar phantom, DS and the CEST pool were fitted by Lorentzian functions while a Gaussian function was used for ssMT10. The reduction in CEST signal was calculated by taking the mean ratio between the measurement of the falcon tube (good shim condition) and bioreactor.
Results:
There was only a slight difference between perfused and non-perfused AREX/Z-spectra (Fig.3). This allowed perfusion to be used during CEST measurements to supply the cells with nutrients and oxygen.
The culture medium and collagenized microcavity arrays also contributed to the AREX spectrum (Fig.4). A significant increase in CEST and rNOE signals was observed when cells were on the array. The contributions to the Z-spectra are comparable to in vivo-conditions11.
The plastic material (bioreactor and microcavity array) led to a sub-optimal shim condition (50% 10-20Hz, 10% 70-100Hz). Therefore, saturation curves (Fig.5) were measured to determine the influence on the CEST amplitude compared to a good shim condition (50% 3-10Hz, 10% 5-15Hz). The curves had a similar shape, but a reduction of the CEST amplitude was observed compared to the falcon tube:
- (87.8±3.6)% (bioreactor liquid)
- (85.7±2.4)% (bioreactor + microcavity array liquid)
- (83.9±2.8)% (bioreactor + microcavity array agarose).
Discussion:
The perfusion speed (roughly 0.02mm/s) was so slow that it had no effect on the saturation. The decreased amide-signal (3.6ppm) and increased guanidinium-signal (2ppm) during the perfusion-stop were mainly due to a decrease in pH (presence of cells).
The contributions of the culture medium are most likely caused by the fetal bovine serum and non-essential amino acids. In addition, there was collagen on the array so that the cells could attach to the microcavity array. But most CEST and rNOE signals originated from the cells.
The sub-optimal shim condition led to a reduction in the CEST signal. This can be explained by a broader DS. However, the same shape of the saturation curve was obtained.
Conclusion:
The MR-compatible bioreactor with the relatively high number of cells cultivated three-dimensionally in the microcavity array could be successfully used to derive cellular signals using the CEST technique. The control of physiological parameters in the bioreactor creates unique possibilities for future applications/approaches.Acknowledgements
No acknowledgement found.References
1 Zaiss M, et al., MR imaging of protein folding in vitro employing Nuclear-Overhauser-mediated saturation transfer. NMR Biomed, 2013;26:1815-1822.
2 Goerke S, et al., Signature of protein unfolding in chemical exchange saturation transfer imaging. NMR Biomed, 2015;28:906-913.
3 Zhou J, et al., Using the amide proton signals of intracellular proteins and peptides to detect pH effects in MRI. Nat Med, 2003;9:1085-1090.
4 Gottwald E, et al., Characterization of a Chip-Based Bioreactor for Three-Dimensional Cell Cultivation via Magnetic Resonance Imaging. Z Med Phys, 2013;23:102-110.
5 Insko E, et al., Mapping of the Radiofrequency Field. JMR, 1993;103:82-85.
6 Gottwald E, et al., A Chip-Based Platform for the In Vitro Generatio of Tissues in Three-Dimensional Organization. Lap Chip, 2007;7:777-785.
7 Altmann B, et al., The Three-Dimensional Cultivation of the Carcinoma Cell Line HepG2 in a Perfused Chip System Leads to more Differentiated Phenotype of the Cells Compared to Monolayer Culture. Biomed Mater, 2008;3:034120.
8 Zaiss M, et al., Chemical exchange saturation transfer (CEST) and MR Z-spectroscopy in vivo: a review of theoretical approaches and methods. Phys Med Biol, 2013;58:221-269.
9 Zaiss M, et al., Quantitative separation of CEST effect from magnetization transfer and spillover effects by Lorentzian-line-fit analysis of z-spectra. J Magn Reson, 2011;211:149-155.
10 Desmond K, et al., Understanding quantitative pulsed CEST in the presence of MT. MRM, 2011;67:979-990.
11 Zaiss M, et al., Relaxation-compensated CEST-MRI of the human brain at 7T: Unbiased insight into NOE and amide signal changes in human glioblastoma. NeuroImage, 2015;15:180-188.
Figures