3999
Measuring the water exchange rate for various pools in the z-spectrum of the human brain1University of Nottingham, Nottingham, United Kingdom, 2University Medical Center Utrecht, Utrecht, Netherlands
Synopsis
True quantification of MT, CEST and NOE pools is difficult to achieve, as the exchanging pool size and exchange rate cannot be readily separated. Here we use a Particle Swarm Optimisation algorithm to solve this problem, which we show to be capable of quantifying pool size, exchange rate, and apparent T2s of exchanging pools without the need for initial guesses. We apply this to z-spectra acquired in vivo from the human brain, and quantify the exchanging pools in grey and white matter.
Purpose
Water exchange rates can yield important physiological information as they are pH and temperature dependent1, and have for example been used in tumour grading2. Many attempts have been made to quantify exchange rates in CEST, but true quantification remains difficult. All current methods of measuring exchange rate make assumptions about the system. QUESP methods3 vary saturation power to separate pool size and exchange rate, and recently a Bayesian fitting method4 has been used to quantify Z-spectra, however both of these methods require prior knowledge, either to choose appropriate saturation powers, or suitable initial guesses for the Bayesian fit.Aim
To quantify the pool sizes, exchange rates, and apparent T2s
of exchanging pools present in the z-spectra acquired from human brain in grey
and white matter (GM & WM) using a Particle Swarm Optimisation algorithm.
Methods
5 subjects (4F, age=24±1) were scanned using a 7T Achieva system
with a NOVA 8ch pTx head coil. Z-spectra were acquired using Semi-CW saturation5,6
at 5 B1s (0.33,0.67,1.00,1.33,1.67μT) at 64 off-resonance
frequencies between ±100,000Hz (3s saturation, TFEPI readout, voxel
size=1x1x3mm) Acquisition of each spectrum took 10mins. B1 and B0
maps were also acquired.
Images were motion corrected and GM & WM were masked by segmentation of a high-resolution anatomical
image. Spectra were B0 corrected pixel-wise, and masks were used to determine
average GM and WM spectra and average B1 values.
Spectra were fitted using a Particle Swarm Optimisation
(PSO) algorithm based on the direct solutions of the Bloch-McConnell (BM) equations. After initial tests a 6
pool model was used: free water, MT, amides, amines, and 2 NOE pools at -3.5ppm
and -1.7ppm. The pool size, exchange rate, and apparent T2 of each
pool were fitted with the T1 and T2 of free water, and
the position of each peak could vary by 0.1ppm. The PSO initialises 2300
‘particles’ evenly spaced between defined bounds. These guesses simulate
spectra via the BM equations, at the five nominal B1 values scaled
by measured B1. The sum of squares difference between the simulated
and measured data is calculated, and particles are free to move and communicate
until the global minimum is found. The algorithm takes 10-60 minutes to run for
5 saturation powers and 64 off-resonance frequencies on a conventional PC.
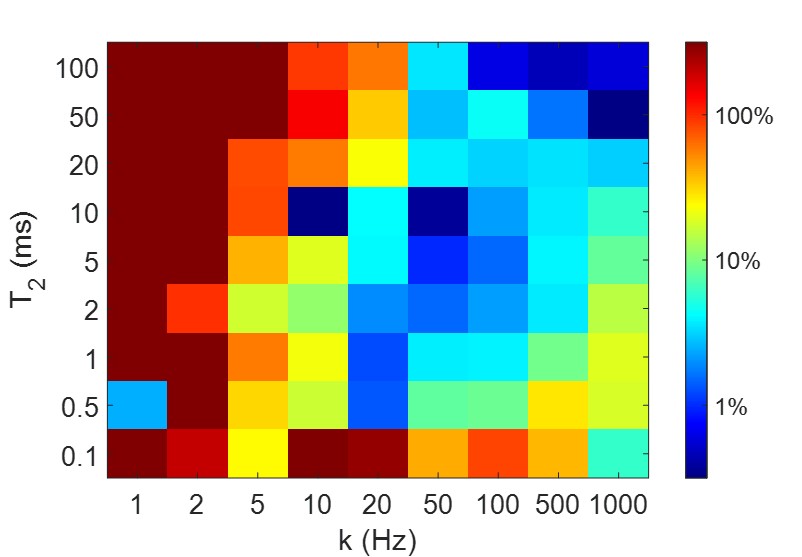
Error analysis was performed by simulating 6 pool spectra
for various T2s and exchange rates, then adding noise, fitting and
determining the variation in the resulting value.
Results
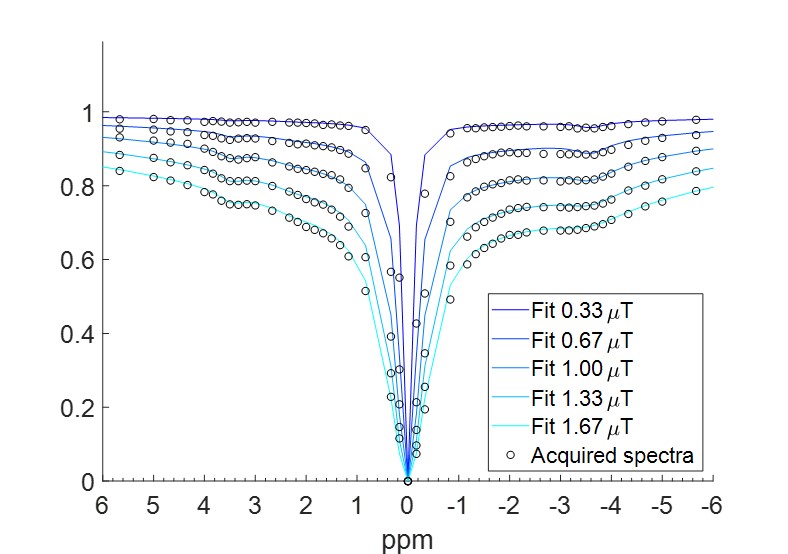
Figure 1 shows the PSO error analysis. Figure 2 shows an
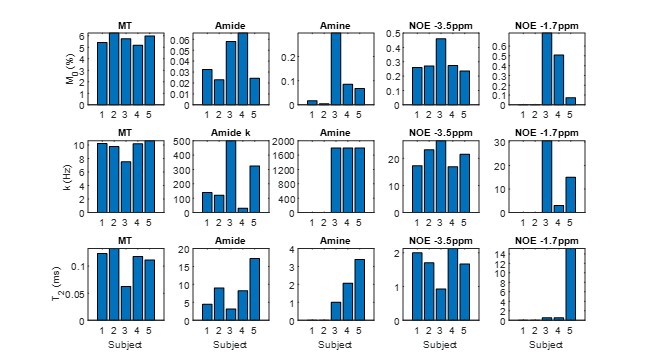
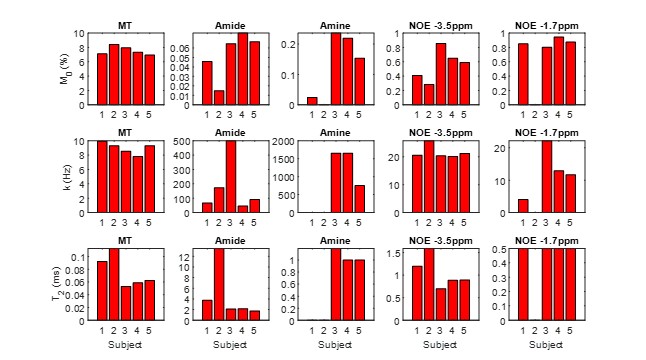
example of fitted data. Figures 3-4 shows the results of the PSO for GM and WM
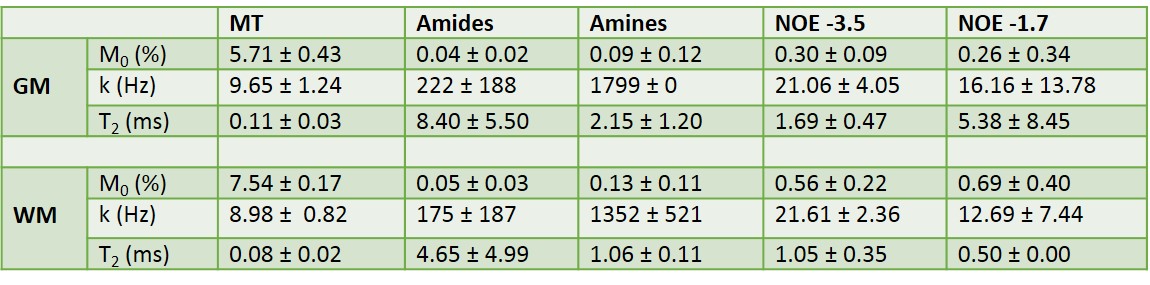
for each subject respectively. Table 1 shows the average values ± intersubject
standard deviation for each pool.
Discussion
From the error analysis we can see that the PSO fits to
within 10% apart from exchange rates <10Hz and extreme T2s. In
this region the peaks become wide and are hard to identify, as they blend into
the underlying spectrum. However CEST peaks typically have a faster exchange
rate and longer T2, which can be resolved.
Figure 2 illustrates that the 6 pool model is suitable for
fitting to GM and WM. Initial tests were performed with up to nine putative
pools, however the sizes of additional pools were always fitted to zero.
Resulting values are consistent across subjects,
particularly with MT pools in GM and WM. The results for k and T2 for amine and
NOE at -1.7ppm pools are less robust, as these pools are typically smaller and close
to the water peak, so that a small error in the acquisition can greatly alter
the results. The large variability in amide exchange rate might be explained by
multi-compartmental pools at +3.5ppm with different exchange rates; this would
also explain discrepancies in the exchange rate of this pool reported elsewhere7,8,9.
Total scan time was 50mins plus set up time but could be shortened once estimates
are available, allowing optimal powers and offsets to be selected for features
of interest.
Conclusion
In the human brain MT has an exchange rate of 8±2Hz, and NOE
at +3.5ppm has an exchange rate of 20±5Hz. The measured exchange rate of amides
varied between 30-500Hz, suggesting there are several overlapping pools
contributing to this signal. The exchange rate of the NOE pool at -1.7ppm
appears to be between 3-30Hz, however due to the nature of the pool, the PSO
struggles to fit it accurately, as for the amine pool. This work will inform
the design of future z-spectrum pulse sequences and also opens up the
possibility of measuring potentially valuable physical parameters in vivo.
Acknowledgements
Andrew Carradus holds a studentship from the Haydn Green FoundationReferences
1 Van Zijl, P. C., & Yadav, N. N. (2011). Chemical
exchange saturation transfer (CEST): what is in a name and what isn't?.
Magnetic resonance in medicine, 65(4), 927-948.
2 Xu, J., Zaiss, M., Zu, Z., Li, H., Xie, J., Gochberg, D.
F., ... & Gore, J. C. (2014). On the origins of chemical exchange
saturation transfer (CEST) contrast in tumors at 9.4 T. NMR in biomedicine,
27(4), 406-416.
3
McMahon, M. T., Gilad, A. A., Zhou, J., Sun, P. Z., Bulte, J. W., & van
Zijl, P. C. (2006). Quantifying exchange rates in chemical exchange saturation
transfer agents using the saturation time and saturation power dependencies of
the magnetization transfer effect on the magnetic resonance imaging signal
(QUEST and QUESP): pH calibration for poly‐L‐lysine and a starburst dendrimer. Magnetic
Resonance in Medicine: An Official Journal of the International Society for
Magnetic Resonance in Medicine, 55(4), 836-847.
4 Chappell, M. A., Donahue, M. J., Tee, Y. K., Khrapitchev,
A. A., Sibson, N. R., Jezzard, P., & Payne, S. J. (2013). Quantitative
Bayesian model‐based analysis of amide proton transfer MRI. Magnetic resonance
in medicine, 70(2), 556-567.
5 Hoogduin
H, Khlebnikov V, Keupp J, et al (2017) Semi continuous wave CEST with
alternating sets of 4 transmit channels at 7T. MAGMA 30:S1–S152.
6 Keupp J,
Baltes C, Harvey PR, Brink J van den (2011) Parallel RF Transmission based MRI
Technique for Highly Sensitive Detection of Amide Proton Transfer in the Human
Brain at 3T. Proc Intl Soc Mag Reson Med 19:710.
7 Zhou, Jinyuan, et al. "Using the amide proton signals
of intracellular proteins and peptides to detect pH effects in MRI."
Nature medicine 9.8 (2003): 1085.
8 Cai, K., Haris, M., Singh, A., Kogan, F., Greenberg, J. H.,
Hariharan, H., ... & Reddy, R. (2012). Magnetic resonance imaging of
glutamate. Nature medicine, 18(2), 302.
9 Wermter, F. C., Bock, C., & Dreher, W. (2015).
Investigating GluCEST and its specificity for pH mapping at low temperatures.
NMR in Biomedicine, 28(11), 1507-1517.
Figures