3995
Development of whole-brain 3D snapshot CEST MRI at 3T1High-field Magnetic Resonance Center, Max Planck Institute for Biological Cybernetics, Tuebingen, Germany, 2Department of Biomedical Magnetic Resonance, Eberhard-Karls University Tuebingen, Tuebingen, Germany
Synopsis
In its application Chemical exchange saturation transfer (CEST) suffers from the drawback of long acquisition times. To approach this issue we demonstrate the feasibility of a 3D gradient echo based CEST sequence for 3T that provides whole brain (WB) coverage without additional measurement time. In addition, the suggested post processing helps to improve the determination of the CEST effects from the WB data. CEST contrasts derived from the presented method are of equal quality as those of commonly used methods.
Introduction
Chemical Exchange Saturation Transfer (CEST) MRI as a spectroscopic imaging method yields various clinically relevant contrasts. CEST allows enhanced detection of molecules of low abundance such as proteins and peptides1,2, glutamate3, creatine4, as well as correlation with parameters such as protein conformation5,6 and pH7. However, CEST requires long acquisition time, especially if a large volume coverage is needed. We propose a CEST imaging protocol that enables 3D whole brain coverage with no additional scan time, employing a snapshot acquisition after each presaturation. This is exemplarily demonstrated for NOE and APT CEST, but is extendable for any CEST weighting of interest.Methods
All examinations were performed at a clinical human whole body MR system (3T Magnetom Prisma, SIEMENS Healthcare, Erlangen, Germany) using a 1Tx/64Rx-channel head/neck coil. Written informed consent was obtained from all volunteers before examination.
As shown previously, the maximum number of k-space lines in an optimized CEST measurement should not exceed ≈7008. This number was now aimed for when setting up a 3D gradient echo (GRE) sequence for single-shot whole brain (WB) coverage without selective excitation at each CEST frequency offset. To reduce the number of measured k-space lines, the resolution was adjusted to 2.3x2.3x2.3mm3 (5616 lines), GRAPPA acceleration of 3x2 in the two phase encoding directions was used; partial Fourier 6/8 (along both phase encoding directions) was set combined with omitting the k-space corners (reduction by 4/pi). This reduced the measured k-space lines to ≈575 (final readout protocol: TE: 1.3ms; TR: 3ms; 660Hz/px; FA: 5°; 96x78x72, base=96). A readout with slab excitation (SE) at same the resolution (GRAPPA phase: 2; TE=2ms; TR=4ms; 694Hz/pix; FA=6°; 96x78x14, base=96) with ≈430 k-space lines was set up for comparison9.
The same CEST saturation for spectrally selective amide- and NOE-CEST effects (80 Gaussian pulses tP=20ms; B1 = 0.6µT; DC = 50 %)2 was applied in both sequences. Z-spectra were acquired at 55 offsets between ±100 ppm with denser sampling in the center (additionally a fully relaxed M0). For the WB sequence fat saturation was included. Repeated WB measurements at two different B1 values allowed to correct for B1 effects as suggested in 10,11.
All data was coregistered (AFNI12) before evaluation. Temporal SNR (tSNR) was determined from repeated single offset measurements. The CEST spectra were denoised using a PCA approach13. After denoising a two-step fitting, as described in 9, was applied to obtain selective CEST effects. Final maps were smoothed and interpolated to two times the nominal resolution.
Results
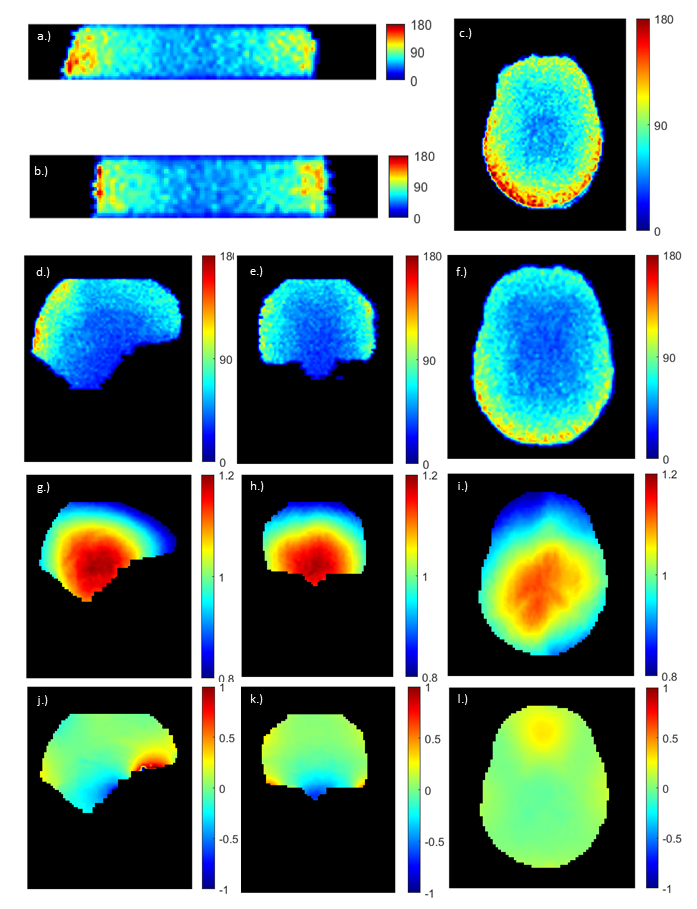
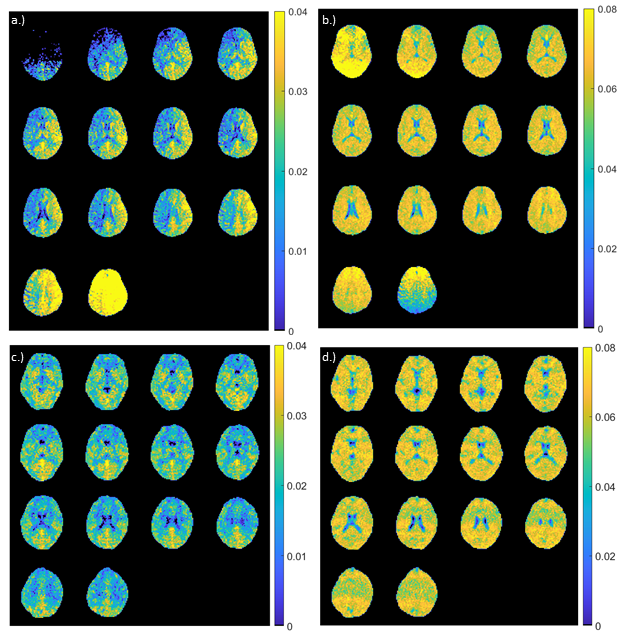
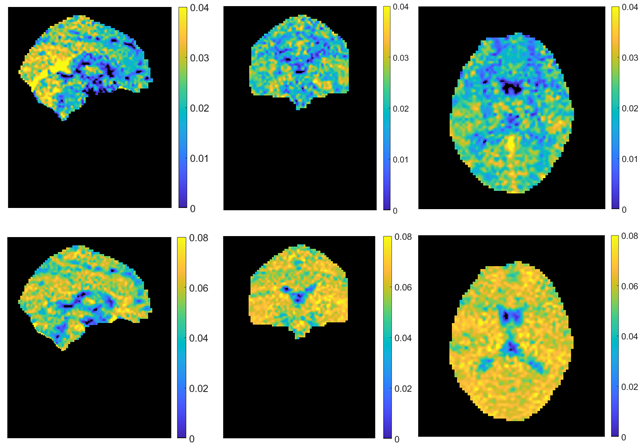
The tSNR maps (figure 1a-f) reveal that the WB sequence (mean ± std.: 64 ± 3) yields about 15 % less tSNR than the SE sequence (75 ± 13) but is more stable across different axial slices. Given the high acceleration factor of ≈8.7 this is still a remarkably high tSNR, and sufficient for CEST peak detection. No major correlation between tSNR and B0 and B1 deviation was detectable.
Figure 2 shows the main result: fitted amplitudes of NOE and APT CEST effects in the WB data show similar contrast as the established SE method. In the SE method, variations due to imperfect SE and motion can be observed, which are not visible in the WB method. Fit results of the WB data show only minor potential artefacts in the APT maps. The measurement time for 56 offsets at a single B1 was comparable for both sequences: 303s (SE) and 283s (WB).
Discussion
We could show feasibility of a WB GRE-based snapshot CEST readout employing only conventional acceleration methods. With an acquisition time of 5s per offset for a given B1, this sequence forms one of the fastest approaches with whole brain coverage at 3T with still a comparable resolution yet lower SNR14. This paves the way for more sophisticated approaches based on the relatively robust GRE readout such as compressed sensing or multi-shot readouts with higher resolution. The most similar approach to compare with in the future is the recently developed snapshot 3D-EPI approach of Akbey et al.15. A benefit of the WB sequence is the non-selective excitation that overcomes complicated motion artifacts of the slab selective approach, as visible in figure 2a and b. The origin of the observed artefacts in the ATP maps of WB data are under further investigation.Conclusion
The presented 3D GRE WB sequence allows CEST measurements of the whole brain with no additional measurement time. Following the suggested post-processing, the CEST contrasts are well preserved.Acknowledgements
The financial support of the Max Planck Society, German Research Foundation (DFG, grant ZA 814/2-1), and European Union’s Horizon 2020 research and innovation programme (Grant Agreement No. 667510) is gratefully acknowledged.References
1. Zhou, J., Payen, J.-F., Wilson, D. A., Traystman, R. J. & Zijl, P. C. M. van. Using the amide proton signals of intracellular proteins and peptides to detect pH effects in MRI. Nature Medicine 9, 1085–1090 (2003).
2. Zhou, J., Lal, B., Wilson, D. A., Laterra, J. & van Zijl, P. C. M. Amide proton transfer (APT) contrast for imaging of brain tumors. Magn. Reson. Med. 50, 1120–1126 (2003).
3. Cai, K. et al. Magnetic resonance imaging of glutamate. Nature Medicine 18, 302–306 (2012).
4. Cai, K. et al. Creatine CEST MRI for Differentiating Gliomas with Different Degrees of Aggressiveness. Mol Imaging Biol 19, 225–232 (2017).
5. Zaiss, M., Kunz, P., Goerke, S., Radbruch, A. & Bachert, P. MR imaging of protein folding in vitro employing nuclear-Overhauser-mediated saturation transfer. NMR Biomed 26, 1815–1822 (2013).
6. Goerke, S. et al. Aggregation-induced changes in the chemical exchange saturation transfer (CEST) signals of proteins. NMR Biomed 30, 1099–1492 (2017).
7. Harris, R. J. et al. pH-weighted molecular imaging of gliomas using amine chemical exchange saturation transfer MRI. Neuro Oncol 17, 1514–1524 (2015).
8. Zaiss M, Ehses P, Scheffler K. Snapshot-CEST: Optimizing spiral-centric-reordered gradient echo acquisition for fast and robust 3D CEST MRI at 9.4 T. NMR Biomed. 2018;31(4):e3879.
9. Deshmane et al. 3D gradient echo snapshot chemical exchange saturation transfer MRI with low power saturation for clinical studies at 3T. Magn. Reson. Med. in press.
10. Windschuh, J. et al. Correction of B1-inhomogeneities for relaxation-compensated CEST imaging at 7 T. NMR in biomedicine 28, 529–537 (2015).
11. Tse, D. H. Y., da Silva, N. A., Poser, B. A. & Shah, N. J. B1+ inhomogeneity mitigation in CEST using parallel transmission. Magn. Reson. Med. 78, 2216–2225 (2017).
12. Cox RW. AFNI: software for analysis and visualization of functional magnetic resonance neuroimages. Comput Biomed Res. 29(3), 162-173 (1996).
13. Breitling et al. Denoising of Z-spectra for reliable CEST MRI using principal component analysis. ISMRM 2019, submitted.
14. Togao et al. Amide proton transfer imaging of brain tumors using a self-corrected 3D fast spin-echo dixon method: Comparison With separate B0 correction. Magn. Reson. Med. 77, 2272-2279 (2017).
15. Akbey, S., Ehses, P., Stirnberg, R., Zaiss, M. & Stöcker, T. Single-shot whole-brain CEST imaging using centric-reordered 3D-EPI. in Proceeding of 26th annual meeting of ISMRM 2018 (2018).
16. Schuenke et al. Simultaneous mapping of water shift and B1 (WASABI)-Application to field-Inhomogeneity correction of CEST MRI data. Magn. Reson. Med. 77(2), 571-580 (2017).
Figures