3994
Data-Driven Spectral Feature Extraction in 9.4T CEST MRI data of the human brainMark Schuppert1, Anagha Deshmane1, Kai Herz1, Klaus Scheffler1, and Moritz Zaiss1
1High-field magnetic resonance center, Max Planck Institute for biological cybernetics, Tübingen, Germany
Synopsis
Model-based extraction of features, e.g. Lorentzian fitting of Z-spectra, in CEST MRI can be limited by the underlying model assumptions. Here we analyzed high spectral resolution Z-spectra acquired at 9.4T in five healthy subjects and one tumor patient using principal component analysis, a purely data-driven statistical procedure. Projection of Z-spectra onto principle components from a group of healthy subjects provides several relevant contrasts which reveal anatomical detail and correlate with Gadolinium uptake signatures in a brain tumor patient.
Purpose
Ultra-high field strengths (UHF) improve the intrinsic MRI signal in the human brain generated during chemical exchange saturation transfer (CEST). With high spectral resolution CEST measurements at 9.4T, we recently showed that known and novel CEST contrasts could be reproducibly extracted by applying multi-Lorentzian fitting of the Z-spectrum [1]. Model-based methods, such as Lorentzian fitting, are able to extract distinct features of the Z-spectrum but are limited by underlying assumptions of the model. In this work we show preliminary results of a data-driven approach of spectral feature detection in densely sampled Z-spectra acquired at 9.4 T. Meaningful components could be identified by their CEST contrast generation in healthy tissue and in tumor areas.Methods and Materials
3D-snapshot-CEST imaging [2] was performed on a 9.4T whole-body MRI scanner (MAGNETOM, Siemens, Erlangen, Germany) in five healthy volunteers and one brain tumor patient after written informed consent. Z-spectra were acquired at three different nominal B1-values = 1.2µT, 0.9µT, and 0.6µT (lowest B1 omitted during patient MRI due to limited scan time). All Z-spectra (95 irradiation frequency offsets, 150 Gaussian-shaped RF pulses, 15ms pulse duration, 15ms pulse delay, 4.5sec saturation time) were corrected for motion, B0 [3], and B1 [4]. For further data analysis, the corrected Z-spectra of the five healthy volunteers were concatenated and the mean Z-spectrum was removed from this dataset. For the detection of common spectral features, principal component analysis (PCA) was applied. Voxel Z-spectra from each volunteer were subsequently projected onto the calculated principle components (PCs) to identify spatial correlations. To find unique spectral features related to pathology, the tumor patients’ Z-spectra were projected onto the PCs previously determined from Z-spectra of healthy subjects. We compared this data-driven approach with the established multi-Lorentzian fitting approach.Results
In Fig. 1a the first six principal components are exemplarily shown. With the exception of PC 1 (coarsely correlated to the baseline of the Z-spectrum), most PCs reveal complex structure. It is interesting to note that in PCs 3 to 5, strong contributions in the NOE frequency range (around -3.5ppm) are observed. Simultaneously, contributions in the APT frequency range (around +3.5ppm) of PCs 2 and 5 are observed; the other PCs show almost no contribution here. Fig. 1b shows the corresponding coefficient maps from the projection of voxel Z-spectra onto the PCs shown above. The first five coefficient maps exhibit distinct contrast between grey and white matter. Similarity to amplitude maps of the Lorentzian fitting approach (Fig. 1c) is noticeable. All calculated PCs reveal interesting spectral features. A selection of the first 18 coefficient maps in a representative healthy volunteer is displayed in Fig. 2, depicting the vast amount of different contrasts that can be obtained by such feature extraction. Interestingly these features also show alteration in tumor areas as shown in Fig. 3 and Fig. 4. While the detailed analysis of all 18 maps is ongoing, in Fig. 4, four selected coefficient maps (top row), clinical contrasts at 3T, and the measured B1 map at 9.4T (bottom row) of the same patient are shown. The calculated coefficient maps roughly correlate to the clinical contrasts. The projection of the Z-spectra onto PC 9 reveals hyper-intensities in the tumor area, which strongly correlate to regions of strongest gadolinium uptake in the T1ce image. The coefficient map of PC 6 strongly correlates to the measured B1 map.Discussion
PCA is a statistical procedure to extract features, here spectral features of Z-spectra, from large high-dimensional datasets. Given the high spatial (120x140x16 pixels) and spectral resolution (95 irradiation frequency offsets) of the 3D snapshot-CEST in association with UHF, concatenated datasets consisting of ~370.000 Z-spectra in total were available for statistical analysis. In combination with low-power saturation, the resulting Z-spectra are feature-rich with isolated effects at several resonances. The calculated PCs reveal combinations of features at various irradiation frequency offsets which differentiate Z-spectra in each tissue type relative to the mean Z-spectrum. This approach is orders of magnitudes faster than Lorentzian fitting and extracts a multitude of additional spectral features which we might be able to interpret, especially when discerning healthy tissues from pathologies.Conclusion
Data-driven feature analysis circumvents underlying assumptions in model-based approaches and is, thus, favorable. Principal component analysis is one such data-driven approach. The decomposition of Z-spectra into principal components and the subsequent projection onto those principal components facilitates understanding of contributions from combinations of resonances, rather than single resonances as provided by Lorentzian fitting. Our preliminary findings suggest that complementary and new features of Z-spectra correlated to normal and diseased tissues can be found with PCA, forming the foundation for more sophisticated machine learning approaches.Acknowledgements
Max Planck Society; German Research Foundation (DFG, grant ZA 814/2-1, support to MS,KH); European Union Horizon 2020 research and innovation programme (Grant Agreement No. 667510, support to MZ, AD).References
[1] Zaiss et al., Neuroimage (2018) 179:144-155
[2] Zaiss et al., NMB (2018) 31:e3879
[3] Schuenke et al., MRM (2017) 77(2):571-580
[4] Windschuh et al., NBM (2015) 28(5):529-37
Figures
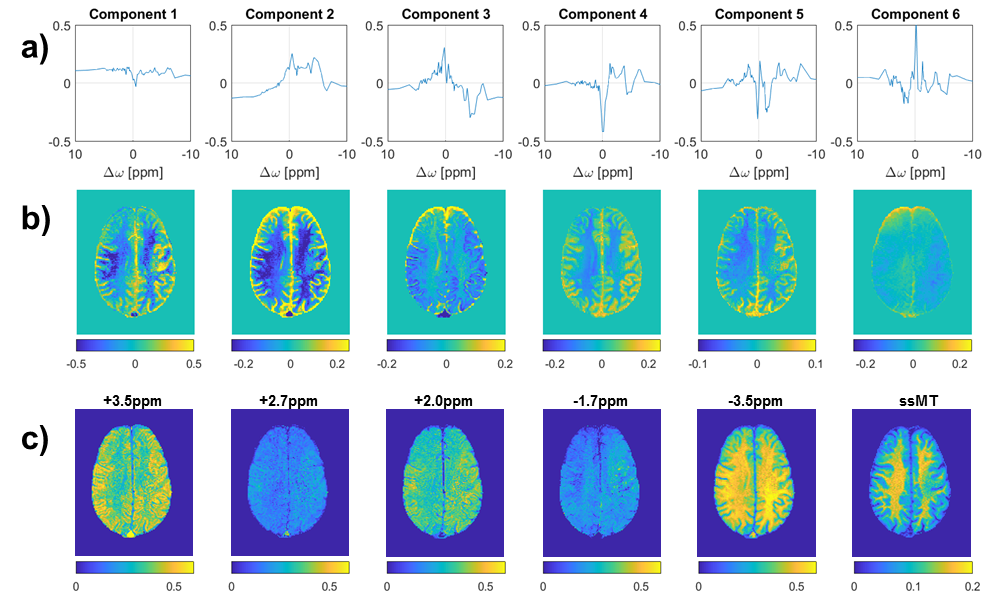
Fig. 1 a) First six principle components computed
across five healthy subjects. b)
Coefficient maps from projecting Z-spectra onto these principal components
reveal anatomically relevant correlations. c) Amplitude maps of a Lorentzian fitting approach.
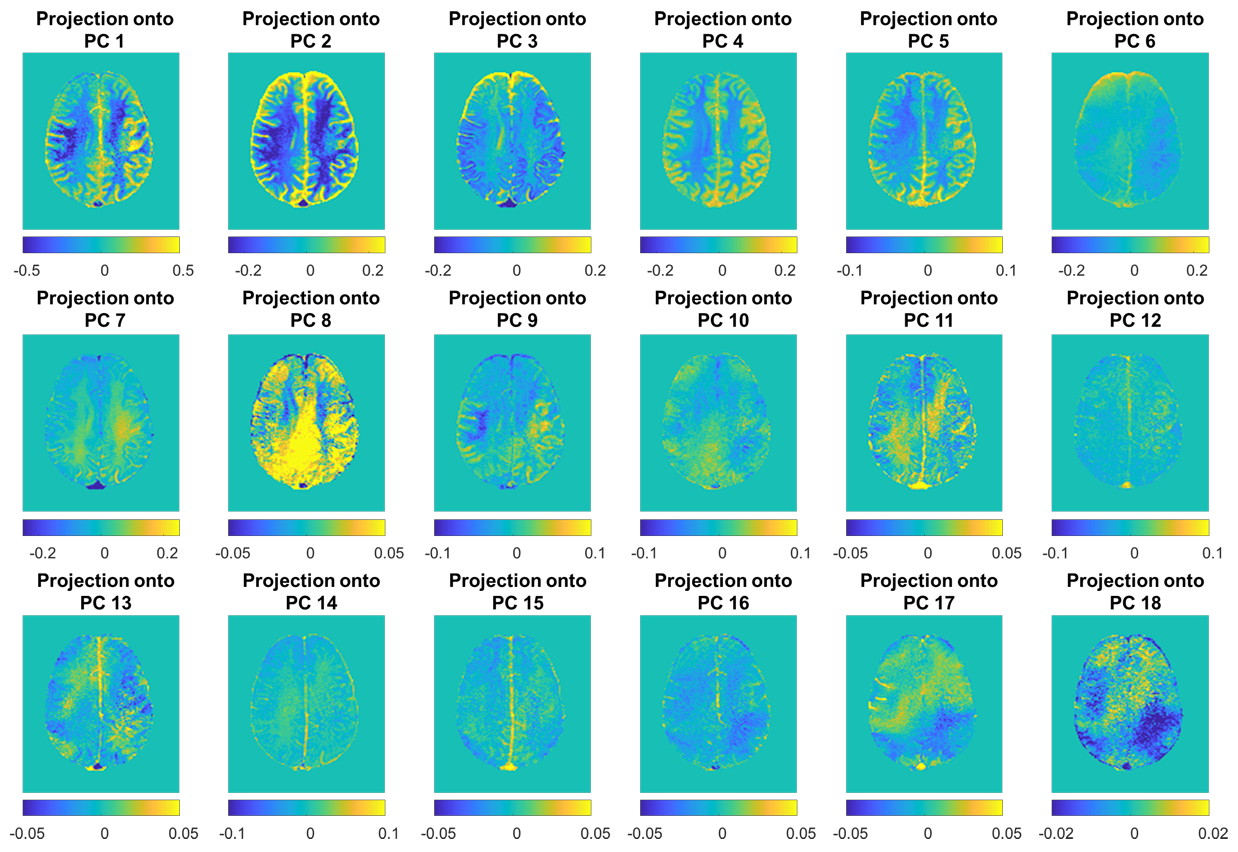
Fig. 2 First 18 coefficient maps reveal anatomically relevant
contrast features and correlations to known CEST contrasts in healthy subjects.
Residual inhomogeneities of the B0 and B1 fields are as well visible.
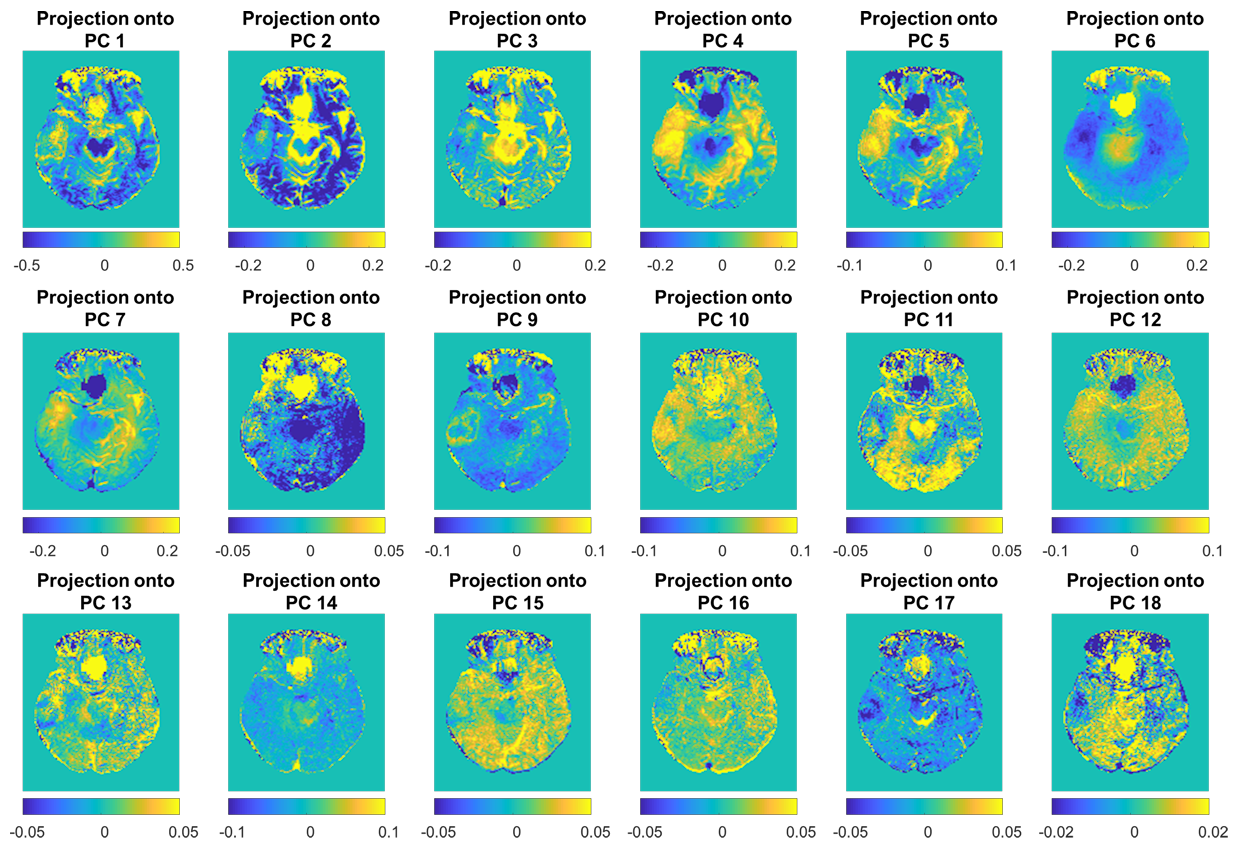
Fig. 3 First 18 coefficient maps in a tumor patient.
Anatomically relevant contrast features and correlations to known CEST
contrasts remain valid. Tumor tissue is differentiable as hypo- or
hyper-intense in comparison to healthy tissue. PC 9 shows interesting outline of the tumor ring
enhancement (see figure 4).
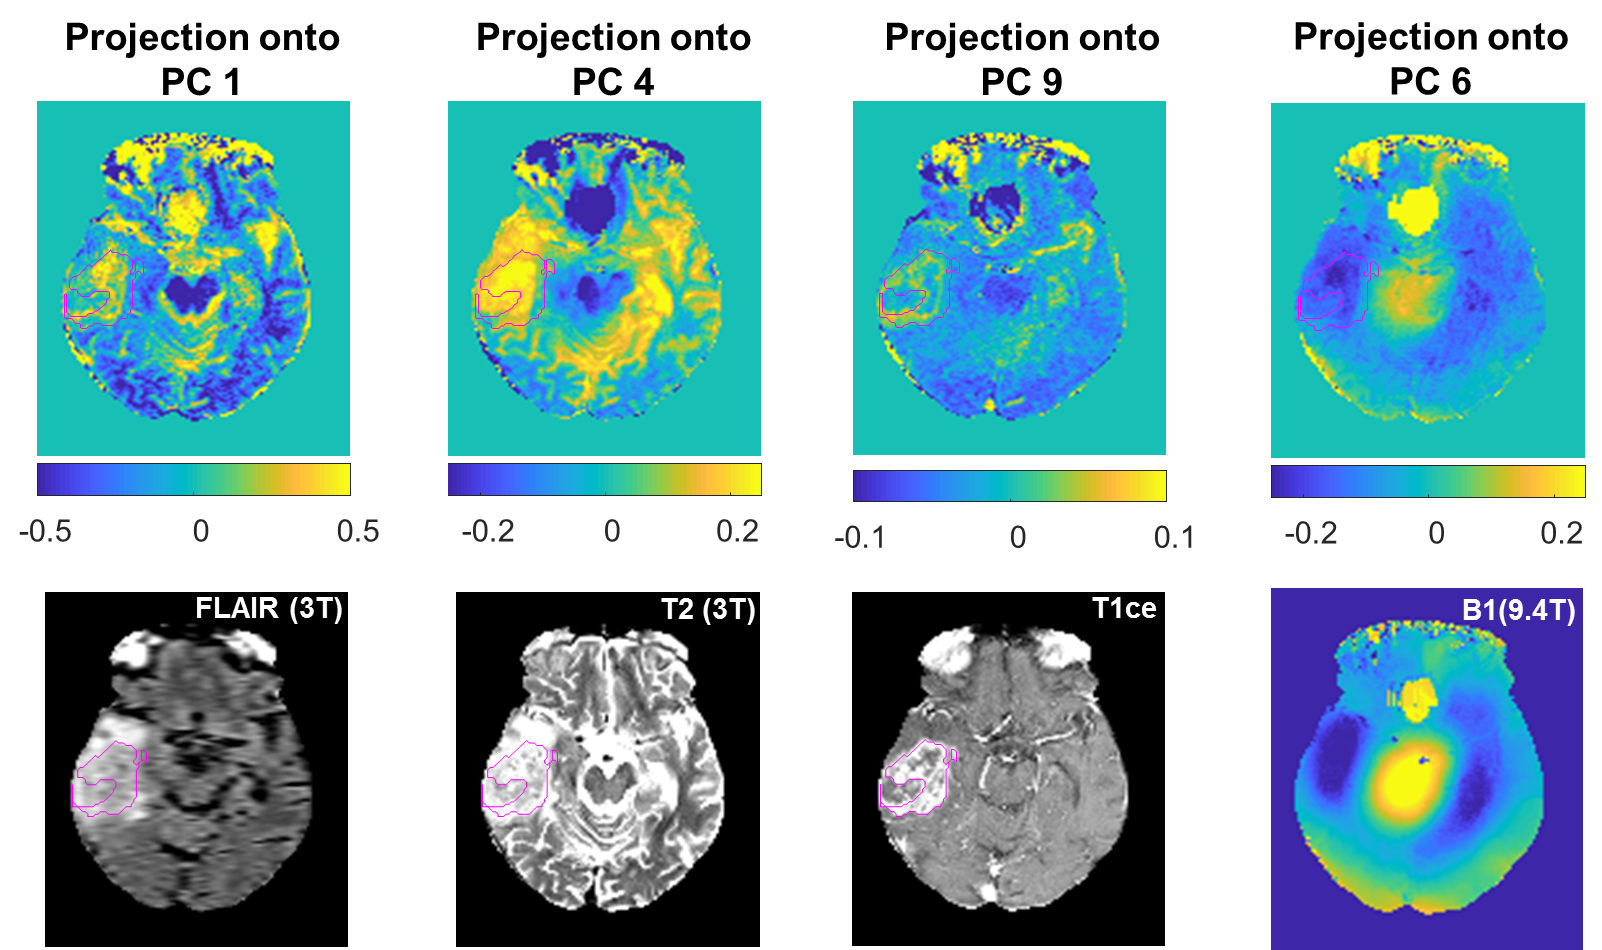
Fig. 4 Selected coefficient maps resembling clinical
contrasts at 3T and B1 inhomogeneities at UHF. The tumor area
is outlined (pink).