3993
GagCEST of human intervertebral lumbar discs compared to 23Na MRI at 7 Tesla1High Field MR Centre, Department of Biomedical Imaging and Image-guided Therapy, Medical University of Vienna, Vienna, Austria, 2Clinical Division for Endocrinology and Metabolism, Department of Medicine III, Medical University of Vienna, Vienna, Austria, 3CD Laboratory for Clinical Molecular MR Imaging, Vienna, Austria
Synopsis
Six healthy volunteers were measured to assess the feasibility and differences of 23Na-MRI and gagCEST in human intervertebral lumbar discs at 7T. MTRasym values from GagCEST data have shown to have similar potential as normalized 23Na-MRI, but were acquired in half the time and without the need for special hardware.
Introduction
Chemical Exchange Saturation Transfer (CEST) is capable to map small amounts of contrast agents or endogenous metabolites such as glycosaminoglycans (GAG). In gagCEST, saturated protons from the hydroxyl (-OH) group, with slightly different resonant frequency, are transferred to the water pool. This technique could potentially replace sodium imaging (23Na-MRI) that was previously used to GAG content in human cartilage1, with the advantage of using commercially more available hardware. In this study we compare gagCEST and 23Na-MRI in human intervertebral discs.Material and Methods
After giving written and oral consent, six volunteers (3f/3m, 30+/-5yo) had been measured using 7T-MRI (Magnetom, Siemens Healthineers, Erlangen, Germany) with a 32-channel 1H-tuned body coil (MRI.TOOLS, Berlin, Germany) and a 6-channel 23Na-tuned surface spine coil (QED, Mayfield Village, Ohio).
A 3D gradient echo sequence with variable echo time train (vTE-GRE) optimized for 23Na signal was acquired with the following parameters: resolution 2.5⨯2.5⨯8.0mm3, 14 averages, TR/TE 130/0.72ms at the center of the k-space, pulse bandwidth 120Hz/Px, FA 90°, acquisition time of 21 min. For B1 field correction in 23Na-MRI, a homogeneous torso phantom (1% agar and 0.9% NaCl) measurements were used.
GagCEST was acquired using 2D sequence with following parameters: resolution 1.3⨯1.3⨯8.0mm3, 2 averages, TR/TE 4.1/2.0ms, pause 8s, FA 5°, 48 offsets from -2.5 to 2.5ppm, B1 2.0μT, 25 pulses, pulse duration and interpulse delay 100ms and measurement time 11min.
23Na images were corrected and normalized according to Gruber et al2. Z-spectra were corrected for B0 and asymmetric magnetic transfer ratio (MTRasym) was calculated pixel wise. Image processing and ROI positioning in the discs, was done using an in-house script written in MATLAB (Mathworks Inc, Natick, MA). Statistical analysis was performed in RStudio (RStudio, Boston, MA).
Results
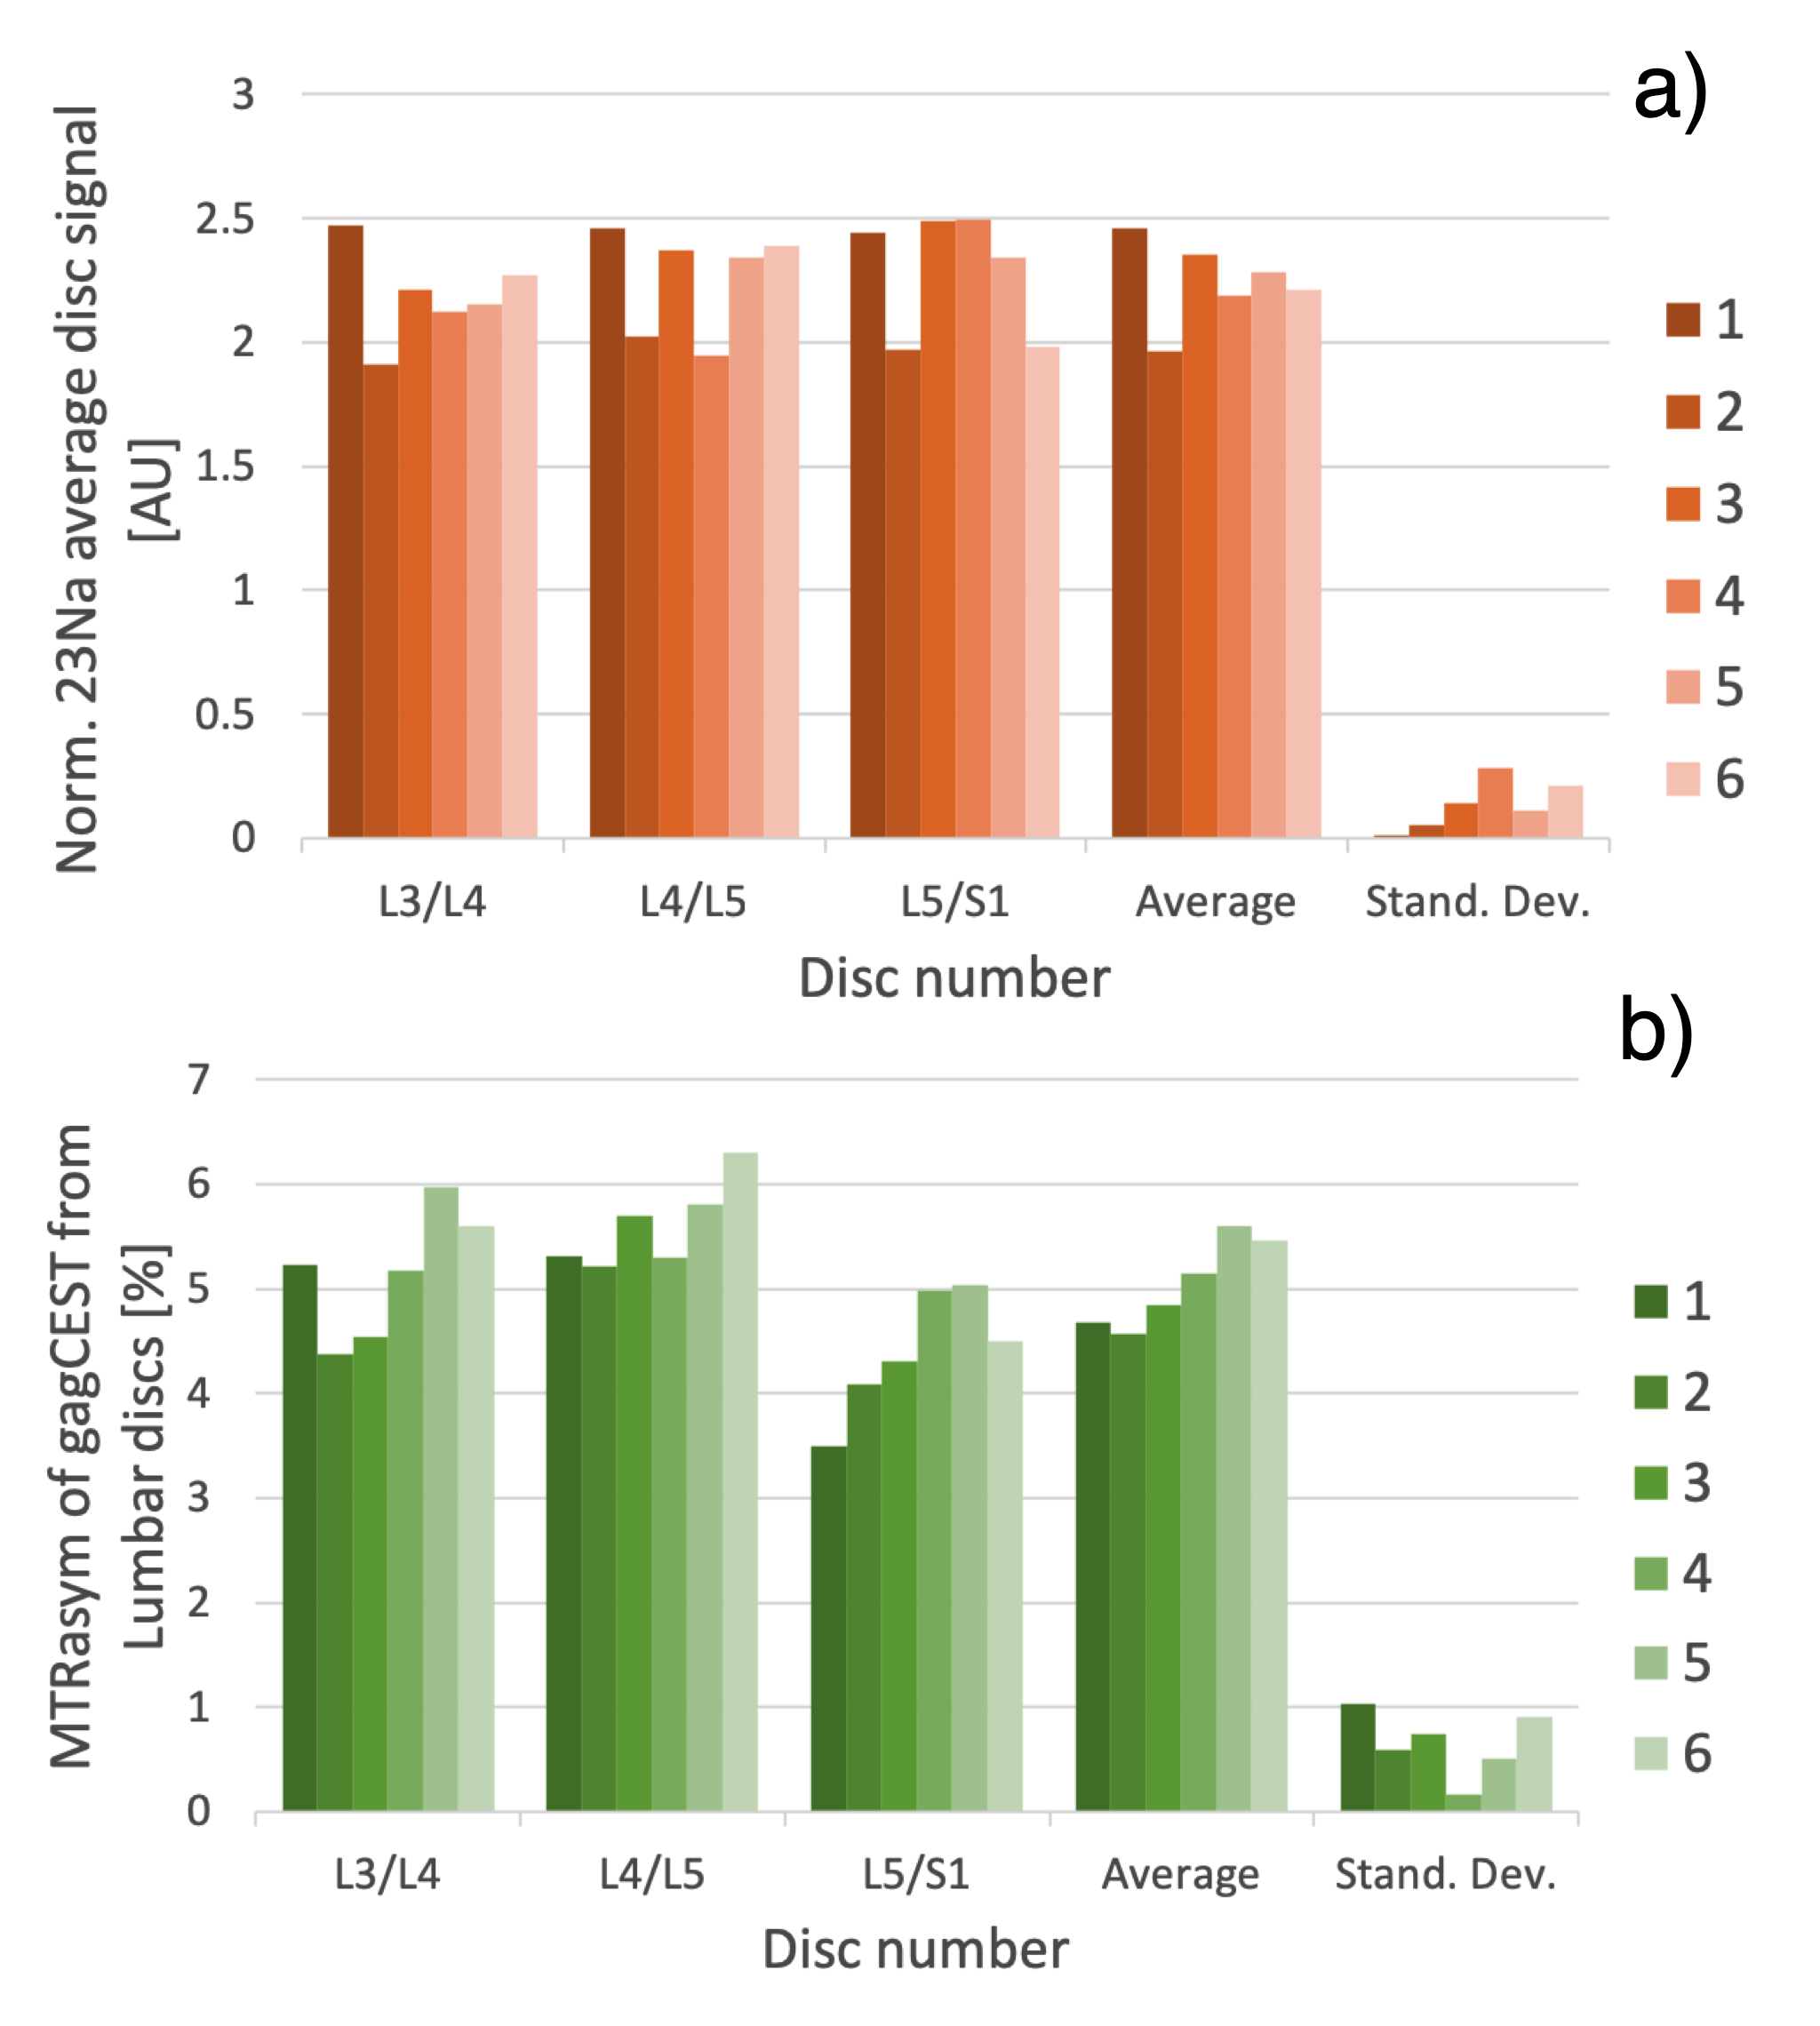
Examples of sagital 23Na-MRI and MTRasym map from the same volunteer (num. 5) are displayed on the Figure 1. The average values calculated from ROIs drawn on 23Na-MRI and MTRasym maps from the discs (L3/L4 – L5/S1) of all volunteers, can be seen on Figure 2, along with the average values and standard deviations for each volunteer. The values from the L1/L2 and L2/L3 discs were excluded from the analysis due to noisy Z-spectra data.
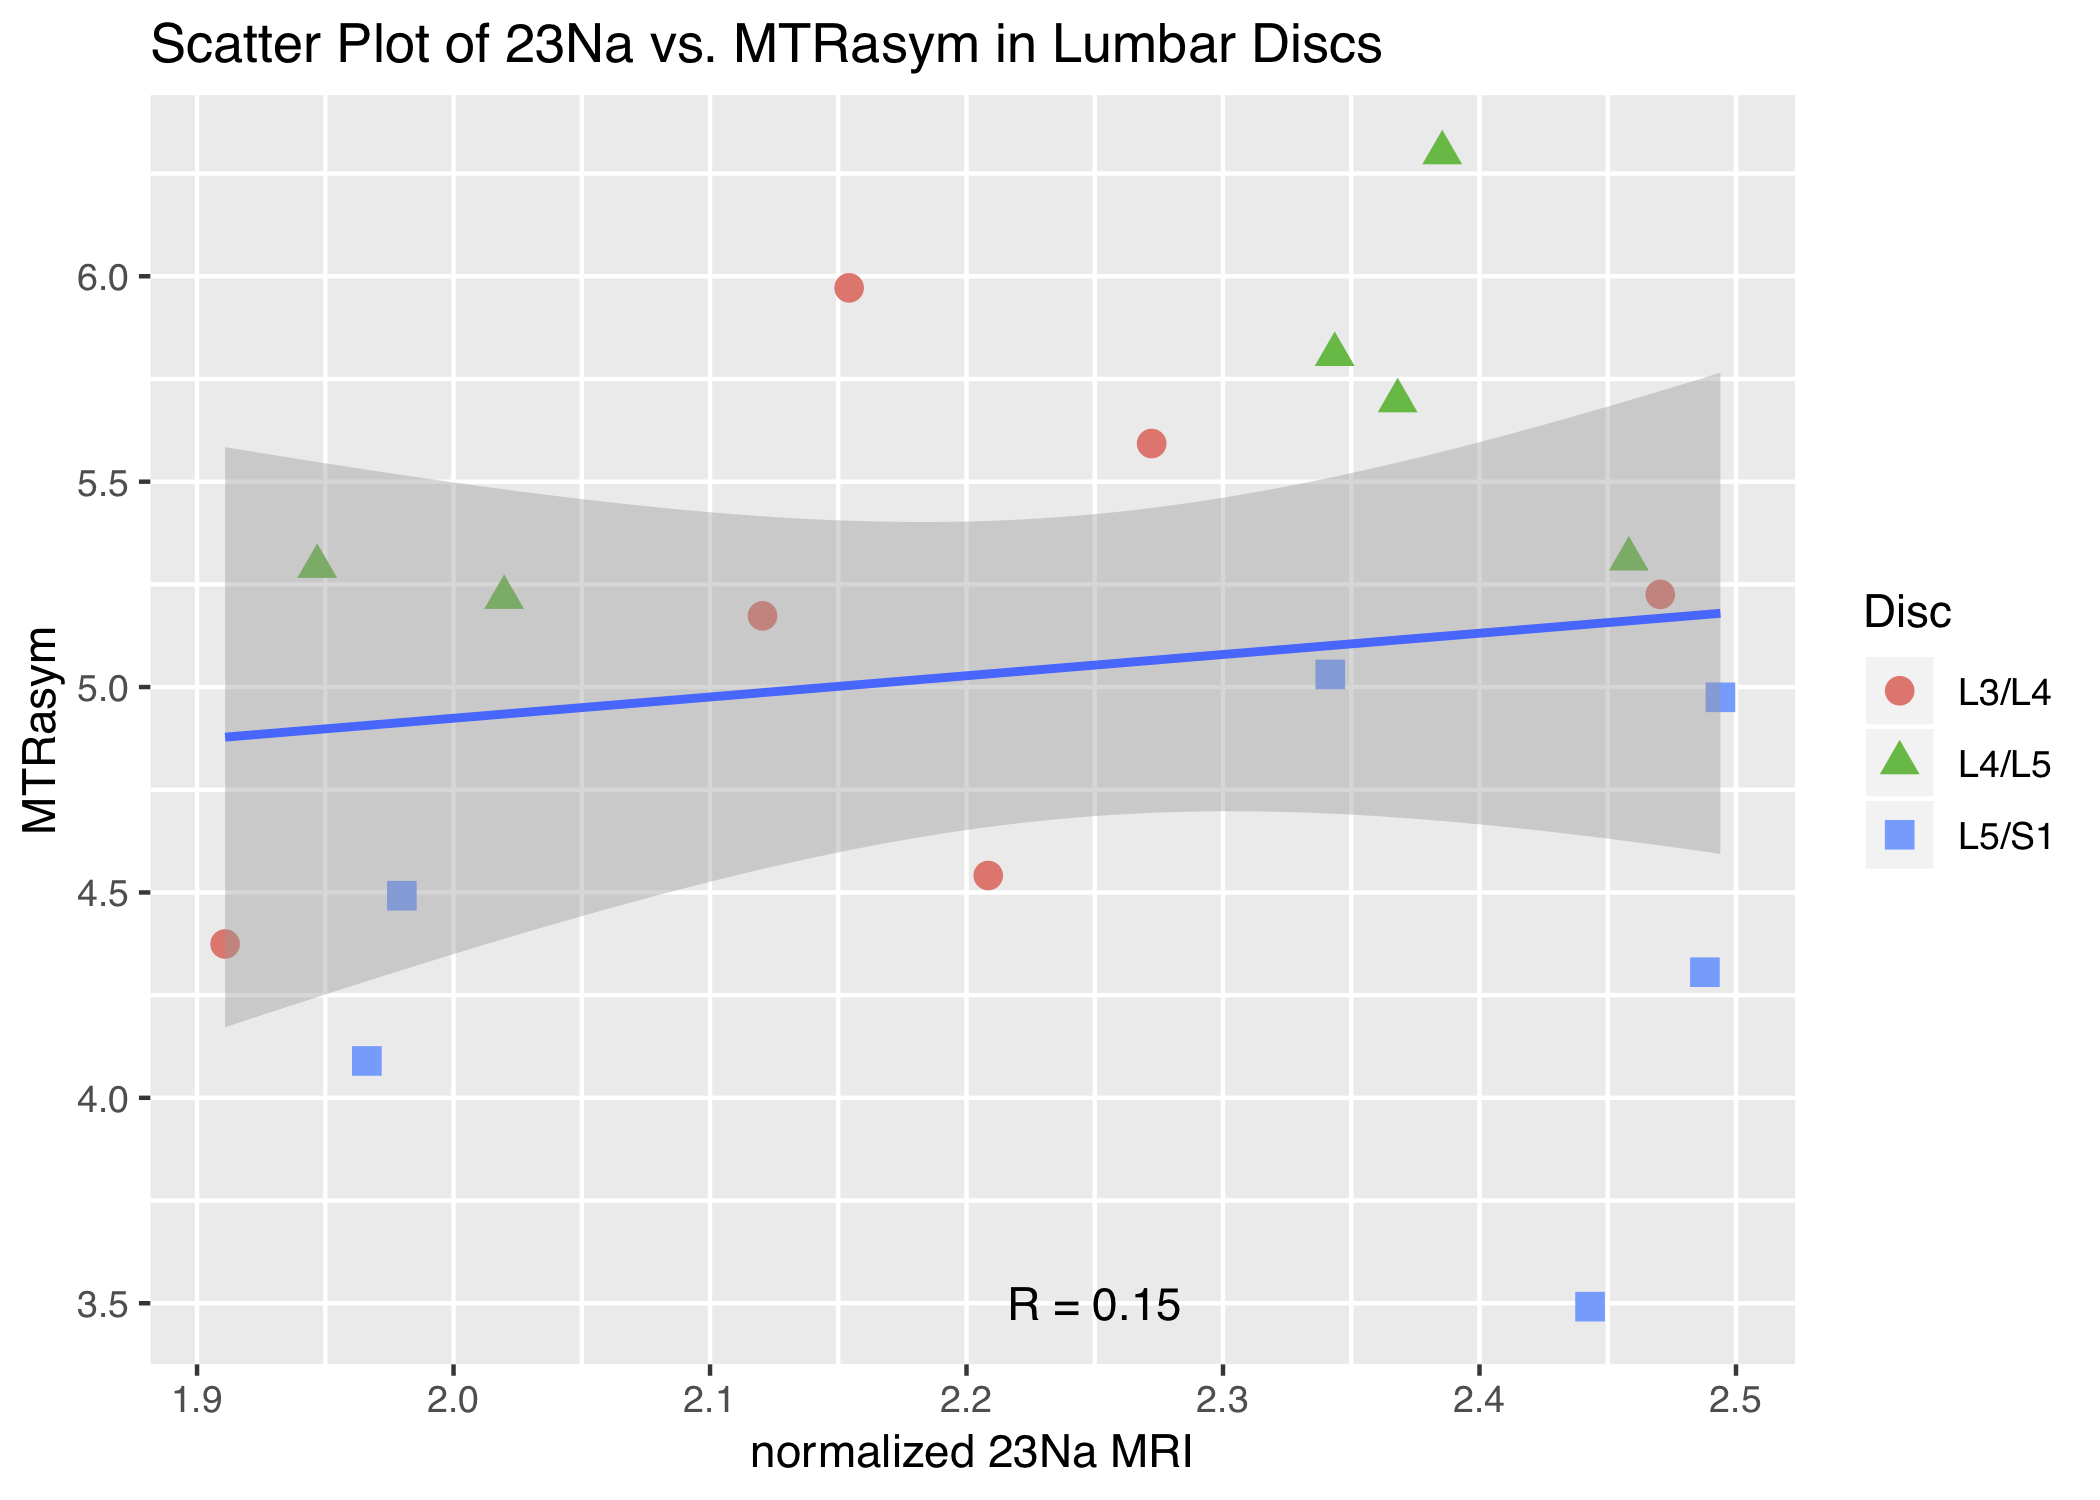
We found very weak correlation (R = 0.15) between 23Na and gagCEST (Fig. 3). However, the disc L5/S1 had significantly lower values on gagCEST (p = 0.004) than L4/L5, probably caused by B1 variation (see Fig.1 and Fig. 3). Therefore, the correlation using only L3/L4 and L4/L5 was calculated too and was found moderate (R = 0.48). There were no significant differences between the different discs measured with the B0 and B1 corrected 23Na-MRI (p>0.7).
An example of MTRasym values, from an L4/L5 disc, overlaid on top of a gradient-echo MRI is shown on Figure 4. Spectra from the same disc, but from two different locations (nucleus pulposus and annulus fibrosus), are shown on Figure 5.
Discussion and Conclusion
GagCEST in lumbar spine was previously measured on 3T in patients with low back pain, where the authors found a significant decrease of GAG MTRasym in nucleus pulposus (but not anulus fibrosus) in patients with morphological degeneration3. With a comparable measurement duration, but on 7T, the signal from nucleus pulposus seems to be better visible in our data. On Figure 4, it is noticeable that the MTRasym values are mostly above 5% in the center, but decrease towards zero on the edges of the disc.
We encountered differences between various discs, depending on their position relative to the coil. The difference was significant in the case of the L5/S1 in comparison with L4/L5, although our volunteers were considered healthy and had similar values of sodium on 23Na-MRI. However, the L5/S1 is known to have signs of degeneration sooner than other discs and in one in vitro study by Saar et al4, gagCEST had higher sensitivity to GAG depletion from an intervertebral disc in comparison with 23Na-MRI.
Improvement to our data could be made by involving a B1 correction technique5, but that would double the measurement time. Moreover, we were not able to reach enough saturation power in the first two lumbar discs, which was caused by the coil design and restricted B1 value due to SAR limitations. Motion correction technique was also shown to improve gagCEST data quality by Mülller-Lutz et al.6. In our case, we had to exclude data from one volunteer, because of movement.
In conclusion, gagCEST has shown to have the potential for mapping GAG content in human lumbar intervertebral discs. When compared to 23Na-MRI, gagCEST was measured in half the time and without the need for special hardware.
Acknowledgements
We acknowledge financial support by the OeNB (grant #13418).
AS has received support from the European Union’s Horizon 2020 research and innovation programme under the Marie Skłodowska-Curie grant agreement No 794986.
References
1) Zbyn, S. et al. Sodium MR Imaging of Articular Cartilage Pathologies. Curr Radiol Rep, 2014. 2: p. 41.
2) Gruber, S. et al. Relative quantification of the 23Na MRI signal of human intervertebral lumbar discs. Proceedings of ISMRM and ESMRMB Joint Annual Meeting & Exhibition, Paris, 2017.
3) Haneder S et al. Assessment of glycosaminoglycan content in intervertebral discs using chemical exchange saturation transfer at 3.0 Tesla: preliminary results in patients with low-back pain. Eur Radiol. 2013; 23(3): 861–868.
4) Saar, G. et al. Assessment of glycosaminoglycan concentration changes in the intervertebral disc via chemical exchange saturation transfer. NMR in Biomed. 2011; 25(2): 255-261.
5) Windschuh, J. et al. Correction of B1-inhomogeneities for relaxation-compensated CEST imaging at 7 T. NMR Biomed. 2015; 28(5):529-537.
6) Müller-Lutz, A. et al.Improvement of gagCEST imaging in the human lumbar intervertebral disc by motion correction. Skeletal Radiol. 2015; 44(4): 505-511.
Figures

Figure 1. Examples of sagittal 23Na MRI (a) and MTRasym map (b) from the volunteer number 5.