3992
Comparison of Different CEST Metrics for Brain Tumor Grading with Semi-Automatic ROIs1Key Laboratory for Biomedical Engineering of Ministry of Education, Department of Biomedical Engineering, College of Biomedical Engineering & Instrument Science, Zhejiang University, Hangzhou, China, 2Department of Radiology, Zhujiang Hospital, Southern Medical University, Guangzhou, China, 3Department of Radiology, Johns Hopkins University, Baltimore, MD, United States
Synopsis
The performance of three CEST metrics including
INTRODUCTION
Chemical Exchange Saturation Transfer (CEST) imaging has shown promising ability to detect various metabolites in vivo1-3. Amide Proton Transfer (APT) imaging, a subtype of CEST imaging, can detect endogenous mobile proteins / peptides and has been used for brain tumor grading4. However, the APT signal can be complicated by competing effects, such as direct water saturation, semi-solid macromolecular magnetization transfer effects, and other exchanging pools5. Several published studies have attempted to separate the pure APT effect from other competing effects by using various CEST metrics in conjunction with z-spectrum fitting6,7. Nevertheless, z-spectrum fitting typically requires a significant number of CEST saturation offset frequencies and is susceptible to local minima during numerical optimization, thus may not be optimal in routine clinical applications. In this study, we aimed to compare the performance of three CEST metrics including CESTR, CESTRnr, and MTRRex at various frequency offsets without z-spectrum fitting, using semi-automatically generated regions of interest (ROIs) for human brain tumor grading.METHODS
All experiments were performed on a Philips 3T Achieva scanner. This study was approved by the local Institutional Review Board, and informed consent forms were obtained from 39 patients (42.6 ± 13.7 years old), including 23 confirmed high-grade and 16 confirmed low-grade glioma patients. The imaging parameters were as follows: RF saturation power/duration=2μT/0.8sec, TR/TE=3000/11msec, FOV=230mm2, slice thickness=6mm, and scan duration=3.2min. CEST z-spectra were acquired with 63 frequency offsets from 6 to -6ppm plus 15.6ppm. CESTR8 was calculated by subtracting the reference signal from the label signal as $$CESTR=\left(S_{ref}-S_{lab}\right)/S_{0}=Z_{ref}-Z_{lab}$$ where Sref is the reference signal, Slab is the label signal, S0 is the unsaturated signal, and Zref and Zlab are the corresponding normalized z-spectrum signals. We took the signal at the negative frequency offset as the reference signal. Another CEST metric6 was obtained via normalizing CESTR by the reference signal Zref as $$CESTR^{nr}=\left(Z_{ref}-Z_{lab}\right)/Z_{ref}$$ In addition, MTRRex9 was calculated by subtraction of the inverse z-spectrum as $$MTR_{Rex}=1/Z_{lab}-1/Z_{ref}$$
The performance of the three aforementioned CEST metrics including CESTR, CESTRnr, MTRRex was compared for grading brain gliomas at the frequency offsets of 3.5, 3, 2.5, 2, 1.5, and 1ppm, respectively. For each patient, one preliminary large ROI covering the whole region of hyperintensity on the unsaturated CEST image was first drawn by an experienced radiologist with consideration of T1w, T2w images. Second, the ROI was copied from the unsaturated image to the APTw map. Third, the APTw histogram within the ROI was calculated. Fourth, all connected regions with APTw intensities greater than a selected histogram cutoff value (e.g. 90th percentile) were identified. Fifth, the identified regions were binarized. Sixth, the masked region with the greatest area was selected. Last, the contour of the selected ROI was extracted. (Fig. 1). The same ROI generated from APTw maps were used for all different CEST metric maps. The Receiver Operating Characteristic (ROC) curves were used to evaluate the performance of different CEST metrics.
RESULTS
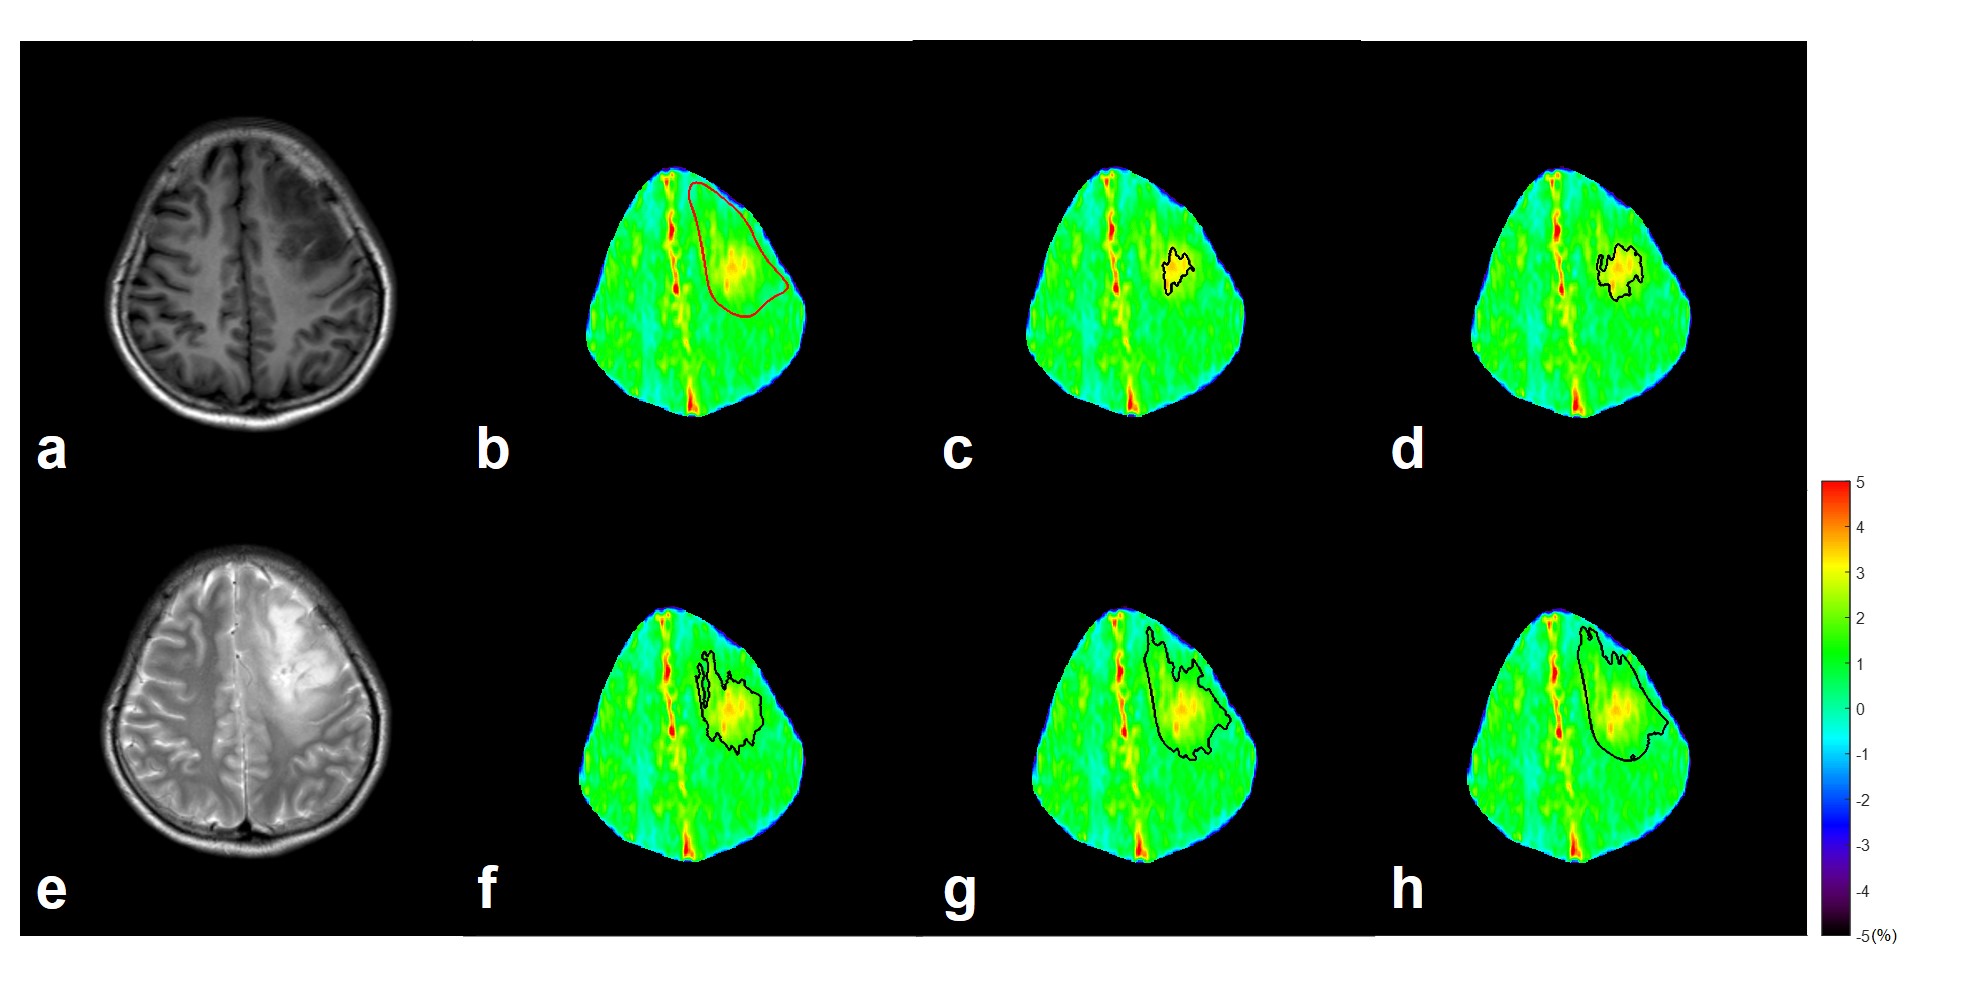
For both low-grade (Fig. 2) and high-grade (Fig. 3) gliomas, the higher was the cutoff threshold, the smaller was the area of the final ROI. For a 90th percentile threshold, i.e. when only the top 10% CEST values were selected, only a small region with highest CEST values were selected as shown in Figures. 2c and 3c. On the contrary, for a 10th percentile threshold, essentially the whole tumor region was chosen as in Figures. 2h and 3h. Figure 4 illustrates the CESTR, CESTRnr, and MTRRex maps at various frequency offsets from a high-grade glioma patient. Furthermore, AUCs of the ROC analysis demonstrate the CESTRnr metric at 3 ppm with either a 90th or 10th percentile cutoff value generated the best results in terms of tumor grading (Table. 1).DISCUSSION
Although it will be best to deploit different z-spectrum fitting methods to disentangle the contributions from different CEST pools, the routine clinical environment typically does not allow this due to scan time limitation. Here, we resort to a simple, yet clinically relevant, approach to compare the performance of different CEST metrics for tumor grading without z-spectrum fitting. Furthermore, note that the AUC results might have been affected by the position of the CEST imaging slice with respect to the whole brain since only a single slice was used.CONCLUSION
The results of this preliminary study indicate that CEST metrics including CESTR, CESTRnr, MTRRex at 3ppm are superior to other frequency offsets for grading human brain gliomas.Acknowledgements
NSFC grant number: 61801421. This work is also supported by “the Fundamental Research Funds for the Central Universities (Grant No. 2018QNA5016)”.References
1. Ward K, Aletras A, Balaban RS. A new class of contrast agents for MRI based on proton chemical exchange dependent saturation transfer (CEST). J Magn Reson 2000;143(1):79-87.
2. Zhou J, van Zijl PC. Chemical exchange saturation transfer imaging and spectroscopy. Prog Nucl Magn Reson Spectrosc 2006;48(2-3):109-136.
3. Van Zijl PC, Yadav NN. Chemical exchange saturation transfer (CEST): what is in a name and what isn't? Magn Reson Med 2011;65(4):927-948.
4. Zhou J, Lal B, Wilson DA, Laterra J, Van Zijl PC. Amide proton transfer (APT) contrast for imaging of brain tumors. Magn Reson Med 2003;50(6):1120-1126.
5. Sun PZ, Sorensen AG. Imaging pH using the chemical exchange saturation transfer (CEST) MRI: correction of concomitant RF irradiation effects to quantify CEST MRI for chemical exchange rate and pH. Magn Reson Med 2008;60(2):390-397.
6. Heo HY, Lee DH, Zhang Y, Zhao X, Jiang S, Chen M, Zhou J. Insight into the quantitative metrics of chemical exchange saturation transfer (CEST) imaging. Magn Reson Med 2017;77(5):1853-1865.
7. Zhang J, Zhu W, Tain R, Zhou XJ, Cai K. Improved Differentiation of Low-Grade and High-Grade Gliomas and Detection of Tumor Proliferation Using APT Contrast Fitted from Z-Spectrum. Molecular Imaging and Biology 2018:1-9.
8. Zhou J, Payen J-F, Wilson DA, Traystman RJ, van Zijl PC. Using the amide proton signals of intracellular proteins and peptides to detect pH effects in MRI. Nat Med 2003;9(8):1085-1090.
9. Zaiss M, Xu J, Goerke S, Khan IS, Singer RJ, Gore JC, Gochberg DF, Bachert P. Inverse Z‐spectrum analysis for spillover‐, MT‐, and T1‐corrected steady‐state pulsed CEST‐MRI–application to pH‐weighted MRI of acute stroke. NMR Biomed 2014;27(3):240-252.
Figures