3991
Thermal sensitive pH imaging using CEST1Tokushima University, Tokushima, Japan, 2Kanazawa University, Kanazawa, Japan, 3Global MR Applications and Workflow, GE Healthcare Japan, Tokyo, Japan
Synopsis
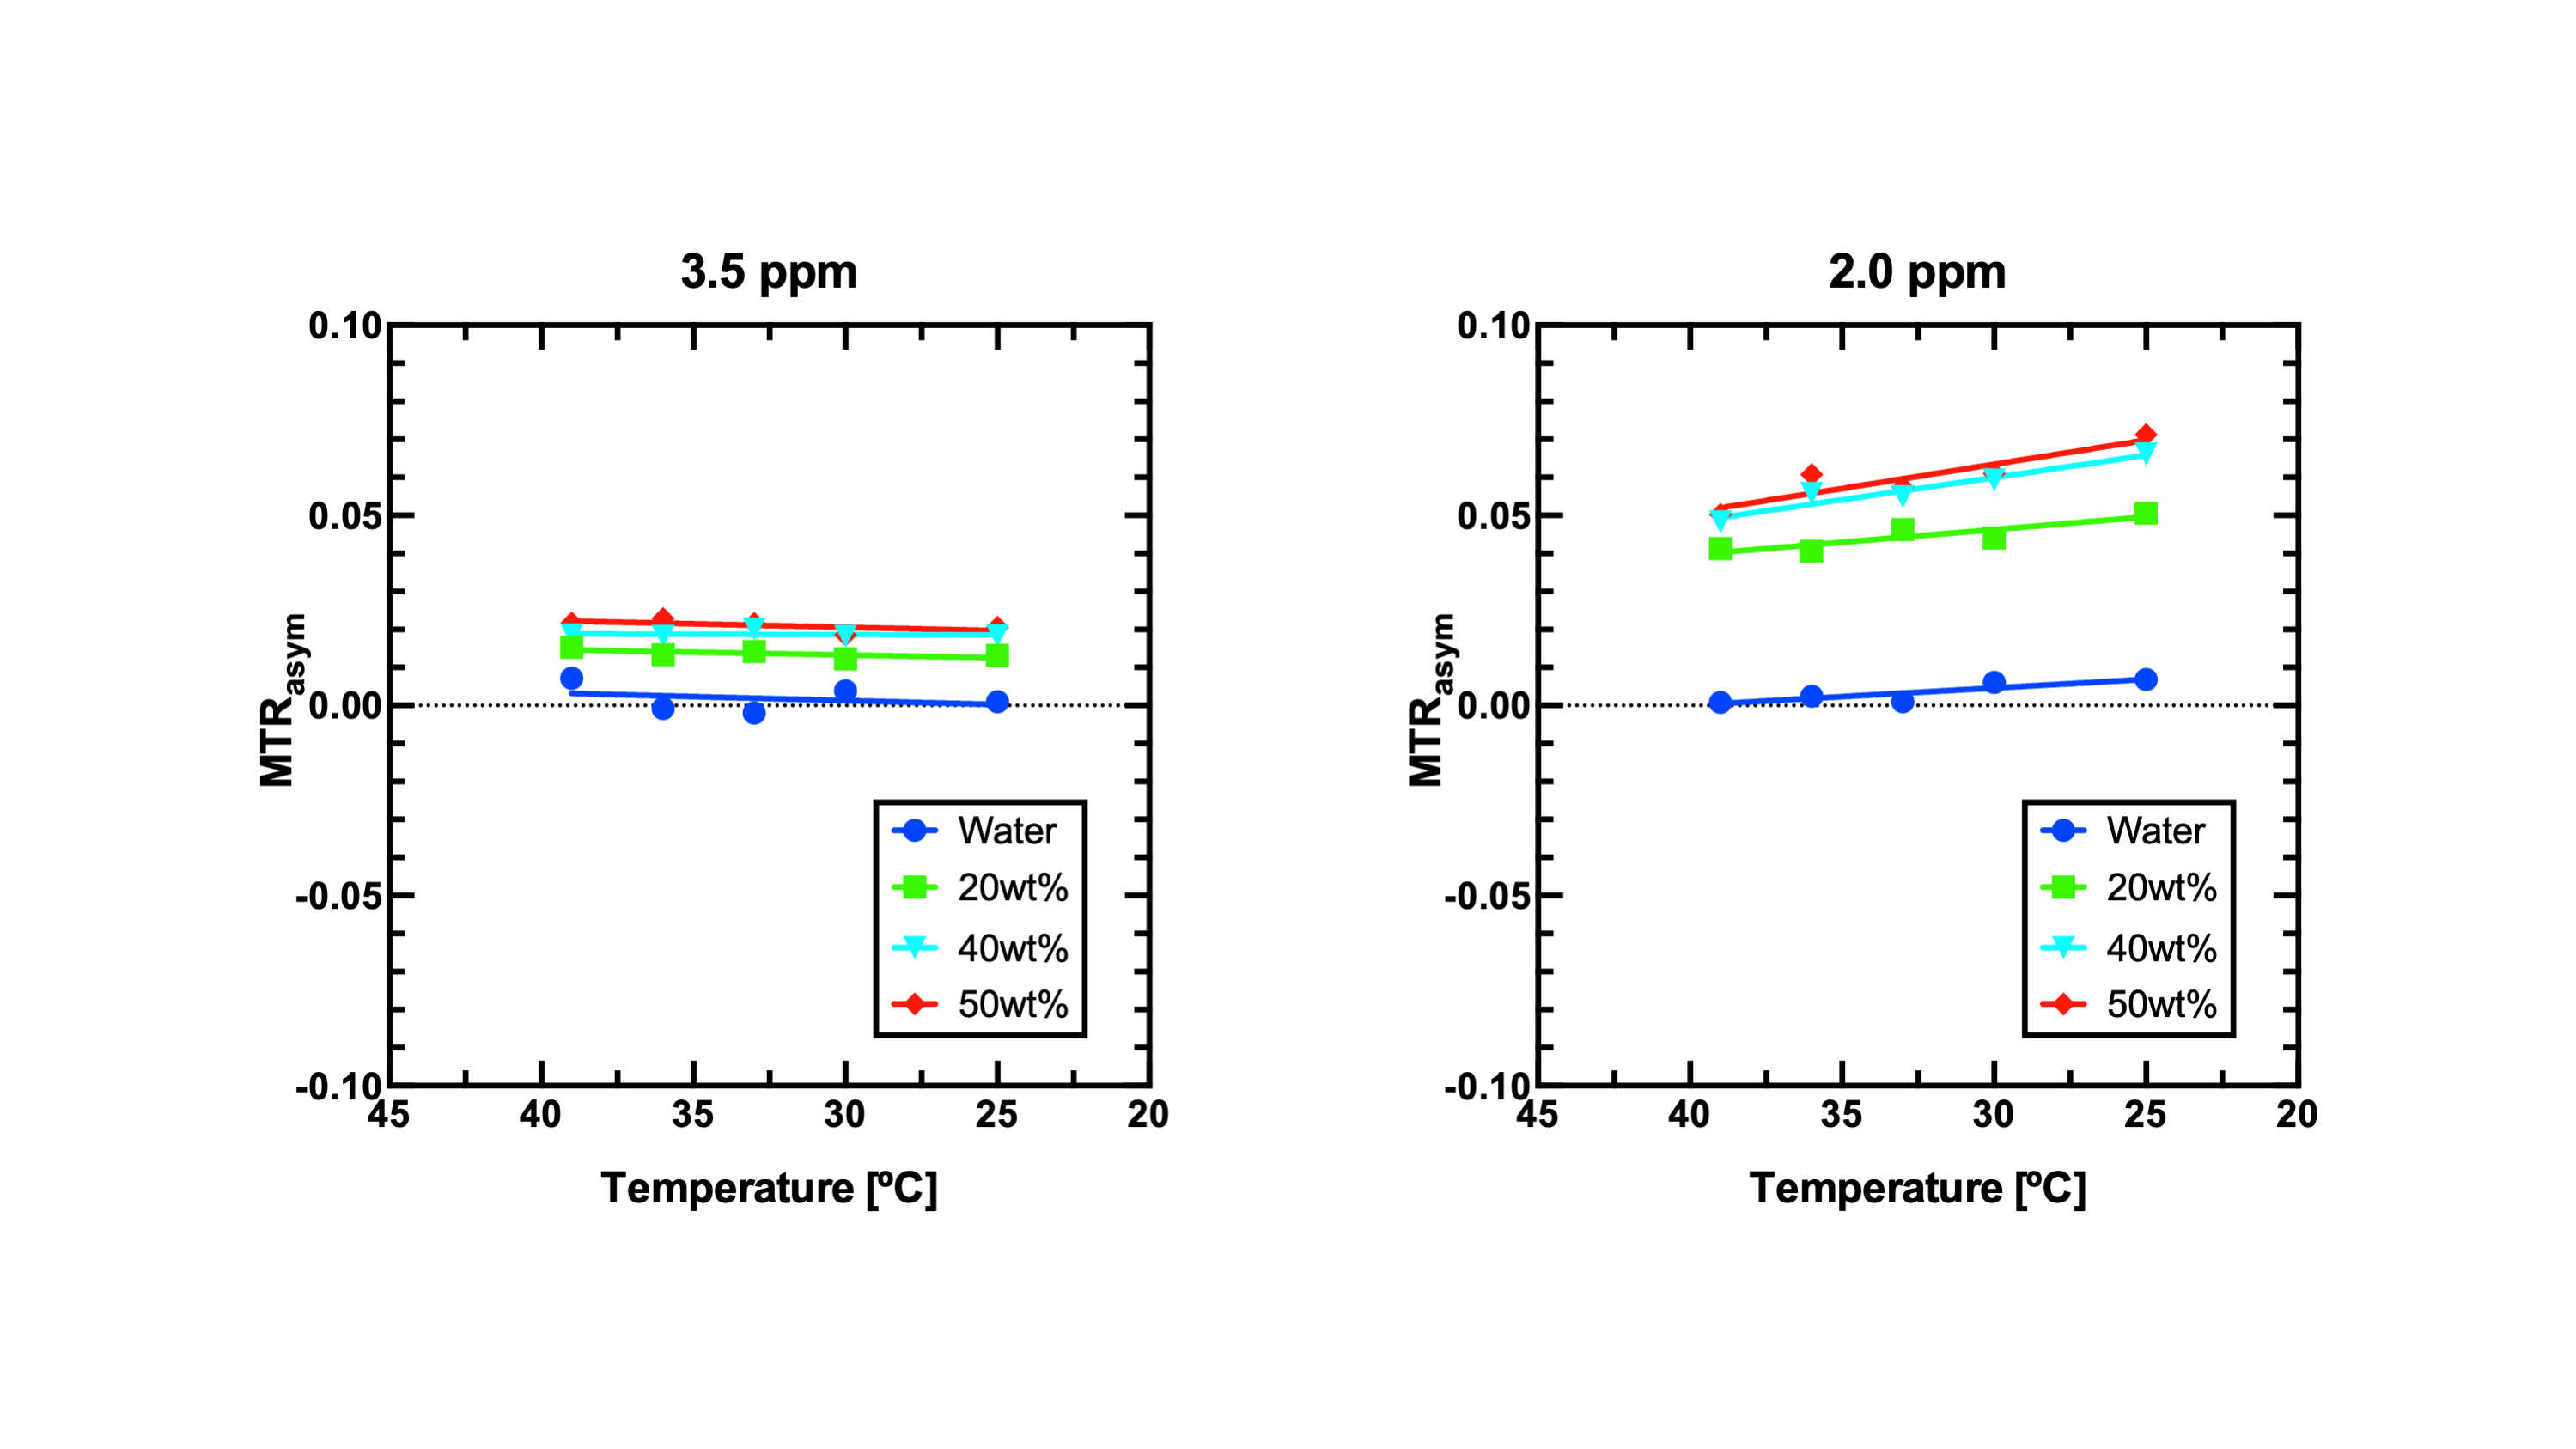
We performed phantom study with CEST and clarified pH change depending on temperature. Linear regression analysis shows a strong significant correlation between temperature and MTRasym at 2.0 ppm in all egg white albumin samples (R2 > 0.78, P < 0.05). As pH changed with temperature, we found that the offset frequency of MTRasym was more sensitive at 2.0 ppm than that at 3.5 ppm.
Introduction
Chemical exchange saturation transfer (CEST) imaging has especially been regarded as an intrinsic pH contrast as well as protein- and/or peptide-content contrast methods. Most studies have focused on amide proton transfer (APT) imaging targeting the amide group which is involved in the creation of many biological metabolites. For clinical utilization of APT imaging there have been several reports published concerning brain tumors [1], and acute ischemia [2]. CEST imaging techniques have been developed with improved optimization of B1 power, correction of B0 inhomogeneity, and construction of magnetization transfer (MT) -pool models. In most experiments phantoms and samples have been used for pH adjustment. However, no speculation has taken place to determine the relationship between pH and APT imaging in the in vivo situation. In general, pH change depends on several surrounding factors, e.g., temperature, and solution [3].Purpose
The aim of our study is to clarify the relationship between CEST signals and the effect of pH with temperature change.Materials and Methods
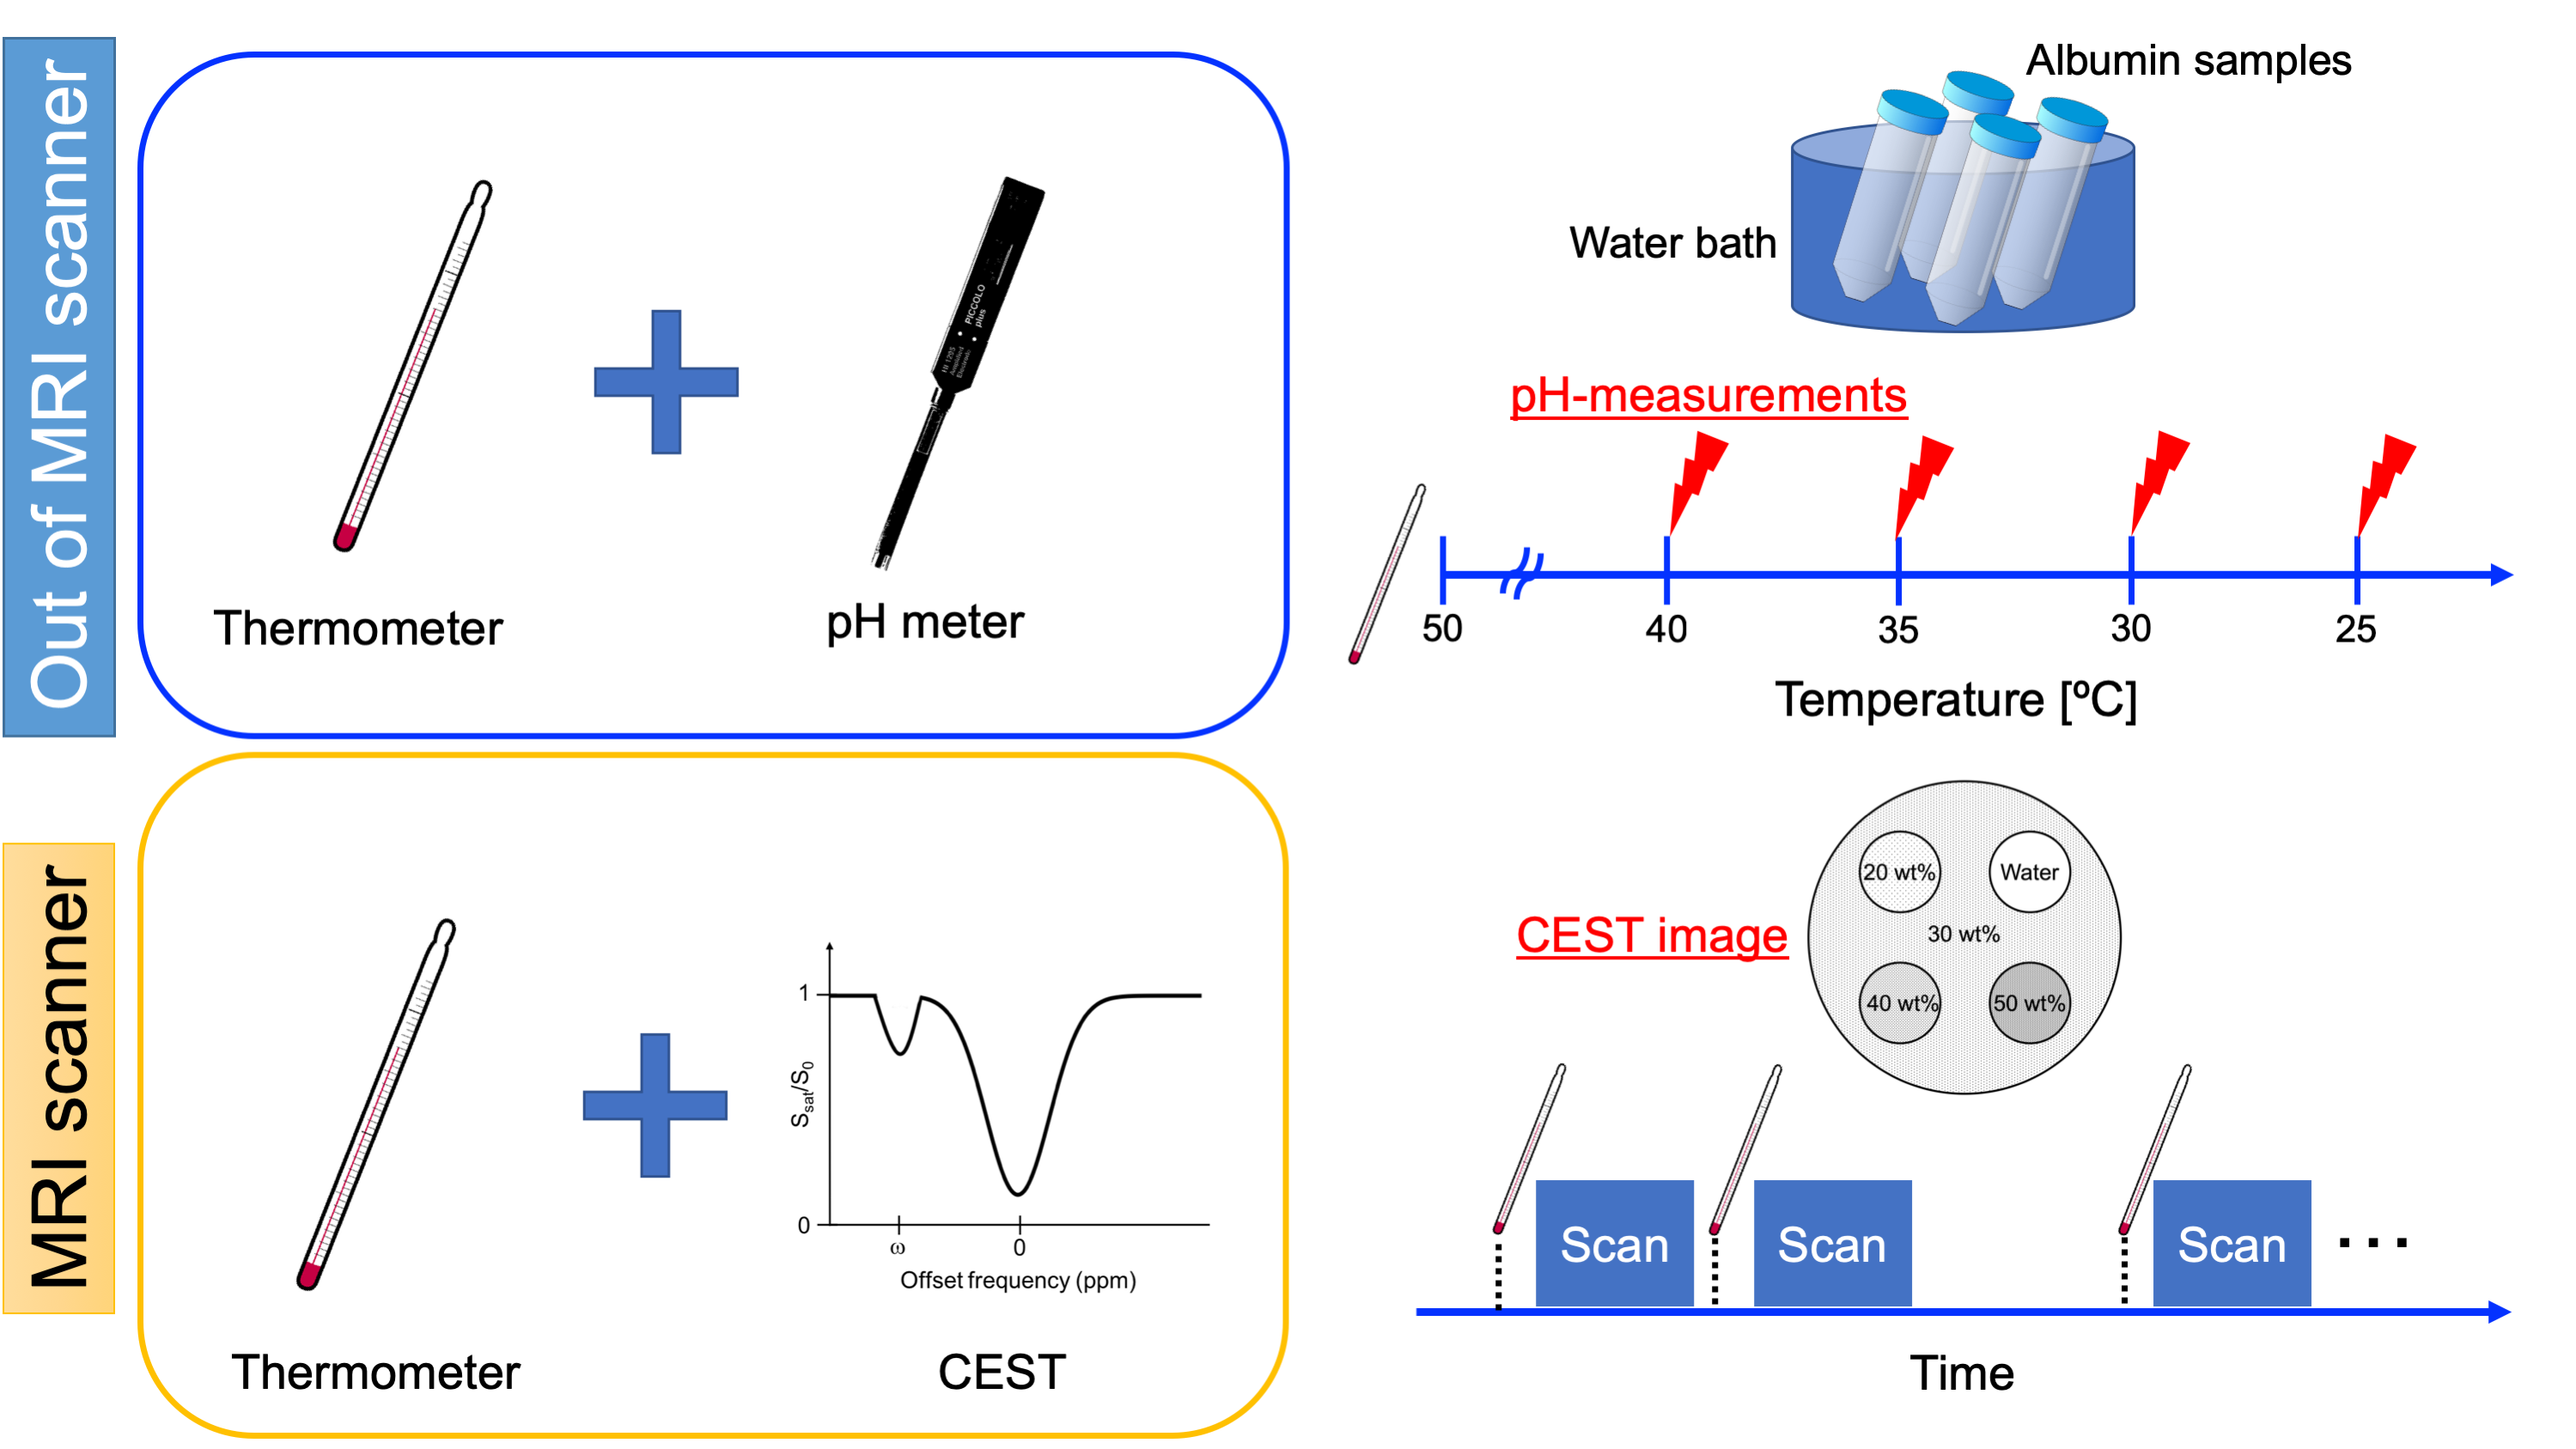
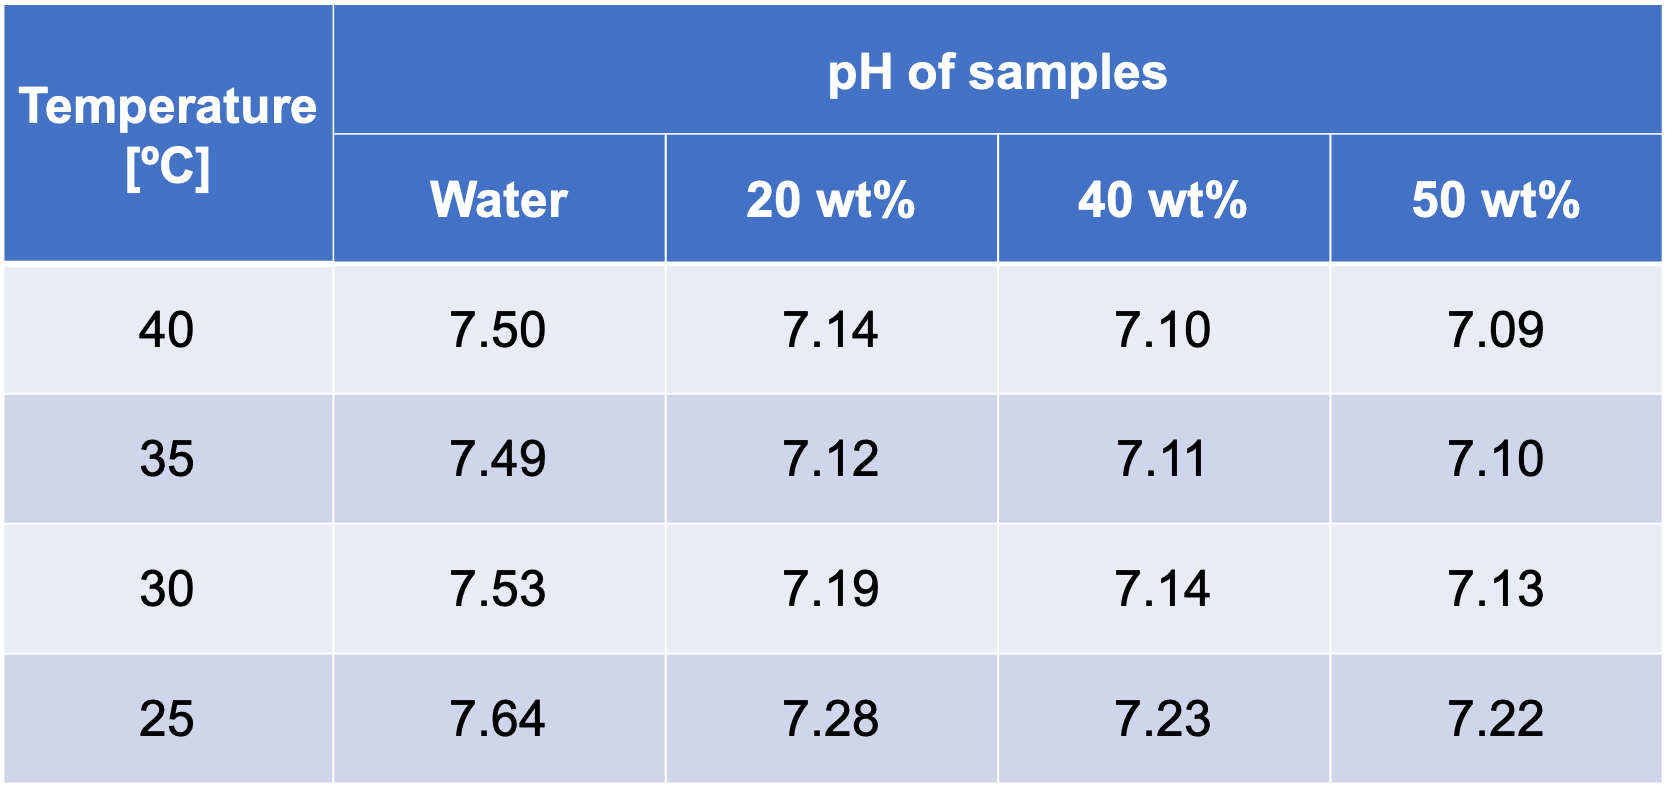
Figure 1 shows schematic diagrams of our study. First, we conducted experiments concerning pH to temperature changes of water and different concentrations of egg white albumin solution (20, 40, and 50 wt%); four samples were performed. After these samples were heated in a water bath at 50 ºC for 10 min, the pH of each sample was measured at 5 ºC increments from 25 to 40 ºC. Second, on a 3 Tesla MR scanner (Discovery 750, GE Healthcare), a CEST imaging was performed with the same samples used in the above experiment. The four samples were fixed in an environment filled with 30 wt% egg white albumin contained within a glass container (see Fig. 1). Then, a total six datasets for CEST was acquired while observing temperature change with a thermometer placed into the phantom. The CEST pulse sequence that was used was single-shot fast spin-echo sequence and a phase cycle radio frequency (RF) preparation. The frequency offset range was set at -7 to +7 ppm at intervals of 0.5 ppm, and a total of 29 data points were acquired. The mean B1 values of the MT pulses were set at 1.5 µT. The other imaging parameters were as follows: echo time, 26.5 ms; repetition time, 4000 ms; bandwidth, ±62.5 kHz; field of view, 16 cm; matrix size, 128 × 128; slice thickness, 5 mm. The Water saturation shift referencing (WASSR) post processing method was applied to acquired imaging data in order to carry out B0 correction for each pixel [4]. MT ratio asymmetry (MTRasym) was calculated using the following formula:
$$MTR_{asym}=MTR\left(+∆\omega\right)-MTR\left(-∆\omega\right)=\frac{I_{sat}\left(-∆\omega\right)-I_{sat}\left(+∆\omega\right)}{I_{0}}, $$
where Isat and I0 are the imaging signal intensities measured with MT pulses at each frequency (∆ω) and at -10 ppm frequency where there was no MT effect observed, respectively. Next, region of interest (ROI) analysis was performed for each sample. Then, we compared the MTRasym value and temperature for each sample.
Results and Discussions
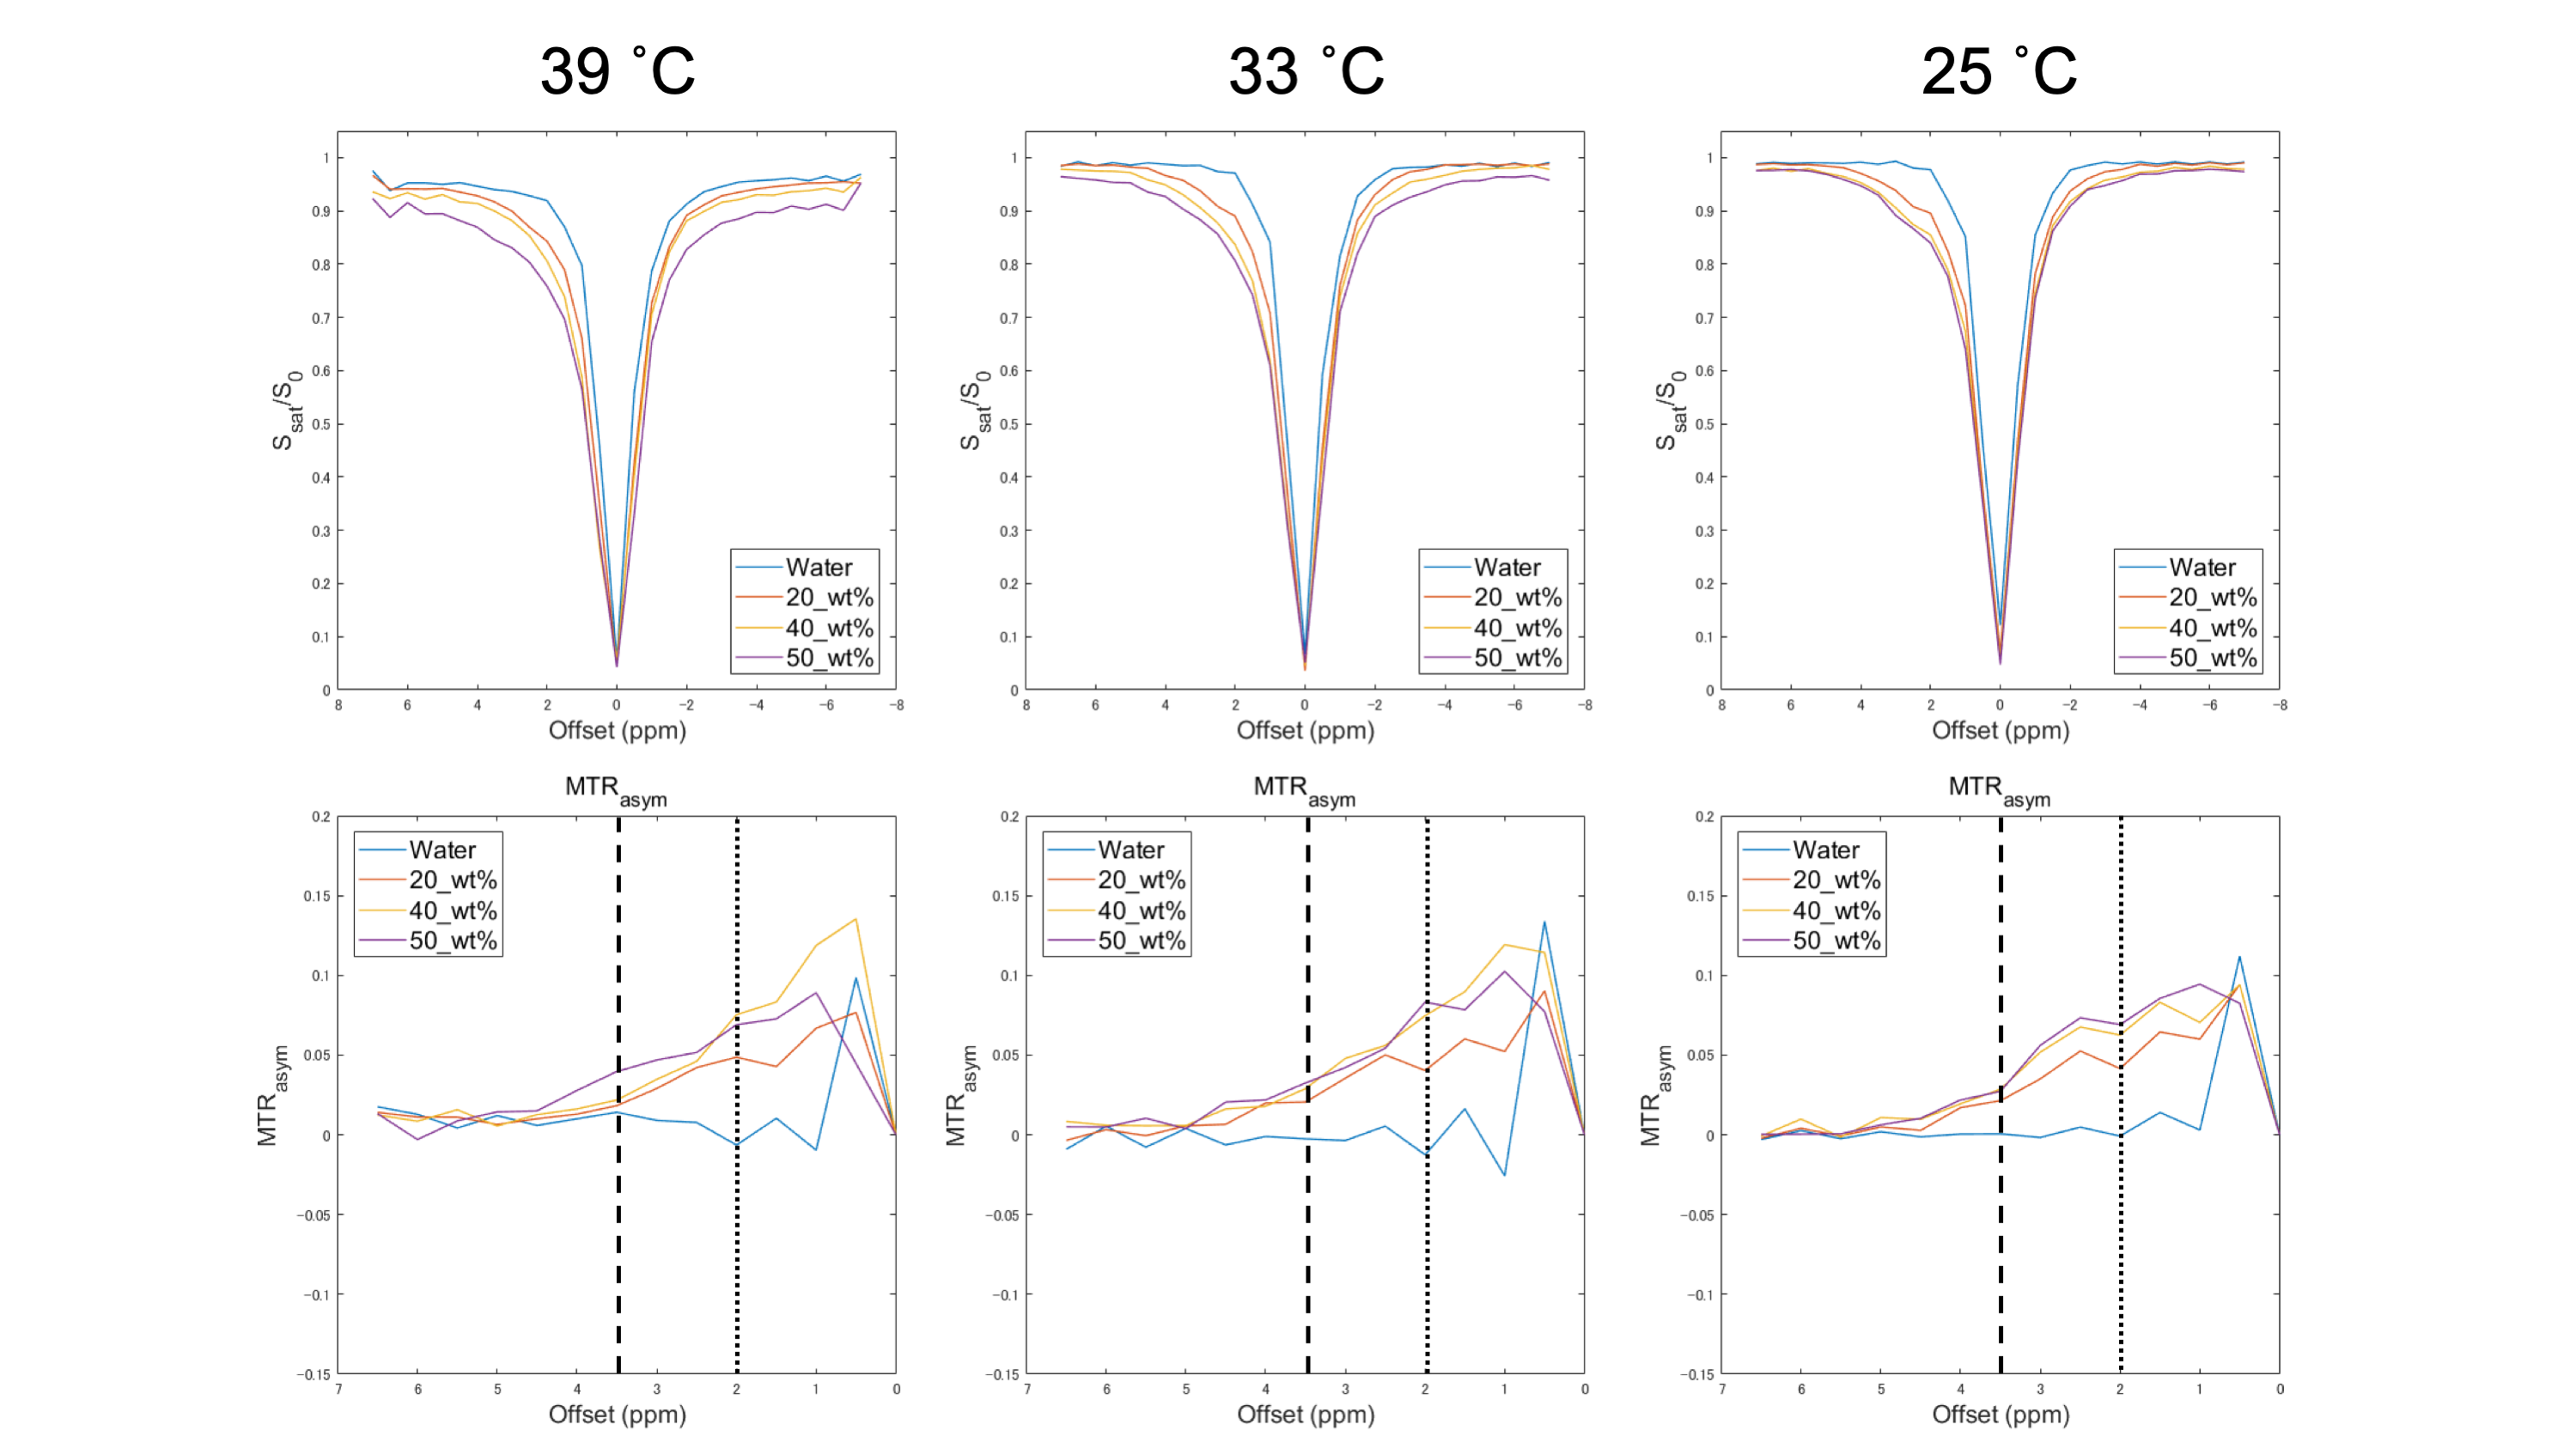
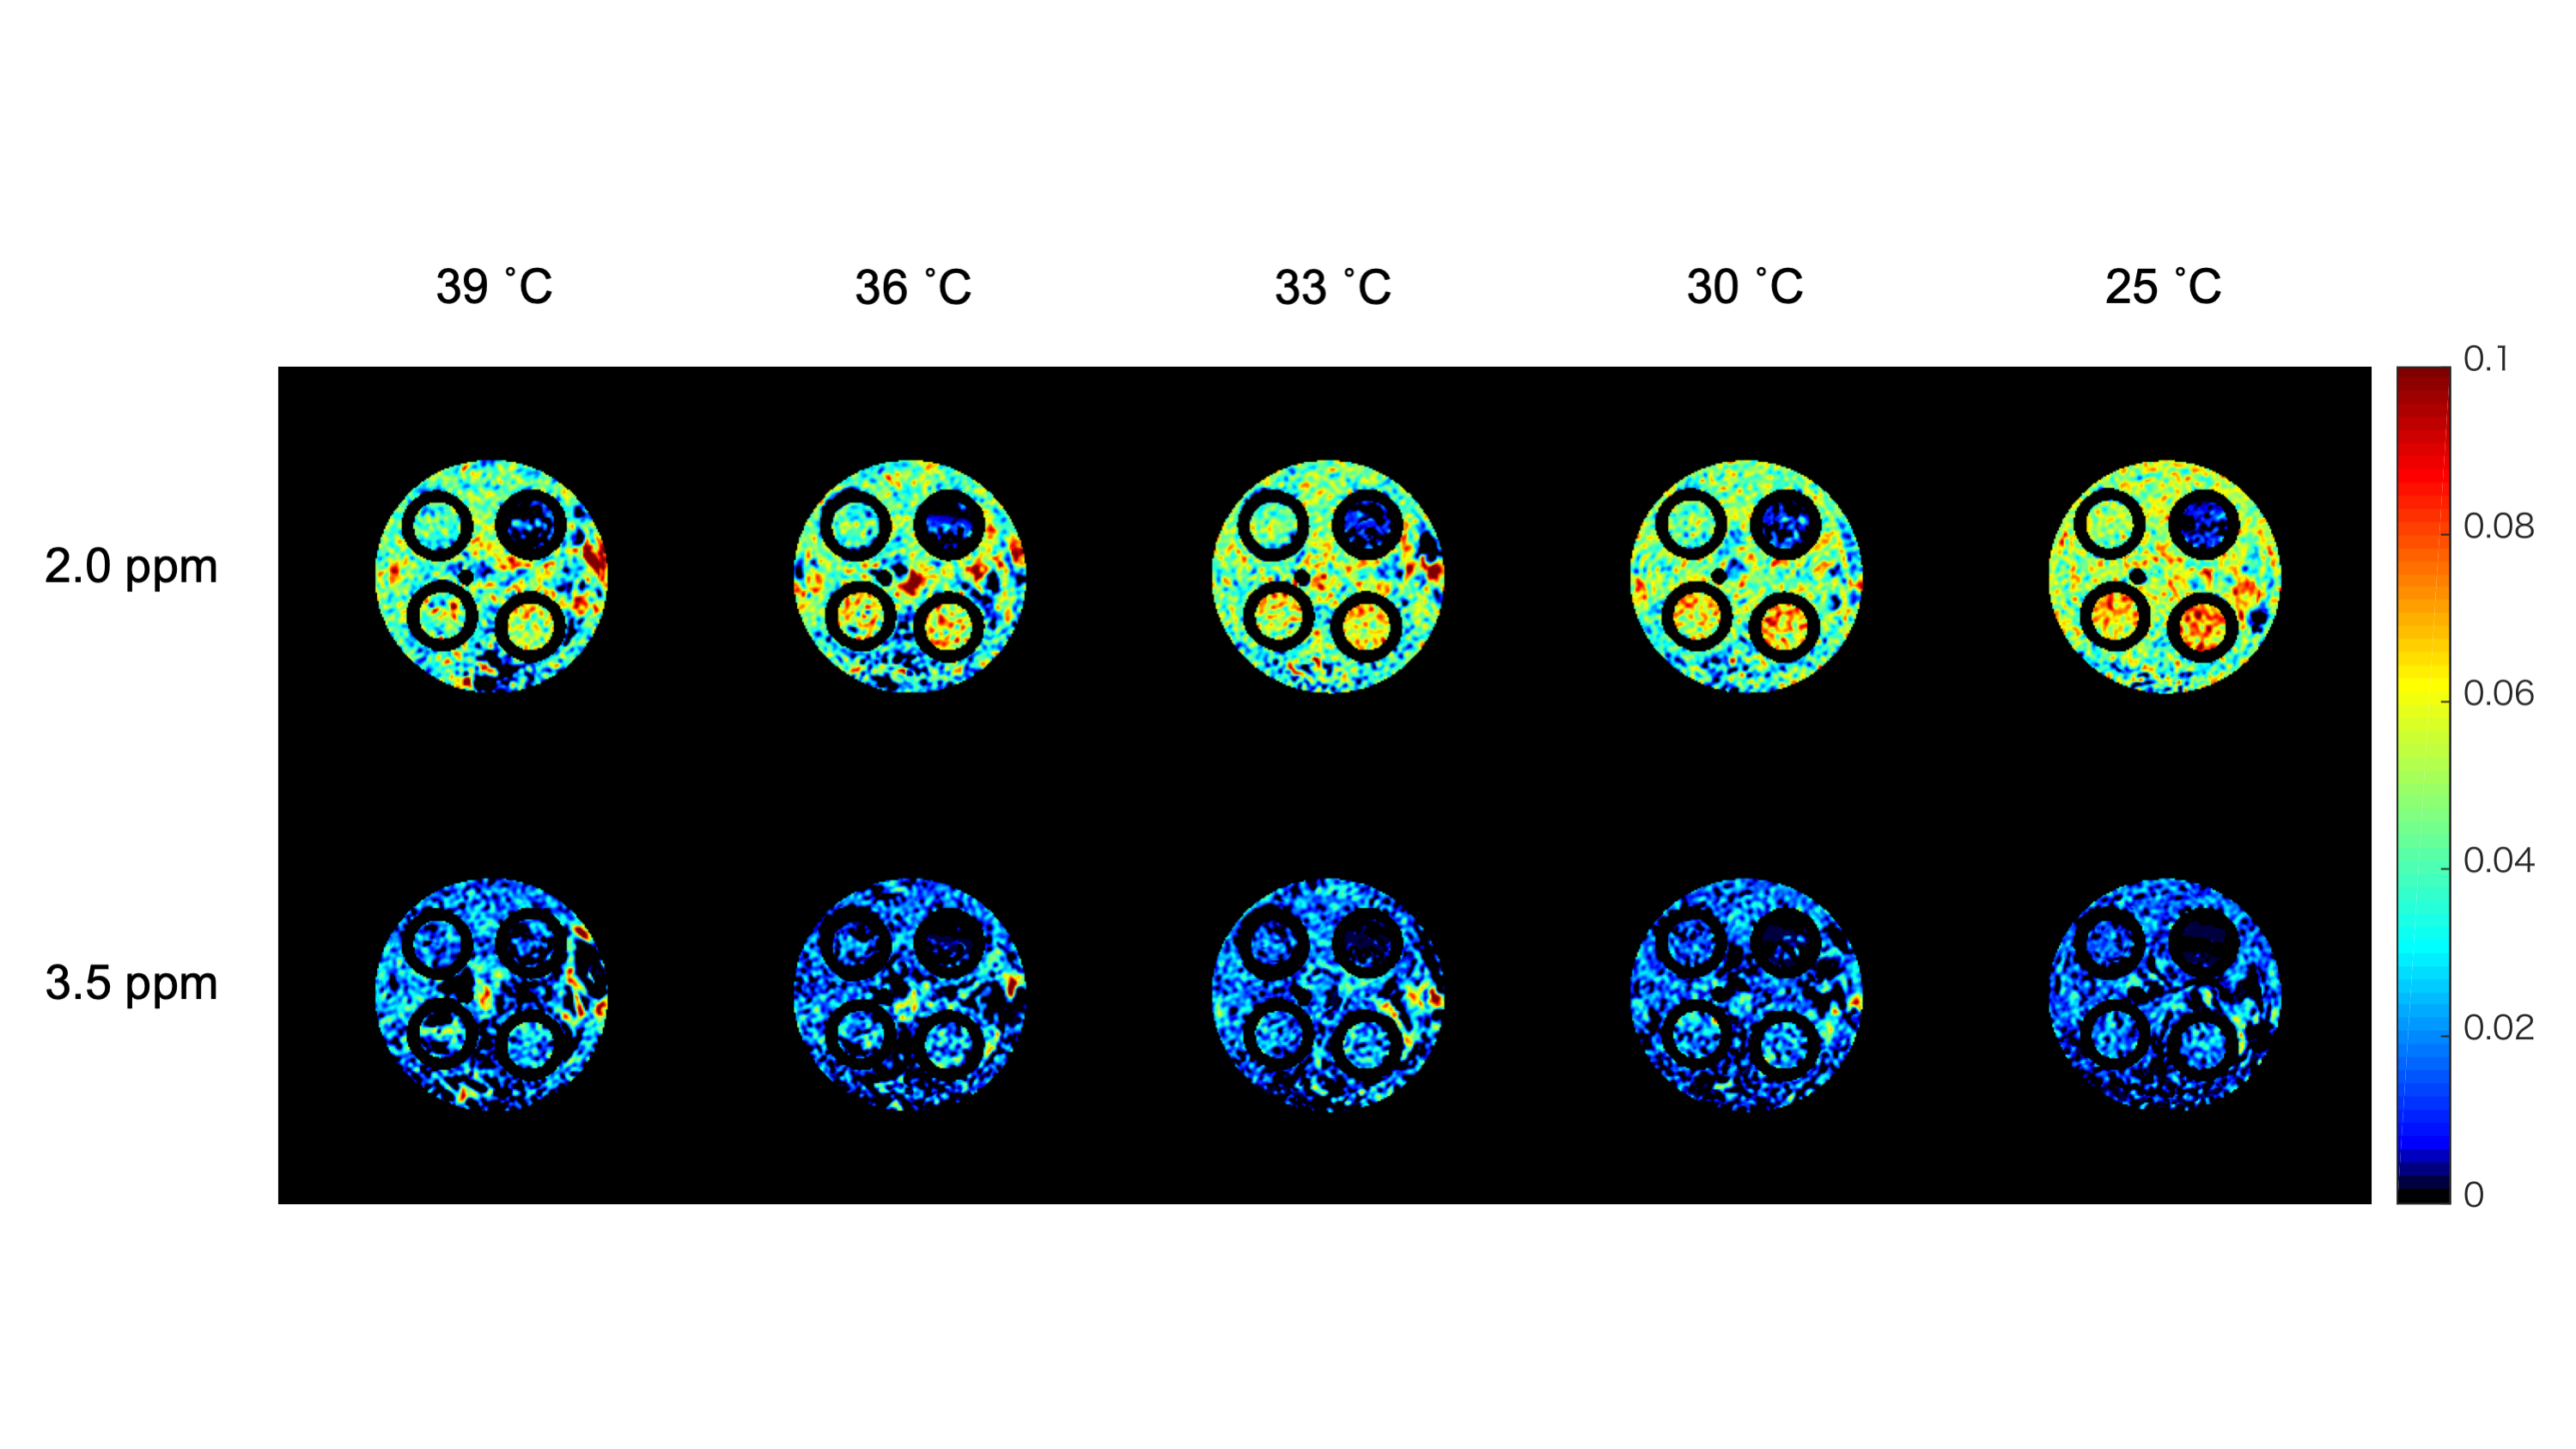
Table 1 shows measured values of pH and temperature for each sample. Figure 2 shows Z-spectrums and MTRasym curves for each temperature. Figure 3 shows MTRasym at 2.0 ppm and at 3.5 ppm images for each temperature. Figure 4 shows the relationship between MTRasym values at 2.0 ppm and temperature in our MRI experiment. Linear regression analysis shows a strong significant correlation between temperature and MTRasym at 2.0 ppm in all egg white albumin samples (R2 > 0.78, P < 0.05). On the other hand, there are no correlation between them in all egg white albumin and water samples at 3.5 ppm. As pH changed with temperature, we found that the offset frequency of MTRasym was more sensitive at 2.0 ppm than that at 3.5 ppm. We regard two factors of the pH change with temperature as follows: one is a fast-exchange effect of amine- and hydroxyl- protons contained in egg white albumin; the other is the difference of peak width of direct water saturation associated with temperature.Conclusion
CEST imaging enables us to evaluate pH changes with temperature. Moreover, it is found that pH change with temperature effect in vivo appears to cause few changes at 3 Tesla MR scanner.Acknowledgements
This study was partly supported by JSPS KAKENHI [grant number 17K09065].References
- Zhou J, Lal B, Wilson DA, Laterra J, van Zijl PC. Amide proton transfer (APT) contrast for imaging of brain tumors. Magn Reson Med 2003; 50:1120–1126.
- Jokivarsi KT, Gröhn HI, Gröhn OH, Kauppinen RA. Proton transfer ratio, lactate, and intracellular pH in acute cerebral ischemia. Magn Reson Med 2007; 57:647–653.
- Covington, AK, Bates,RG, Durst RA. Definitions of pH scales, standard reference values, measurement of pH, and related terminology. Pure Appl Chem. 1985; 57 (3): 531–542.
- Kim M, Gillen J, Landman BA, Zhou J, van Zijl PC. Water saturation shift referencing (WASSR) for chemical exchange saturation transfer (CEST) experiments. Magn Reson Med. 2009;61(6):1441-50.
Figures