3988
Towards glycoCEST in the liver at 7T with a multi-transmit system1Biomedical Imaging Center, Pontificia Universidad Católica de Chile, Santiago, Chile, 2Imaging Division, University Medical Centre Utrecht, Utrecht, Netherlands
Synopsis
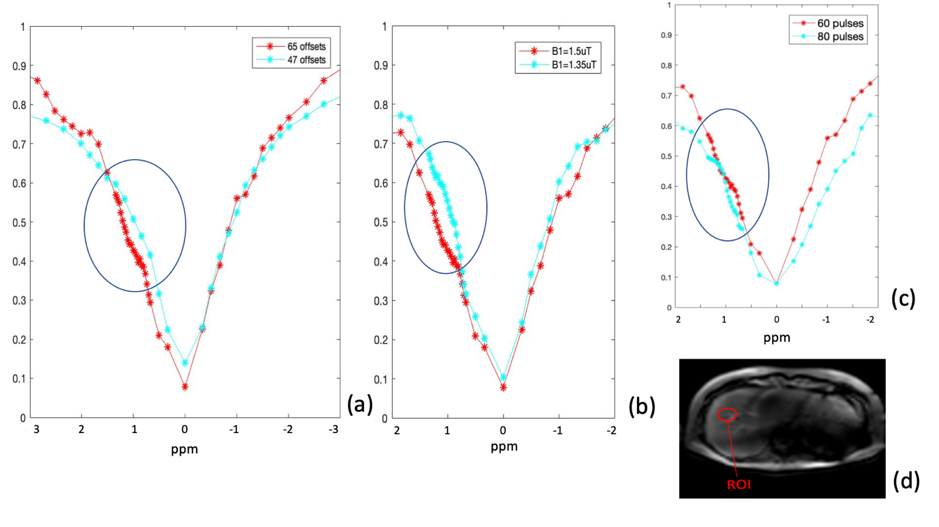
The purpose of this work was to optimize and evaluate different parameters of the CEST acquisition protocol at 7 Tesla to be able to detect the glycoCEST signal in the human liver. The so far optimized parameters were determined as 65 frequency offsets, 60 saturation pulses of 25 ms duration and an effective B1 of 1.5uT. As conclusion, we have demonstrated that in-vivo liver glycoCEST can be detected in the human liver by using a CEST acquisition at 7T. The parameters can be further optimized to obtain a stronger glycoCEST effect.
Introduction
Glycogen is the main storage form of glucose in animals and, especially the liver has a large glycogen storage capacity. Glycogen storage may be abnormal in conditions such as obesity, type2 diabetes and non-alcoholic fatty liver disease (NAFLD)1. Therefore, it is important to have a non-invasive method to quantify glycogen for a better understanding of those pathologies and potentially aid in clinical diagnosis. Nowadays the only non-invasive method available to study glycogen metabolism is 13C MR spectroscopy, however this is not available on standard clinical scanners2. By exploiting chemical exchange between the hydroxyl protons of glycogen and the water protons, we can measure the chemical exchange saturation transfer (CEST) effect of glycogen (glycoCEST). At higher magnetic field strengths, such as 7 tesla (T), the spectral resolution is enhanced, making it possible to discriminate the glycoCEST effect at about 0.5-1.5 ppm from the water resonance3.
The purpose of this work was to optimize and evaluate different parameters of the CEST acquisition protocol at 7T to be able to detect the glycoCEST signal in the liver.
Methods
All measurements were performed at a 7T whole body system (Philips, Best, The Netherlands) using eight parallels transmit channels, each connected to a transmit-receive fractionated dipole antenna4 (MR Coils BV, Drunen, The Netherlands) and 16 additional receive loops integrated with the antennas (2 per antenna). B0 and B1 shimming were performed using and in-house MATLAB phase optimization algorithm and the MRCode software (MR Code BV, Zaltbommel, The Netherlands), respectively.
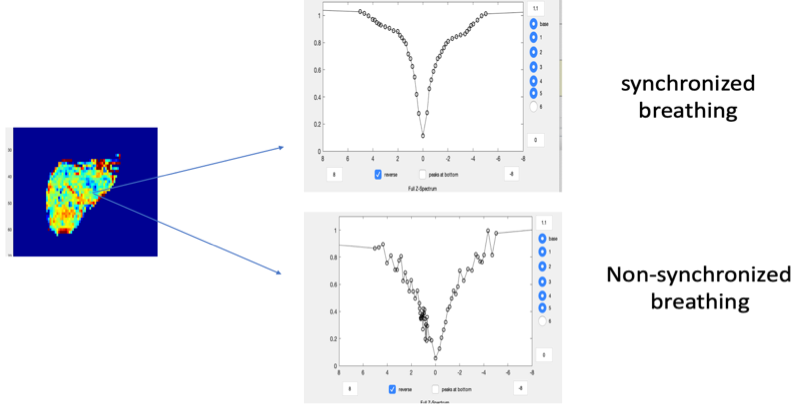
CEST measurements were performed using a 2D fast gradient echo sequence (TE/TR=2.65/15ms; 300x4x379mm3 FOV, 4x4x4mm3 voxel size), using 60-80 sinc saturation pulses of 25ms duration, with a 5-10ms interval, an effective B1 of 1.35, 1.5 μT and 47-65 saturation frequency offsets (-10000 to 10000 ppm; the second protocol containing more offsets around the glycogen frequency). Two volunteers were scanned after giving informed consent, with the different protocols. Both volunteers were breathing freely, and the second volunteer was also asked to synchronize the breathing with the acquisition.
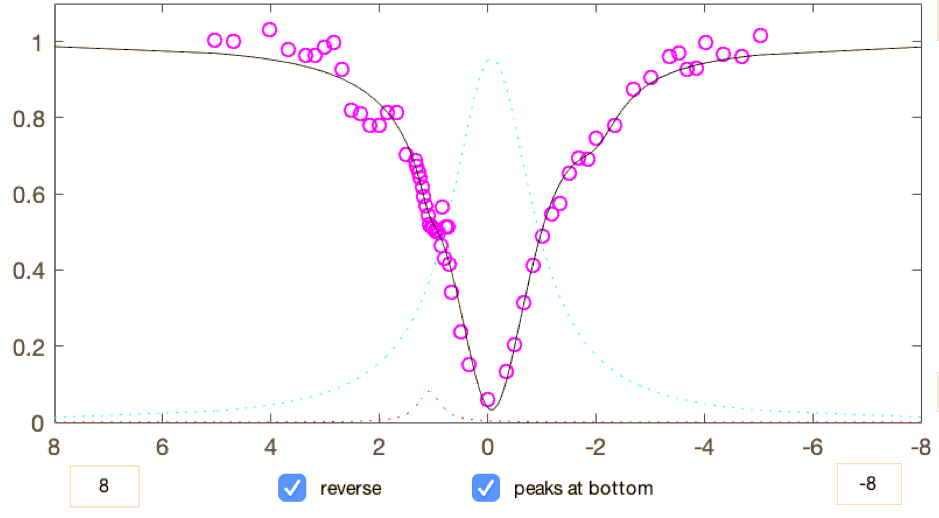
Data analysis was performed with a MATLAB-based free software tool (CEST-sources5) that included f0 corrections and a Multi-Lorentzian 5-pool fitting of water, amides, MT, NOEs and it was adapted to include the glycogen pool. Pixel and regions of interest (ROI) analysis were obtained where the B1+ was around 100%.
Results
Figure 1(a) shows the Z-spectra from a region of interest (ROI) in the liver, highlighting the differences in the CEST effect related to the quantity of offsets in the frequency region of glycogen [200-400 Hz]. With 47 offsets, we acquired 5 points between 200 and 400 Hz and with 65 offsets, we acquired 20 points between those two frequencies. Figure 1(b) shows the Z-spectra acquired with different B1 values for the CEST pre-pulses (1.35μT and 1.5 μT) and Figure 1(c) shows the different Z-spectra obtained by applying 60 and 80 saturation pulses. Figure 2 shows a comparison between a free breathing acquisition and synchronized breathing in between the acquisitions. The protocol used with 65 offsets, 60 saturation pulses, a B1 of 1.5 μT, and the synchronized breathing showed the stronger glycoCEST effect. Fitted Lorentzian curves are shown in Figure 3.Discussion
At 7T, differentiation of the glycoCEST effect from the direct saturation effect of the water signal seems to be possible in the liver in vivo. In addition, a first optimization towards measuring glycoCEST effects in the liver has shown that more offsets need to be included around the glycogen resonance. Furthermore, about 60 sinc saturation pulses are needed as well as a moderate B1 for the saturation pulses. As observed from the measurements, in-vivo glycoCEST effects can be measured when respiration is being triggered to the measurement as it is sensitive to breathing artifacts.Conclusion
We have demonstrated that in-vivo liver glycoCEST can be detected in the human liver by using a CEST acquisition at 7T. The parameters can be further optimized to obtain a stronger glycoCEST effect.Acknowledgements
This publication has received funding from Millenium Science Initiative of the Ministry of Economy, Development and Tourism, grant Nucleus for Cardiovascular Magnetic Resonance, from CONICYT, PIA-ACT1416, CONICYT-PCHA/Doctorado Nacional/2016-21160835 and FONDECYT 1180525References
[1] Wolfsdorf JI, Weinstein DA (2003) Rev Endocr Metab Disord 4:95–102.
[2] Gruetter R, et al. (1994) Magn Reson Med 31:583–588.
[3] Van Zijl, P. et al. (2007) PNAS 104(11):4359-4364.
[4] A.J.E. Raaijmakers et al. (2016) Magn Reson Med 75, 1366-1374.
[5] CEST-Sources (2018, october 20), retrieved from cest-sources.org.
Figures