3984
Bayesian fitting of Chemical Exchange Saturation Transfer (CEST) imaging data with an analytical model for multiple CEST pools1Brain Repair and Rehabilitation, University College London, London, United Kingdom, 2Max-Planck institute for biological cybernetics, Tübingen, Germany
Synopsis
A Bayesian fitting algorithm was combined with an analytical solution of the Bloch-McConnell equations for multiple CEST pools. The performance of the suggested fitting approach was evaluated in simulated and phantom experiments. Specifically, the application to Taurine-Creatine solutions which exhibit overlapping resonance peaks in the Z-spectrum was investigated. Although the analytical solution introduced biases into the estimated parameters, the estimated exchange rates correlated with the pH of the solutions. Hence, this approach can be applied to detect pH differences based on exchange rate estimates in the case of overlapping resonance peaks in the Z-spectrum.
Introduction
Chemical Exchange Saturation Transfer (CEST) imaging is a contrast mechanism for molecular imaging with high sensitivity. Bayesian fitting has previously been proposed as an advantageous alternative to traditional least square fitting of Bloch-McConnell (BM) equations to CEST data and has successfully been applied to process in-vivo data using a numerical approach to solve the BM equations [1,2,3]. However, increased processing time constitutes the biggest disadvantage and can take several hours per slice on typical laptop processors. Recently, we presented the advantages of using an analytical 2-pool model in a Bayesian fitting algorithm [6]. Here, we extend this approach with a model that includes multiple CEST pools, specifically addressing overlapping resonance peaks, which are typically encountered in in-vivo measurements.Methods
A Variational Bayesian (VB) algorithm [3] has previously been successfully applied based on numerical solutions of the BM equations [2]. Here, the numerical solution was replaced by an analytical solution for a train of saturation pulses [5]:
$$Z(n) = (Z_i-Z_{ss})e^{-R_{1a}t_d n}e^{-R_{1\rho}t_p n}+Z_{ss}$$
with number of pulses $$$n$$$, pulse duration $$$t_p$$$, inter-pulse delay $$$t_d$$$, longitudinal relaxation rate of water $$$R_{1a}$$$, “spin-locked” relaxation rate $$$R_{1\rho}$$$, steady-state magnetization $$$Z_{ss}$$$, and initial magnetization $$$Z_i$$$. To extend this model for multiple CEST pools, it was assumed that $$$R_{1\rho}$$$ is the sum of individual contributions $$$R_{1\rho,i}$$$ from CEST pools $$$i=a,b,c,...$$$ , and that the recovery of each CEST pool towards equilibrium during the delays is unaffected by the presence of other CEST pools.
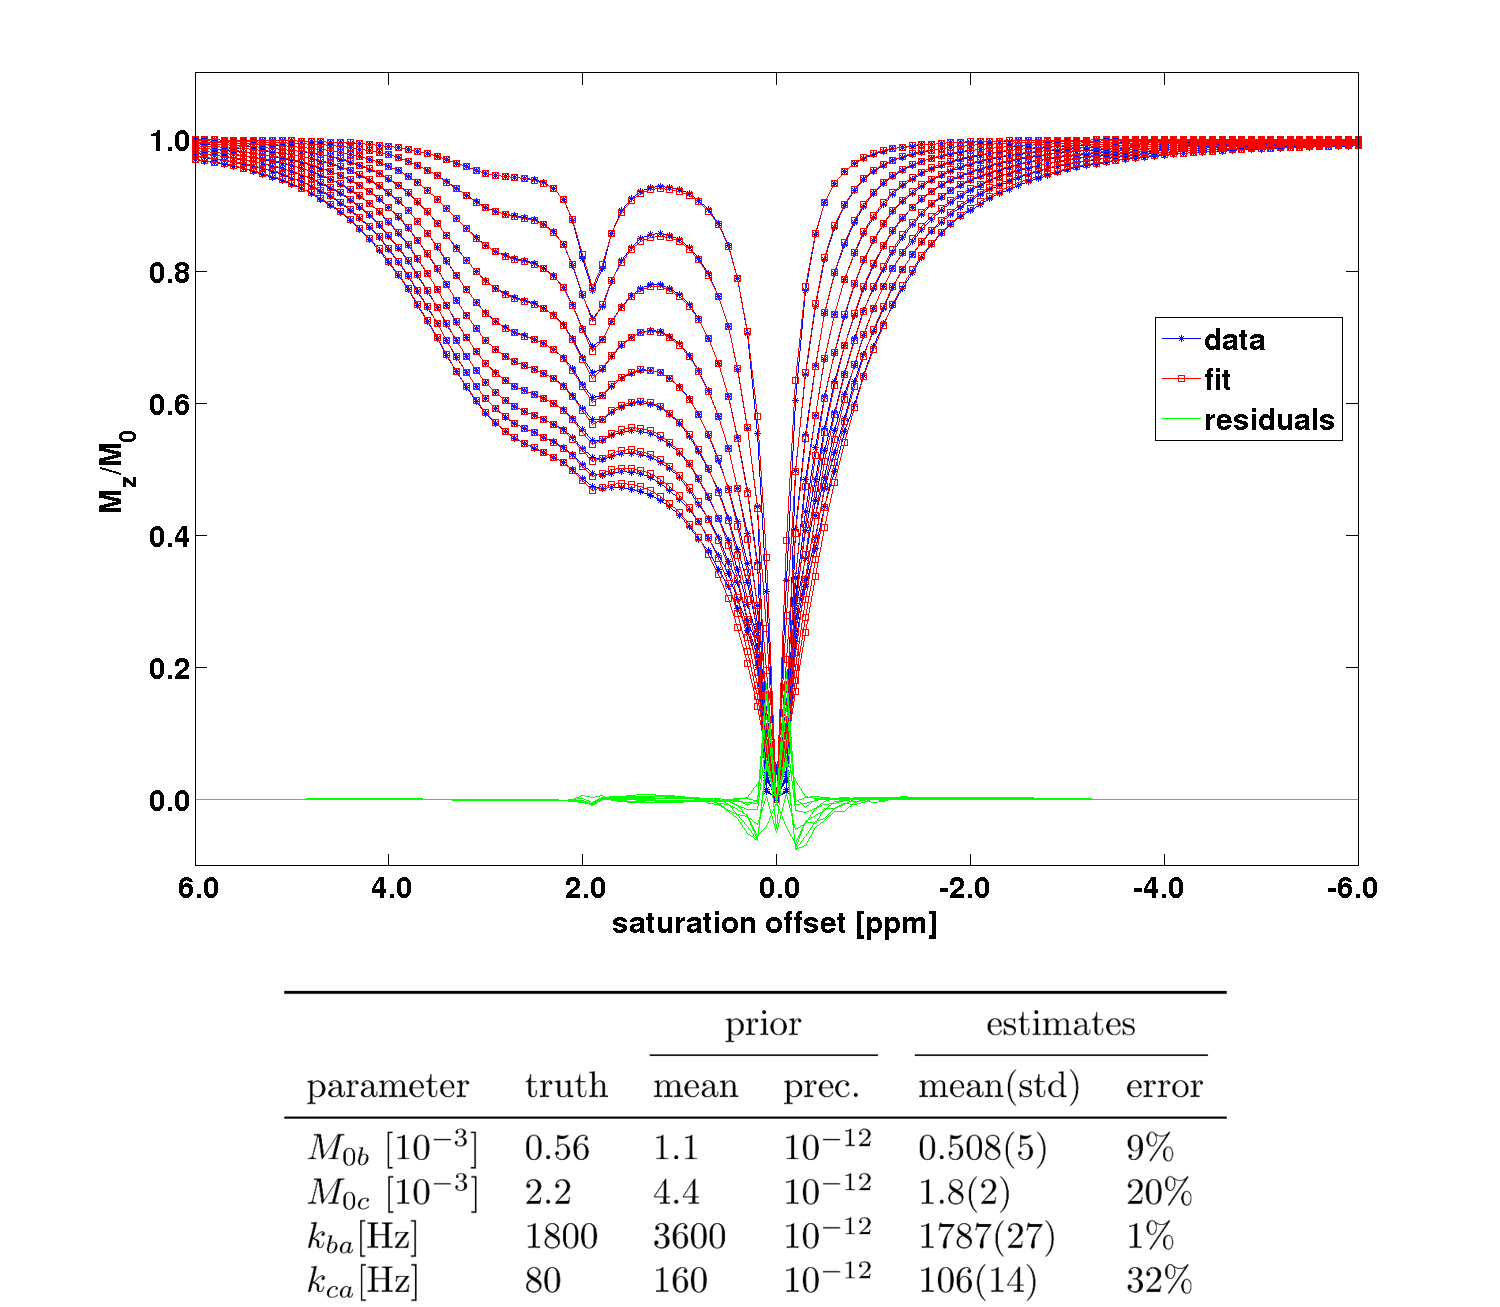
To assess the validity of the model and the convergence of the algorithm CEST-spectra of a Taurine (pool $$$b$$$) and Creatine (pool $$$c$$$) in water (pool $$$a$$$) solution ($$$M_{0a}=1$$$, $$$M_{0b}=0.00056$$$, $$$M_{0c}=0.0022$$$, relaxation times $$$T_{1a}=2.5$$$s, $$$T_{2a}=2.2$$$s, $$$T_{1b}=T_{1c} = 1.0$$$s, $$$T_{2b}=T_{2c} = 15$$$ms, resonance frequency offsets $$$\Delta\omega_b = 3.0$$$ppm, $$$\Delta\omega_c = 1.9$$$ppm, exchange rates $$$k_{ba} = 1800$$$Hz, $$$k_{ca} = 80$$$Hz) were simulated by numerical evaluation of the BM-equations and subsequently fitted using the suggested Bayesian approach.
The saturation scheme consisted of 151 Gaussian-shaped pulses of 0.05s duration with a duty cycle of $$$ DC = 0.98$$$ . The average saturation amplitude was varied ($$$B_1 = 0.78, 1.17, 1.57, 1.96, 2.35, 2.74, 3.13, 3.52, 3.91, 4.31$$$μT).
A 25mM Taurine and 50mM Creatine in 0.1% PBS phantom was prepared and titrated to 5 different levels of acidity (pH = 6.18, 6.44, 6.62, 6.82, 7.06). It was measured on a 9.4T animal scanner at varying saturation powers ($$$B_1 = 0.39, 0.78, 1.57, 1.96, 2.35, 2.74, 3.13, 3.52, 3.91, 4.31$$$μT) with the same pulsed saturation scheme as in the simulation experiment, temperature = 20°C, and 77 equally spaced offsets between −6 and 6ppm. $$$T_1$$$ was determined separately with an inversion recovery sequence. Flat priors were assumed for the fit parameters.
Results
The simulated CEST-spectra and fit results of the VB algorithm with simplified analytical solutions and the estimated parameters can be seen in Figure 1. The fits describe the data well. The errors are larger for the parameters estimated for the slowly exchanging Creatine pool than for the fast exchanging Taurine pool.
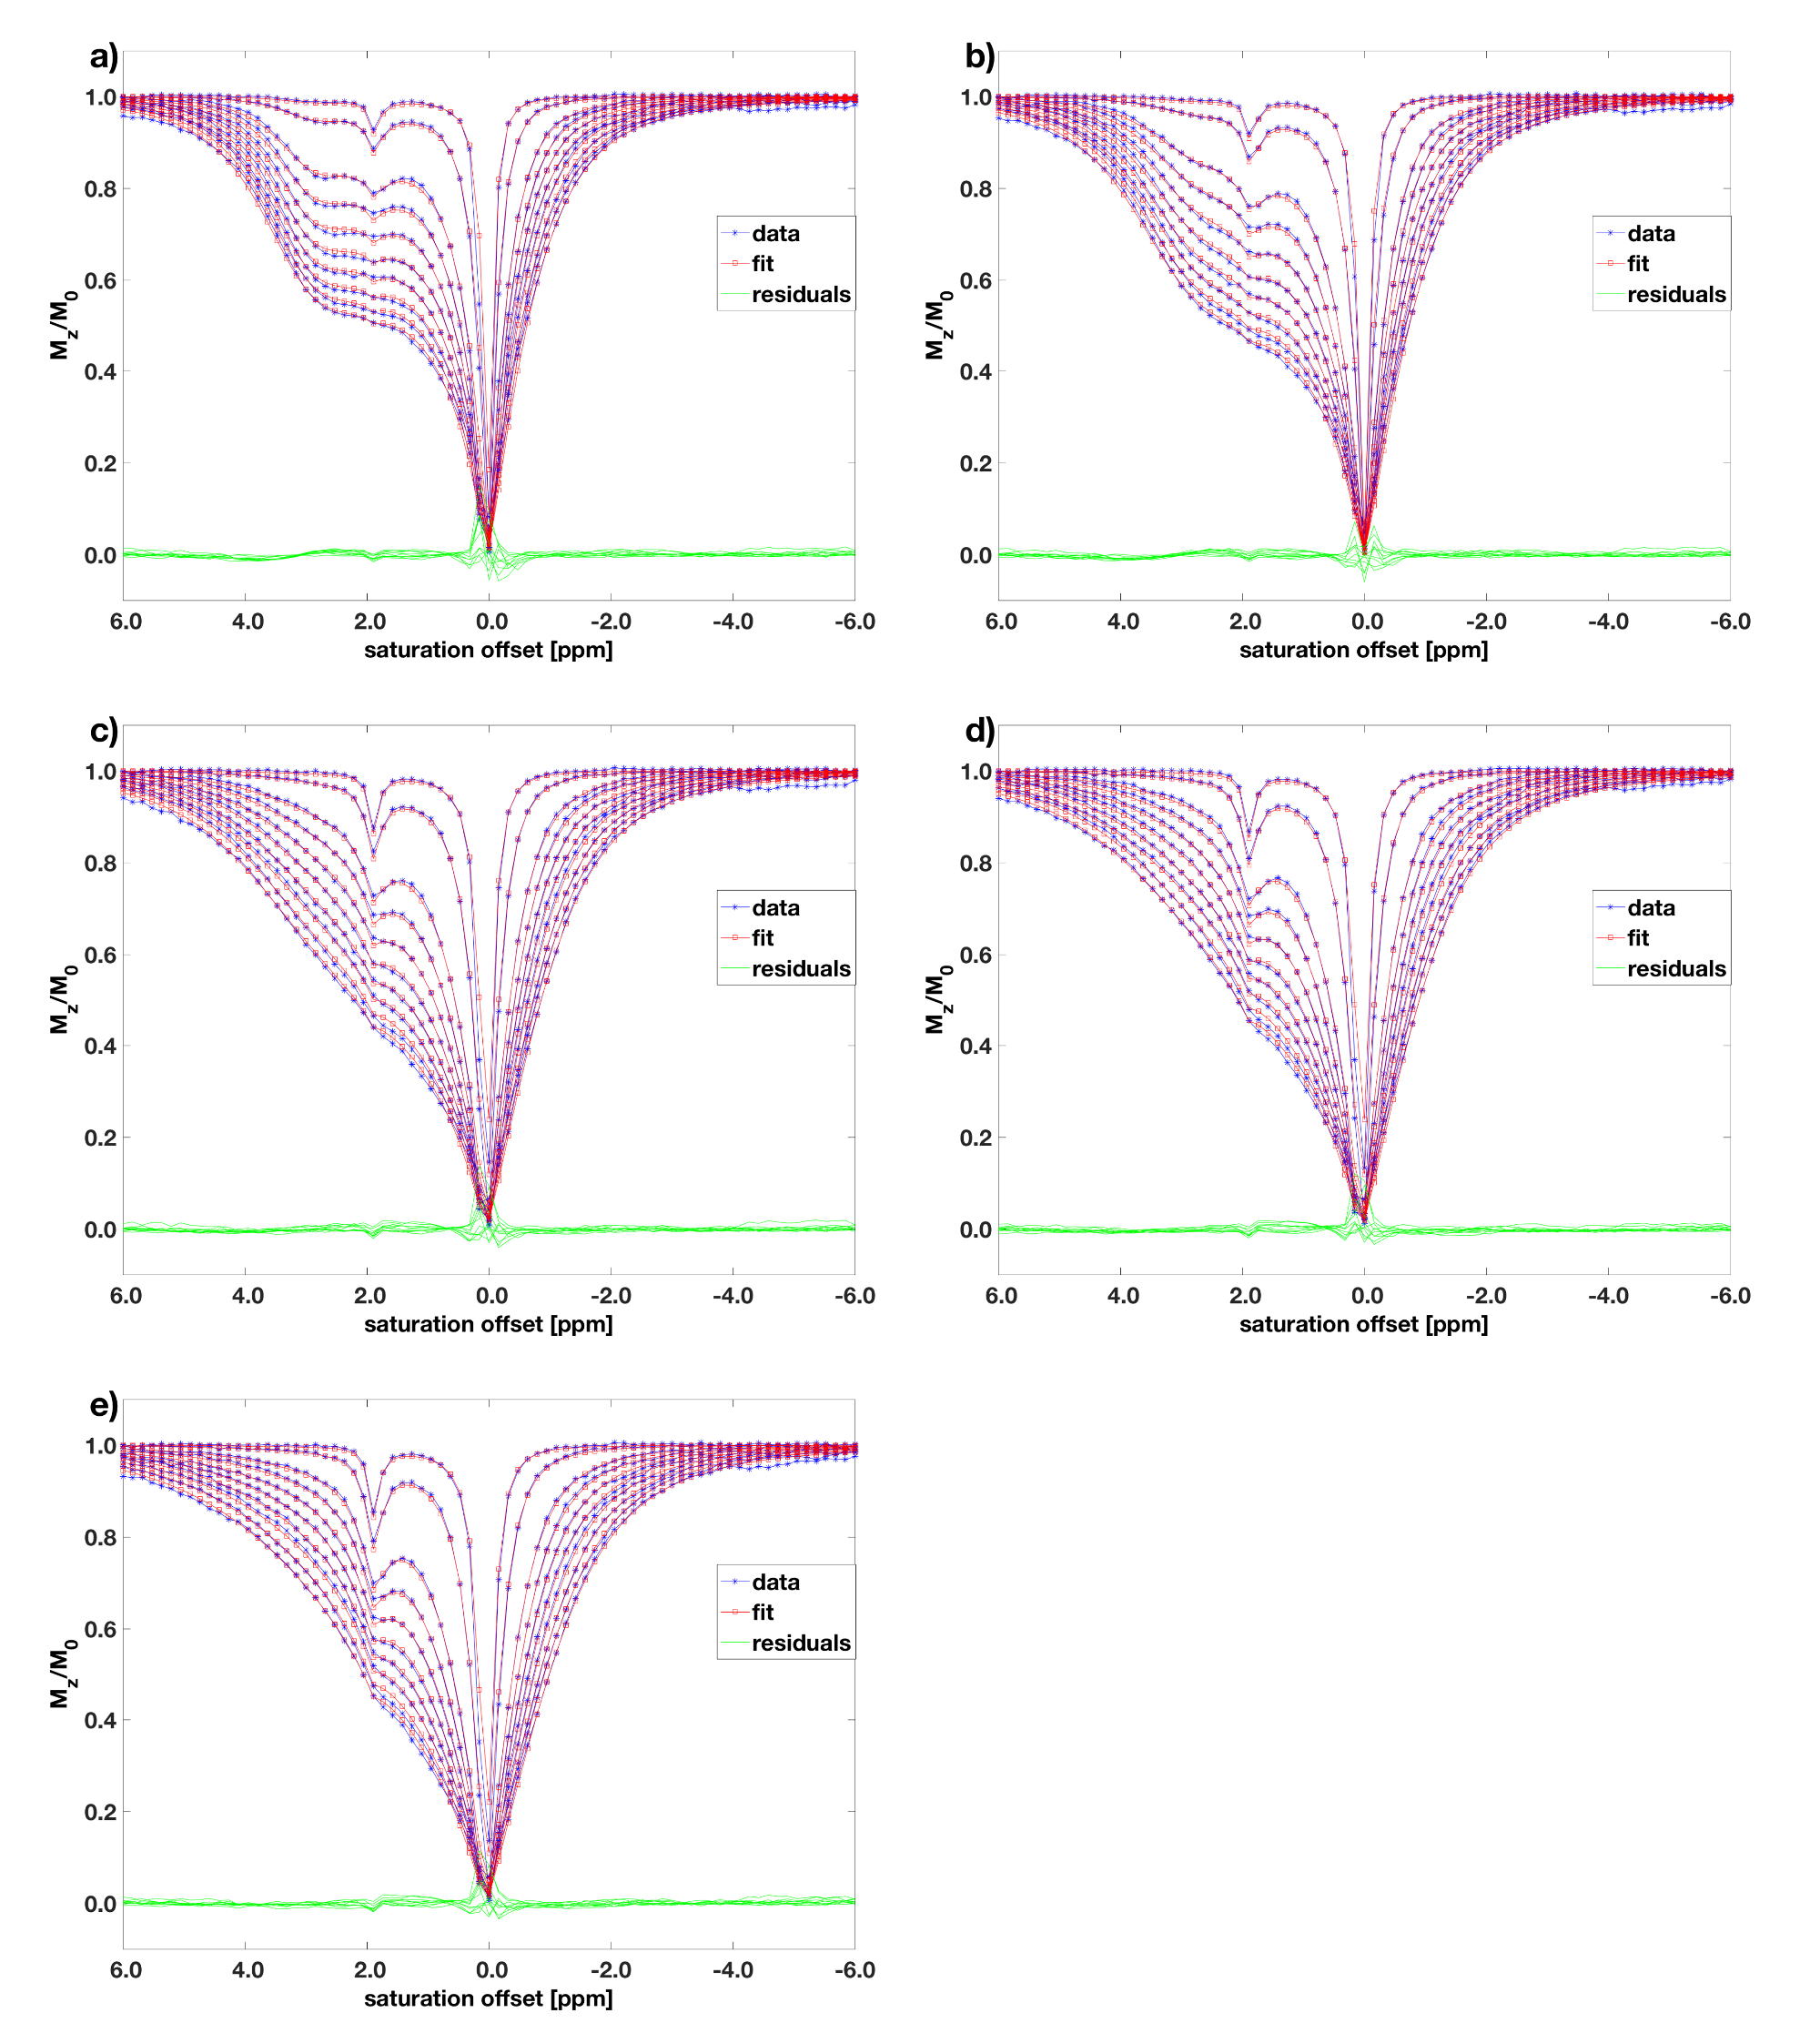
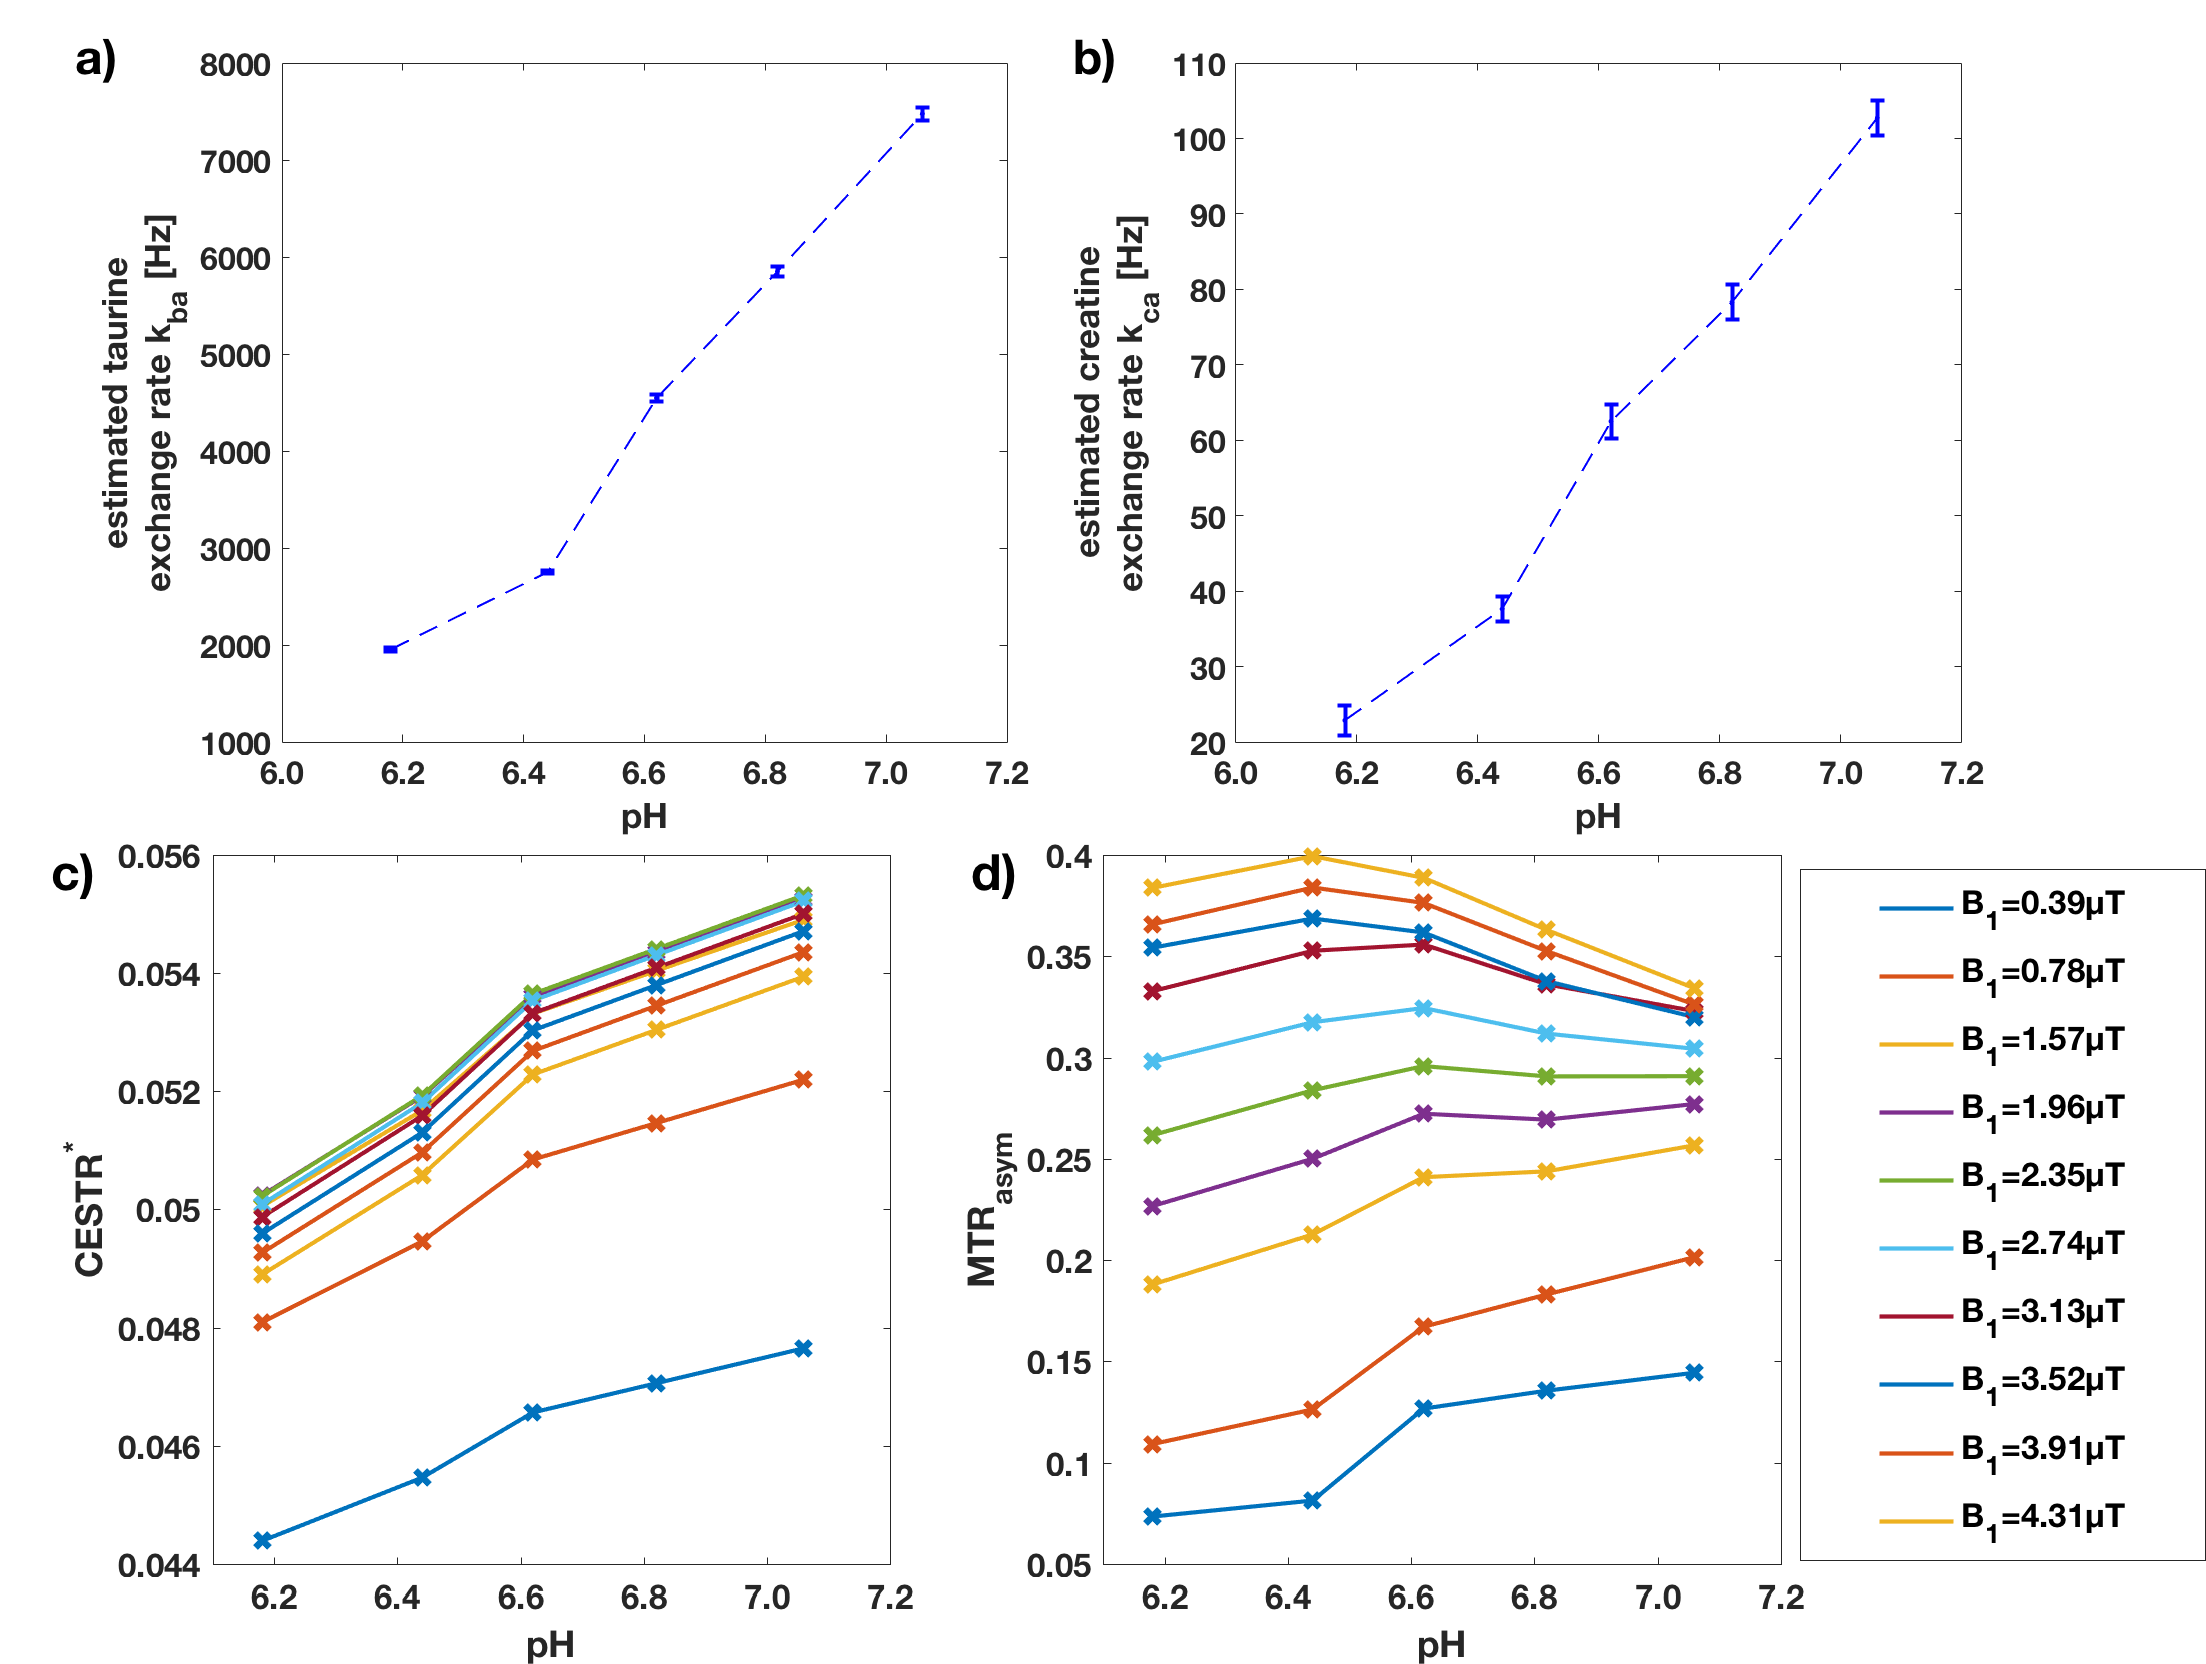
The averaged Z-spectra with overlapping Creatine and Taurine peaks are shown in Figure 2. The parameters $$$M_{0b}$$$, $$$k_{ba}$$$, $$$k_{ca}$$$, and $$$\omega_{0,off}$$$ were fitted with pool $$$b$$$ and $$$c$$$ representing the Taurine and Creatine pools, respectively. $$$T_{1a}=2.5$$$s was fixed according to the inversion recovery measurement. Furthermore, the Taurine and Creatine peaks were located at 2.96ppm and 1.85ppm, respectively. The measured relationship between exchange rates and pH is plotted in Figure 3, showing an increase of exchange rates of both pools with pH.
Discussion
The simulation experiment shows that the suggested Bayesian fitting approach is capable of determining equilibrium magnetizations and exchange rates from Z-spectra at different saturation powers. However, the observed biases are due to the limitations of the applied analytical model, which result from the approximations with respect to the pulse-shape and the neglecting of CEST-pool interaction during the delays. The advantage over the application of the numerical solution is the reduction of processing time which has previously been shown to be more than 100-fold [6]. Although we expect similar biases in the phantom experiment as observed in the simulation experiment, the phantom experiment shows a clear correlation between pH and estimated exchange rates. This is due to the systematic nature of the biases. Therefore, CESTR*, a metric based on the parameter estimates [2], can be applied to detect pH changes, whereas the overlap of the resonance peaks confounds the conventional metric MTRasym.Conclusion
The suggested Bayesian approach can be applied to detect pH differences based on exchange rate estimates in the case of overlapping resonance peaks in the Z-spectrum, which is an important step towards in-vivo application. The reduction of processing time is crucial in a clinical setting.Acknowledgements
AK is supported by Olea Medical® and the EPSRC-funded UCL Centre for Doctoral Training in Medical Imaging (EP/L016478/1). This project has received funding from the European Union’s Horizon 2020 research and innovation programme under grant agreement No 667510 and the Department of Health’s NIHR-funded Biomedical Research Centre at University College London.References
1. Murase, K.; et al. MRI. 29(1) (2011). 2. Chappell, M. A.; et al. MRM. 70(2) (2013). 3. Chappell, M. A.; et al. IEEE. 57(1) (2009). 4. Zaiss, M.; et al. NMR Biomed. 26(1) (2012). 5. Roeloffs, V.; et al. NMR Biomed. 28(1) (2014). 6. Kujawa, A; et al. ISMRM 2018, p5122.Figures