3983
Estimation of Semi-solid Saturation in Brain White Matter after Composite MT Pulses by Means of Bloch Simulation1AMRI, LFMI, NINDS, NIH, Bethesda, MD, United States
Synopsis
The magnetization level of macromolecular protons (MPs) affects that of water protons through magnetization transfer, a phenomenon that represents a confounding factor in quantitative MRI. Here we investigated whether MP spectral lineshape can be sufficiently accurately modelled by a single Lorentzian, which would facilitate estimating MP magnetization and saturation levels from Bloch simulations and a 2-pool MT model. We compared simulated effects of 10 different composite MT pulses and experimental results from 11 healthy volunteers at 7T. Results demonstrate a good fitting to the observed water signal evolution. Deviation of the simulated initial MP saturation from calculated levels was observed, indicating potentially unaccounted factors such as inhomogeneous MT effects.
Introduction
Macromolecules in the brain white matter are not directly quantifiable by common MR imaging methods due to their short T2. Nevertheless, this invisible pool can significantly modify the evolution of water longitudinal magnetization through magnetization transfer (MT) effects. Unaccounted saturation of the semi-solid by RF irradiation is a potential source of inconsistency in quantitative MRI (1). On the other hand, high-efficiency semi-solid saturation pulses with minimal SAR are desirable for MT-based applications, such as myelin quantification. Therefore, it is important to be able to estimate semi-solid saturation due to specific RF pulses and to evaluate their delayed effects on water.
The spectrum of semi-solid pool is best characterized by a super-Lorentzian lineshape (2). However, there is no rigorous way to simulate super-Lorentzian in the time domain. Yet it has been reported that a single-Lorentzian with T2,ss = 65 μs and Δfss = -727 Hz fits the spectrum reasonably well (R2 = 0.94) (3). In this study, we investigated the feasibility of using a single isochromat to characterize the semi-solid pool during and after RF irradiation.
Methods
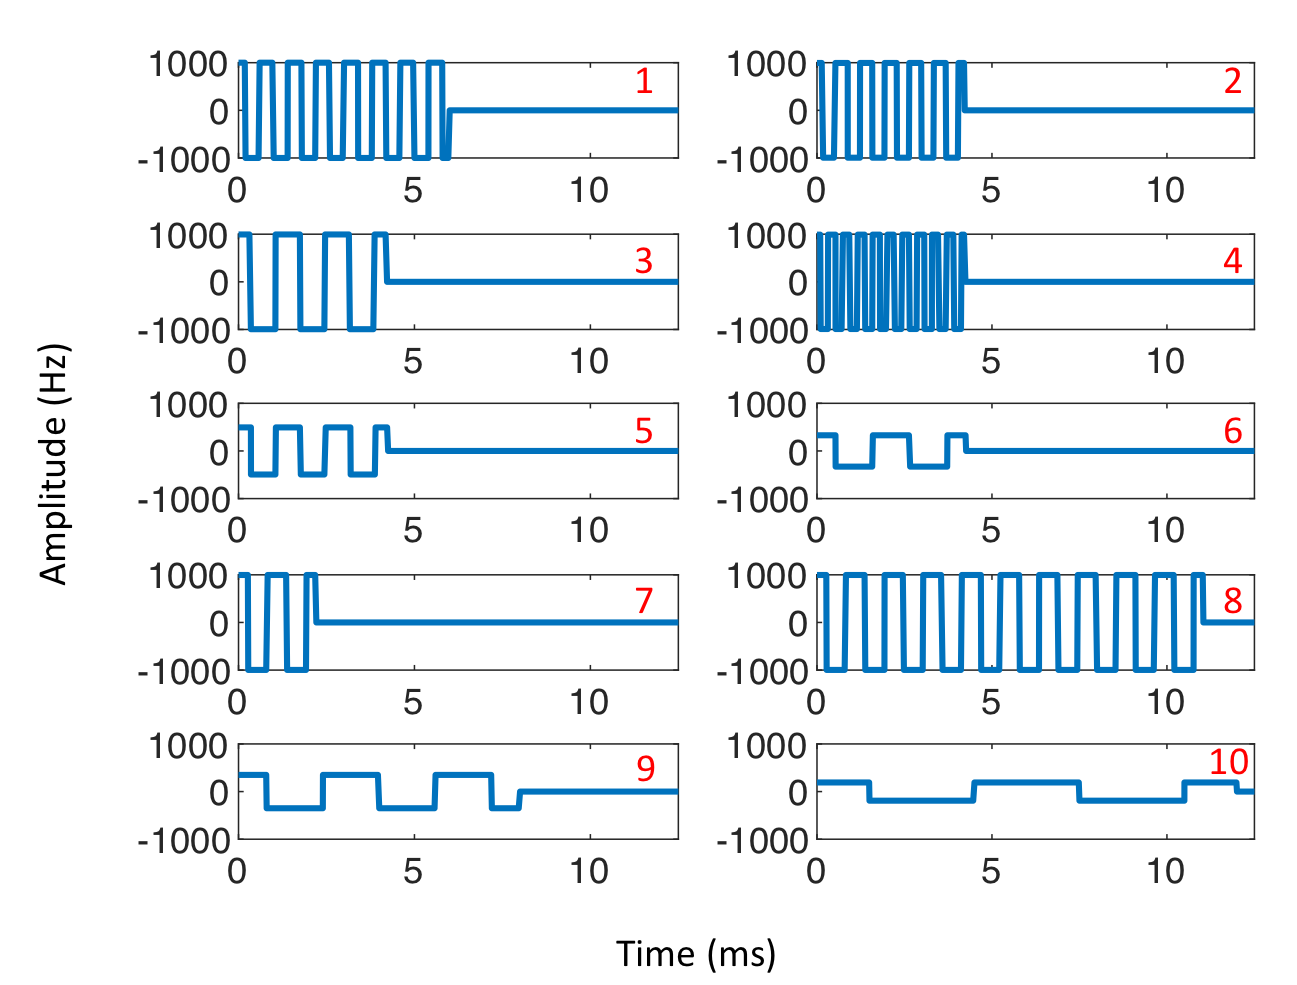
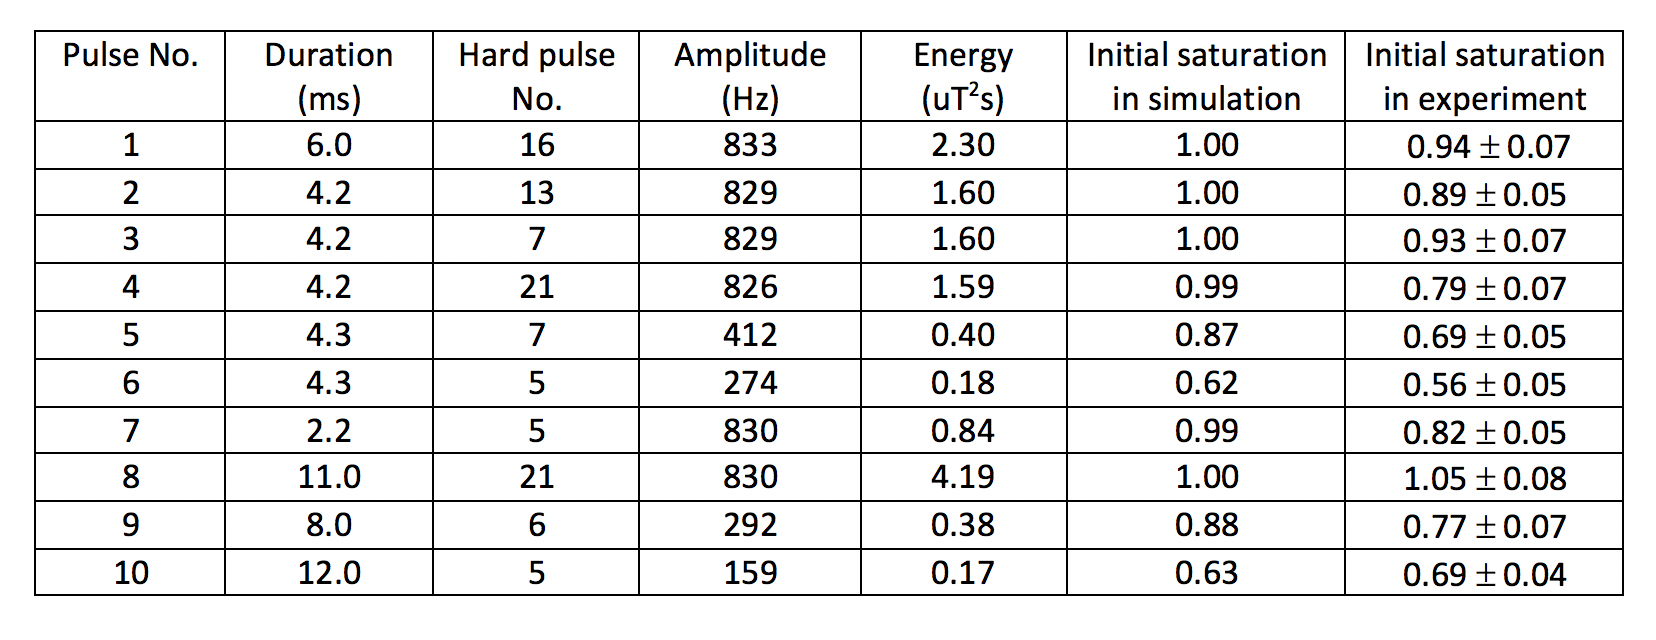
Simulations In rotating frame, two-pool Bloch equations of the longitudinal magnetizations are$$\begin{multline}\shoveleft \frac{dM_{z,ss}}{dt}=(f-M_{z,ss})R_{1,ss}-2\pi B_1M_{y,ss}-\frac{k}{f}M_{z,ss}+\frac{k}{1-f}M_{z,w}\tag1\end{multline}$$$$\begin{multline}\shoveleft \frac{dM_{z,w}}{dt}=(1-f-M_{z,w})R_{1,w}-2\pi B_1M_{y,w}-\frac{k}{1-f}M_{z,w}+\frac{k}{f}M_{z,ss}\tag2\end{multline}$$assuming B1 is applied along x direction; f is the semi-solid fraction, assumed to be 24%; k is the exchange rate, assumed to be 1.45 s-1; R1,ss and R1,w are assumed to be 2.0 s-1 and 0.4 s-1, respectively (1). The transverse components can be described in a similar fashion with assumed parameters T2,w = 40 ms, T2,ss = 65 μs and Δfss = -727 Hz. Ten on-resonance composite MT pulses were examined, which share a common feature of eventually returning water magnetization back to z direction (Figure1 and Table1). Time discretization of the simulations was 10 ns during RF irradiation and 2 μs afterwards. Saturation of water and semi-solid was calculated using $$$S(t)=1-\frac{M_z(t)}{M_z(\infty)}$$$.
Experiments Eleven healthy volunteer were recruited for experiments at Siemens 7 T MRI. The image protocol generally follows the framework described in (3). In brief, MT data were acquired at five delay times (8, 62, 137, 256 and 600 ms) using single-shot EPI after the preparation pulse. Five slices parallel to AC-PC line were acquired using 240×180 mm2 FOV, 144×108 in-plane resolution, 2.0 mm thickness and 1.5 mm separation. These five slices corresponded to each delay time and were cycled over repetitions. Other parameters were TR 3 s, TE 24 ms, SENSE acceleration rate 2, repetition 10 including the first 2 as references. The splenium of corpus collosum was manually contoured and the averaged signal inside this ROI was used for analysis for each subject. Water saturation was calculated using $$$S(t)=1-\frac{M_{roi}(t)}{M_{ref}}$$$. The averaged transient saturation over subjects was fitted to a bi-exponential curve $$$S(t)=a_1e^{-\lambda_1}+a_2e^{-\lambda_2}$$$ and compared to the simulation. Data from each subject was also fitted to a bi-exponential curve individually, and the initial saturation (at the end of each RF pulse) was estimated using the analytical solution of the two-pool model$$\begin{multline}\shoveleft S_{0,w}(t)=a_1+ a_2\tag3\end{multline}$$
$$\begin{multline}\shoveleft S_{0,ss}(t)=\frac{-\lambda_1+R_{1,w}+k/(1-f)}{k/(1-f)}a_1+\frac{-\lambda_2+R_{1,w}+k/(1-f)}{k/(1-f)}a_2\tag4\end{multline}$$
Results & Discussions
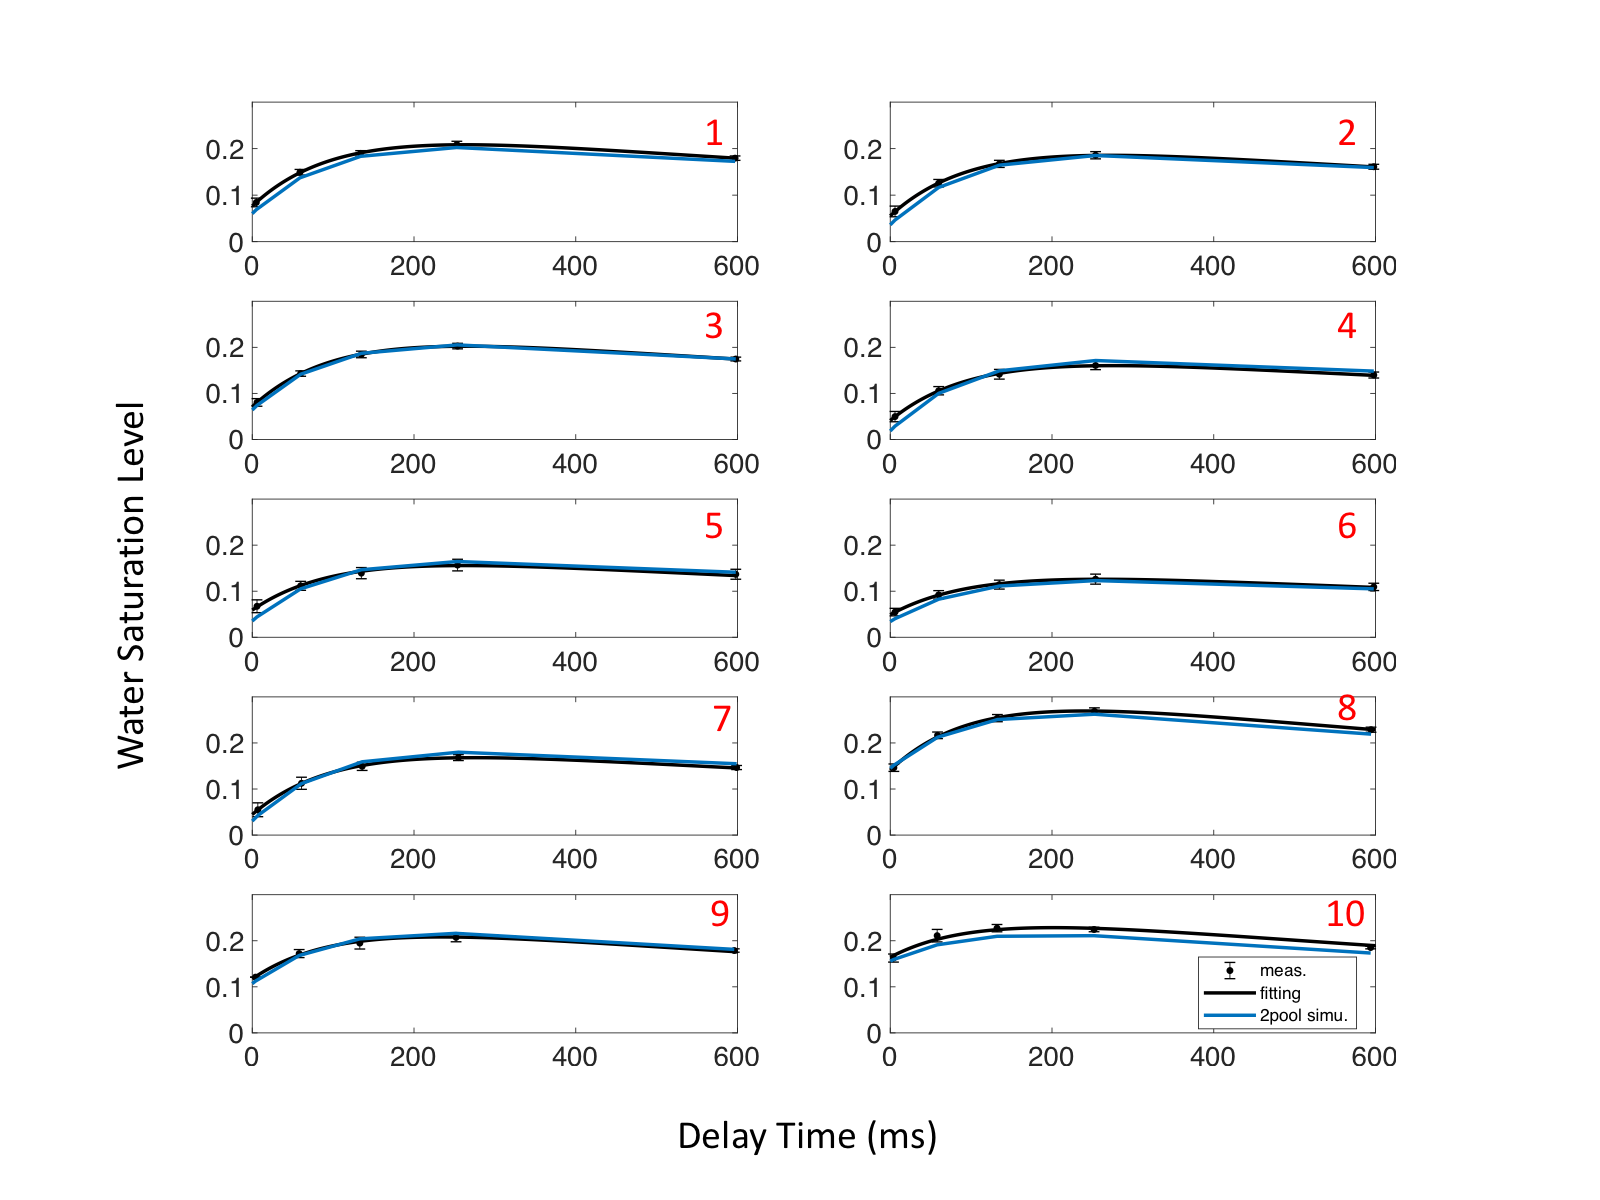
Transient water saturation curves are shown in Figure2. All curves are characterized well using a bi-exponential fit (R2 = 0.998). In addition, simulation results using the assumed parameters are in good agreement with the experimental data (R2 = 0.966).
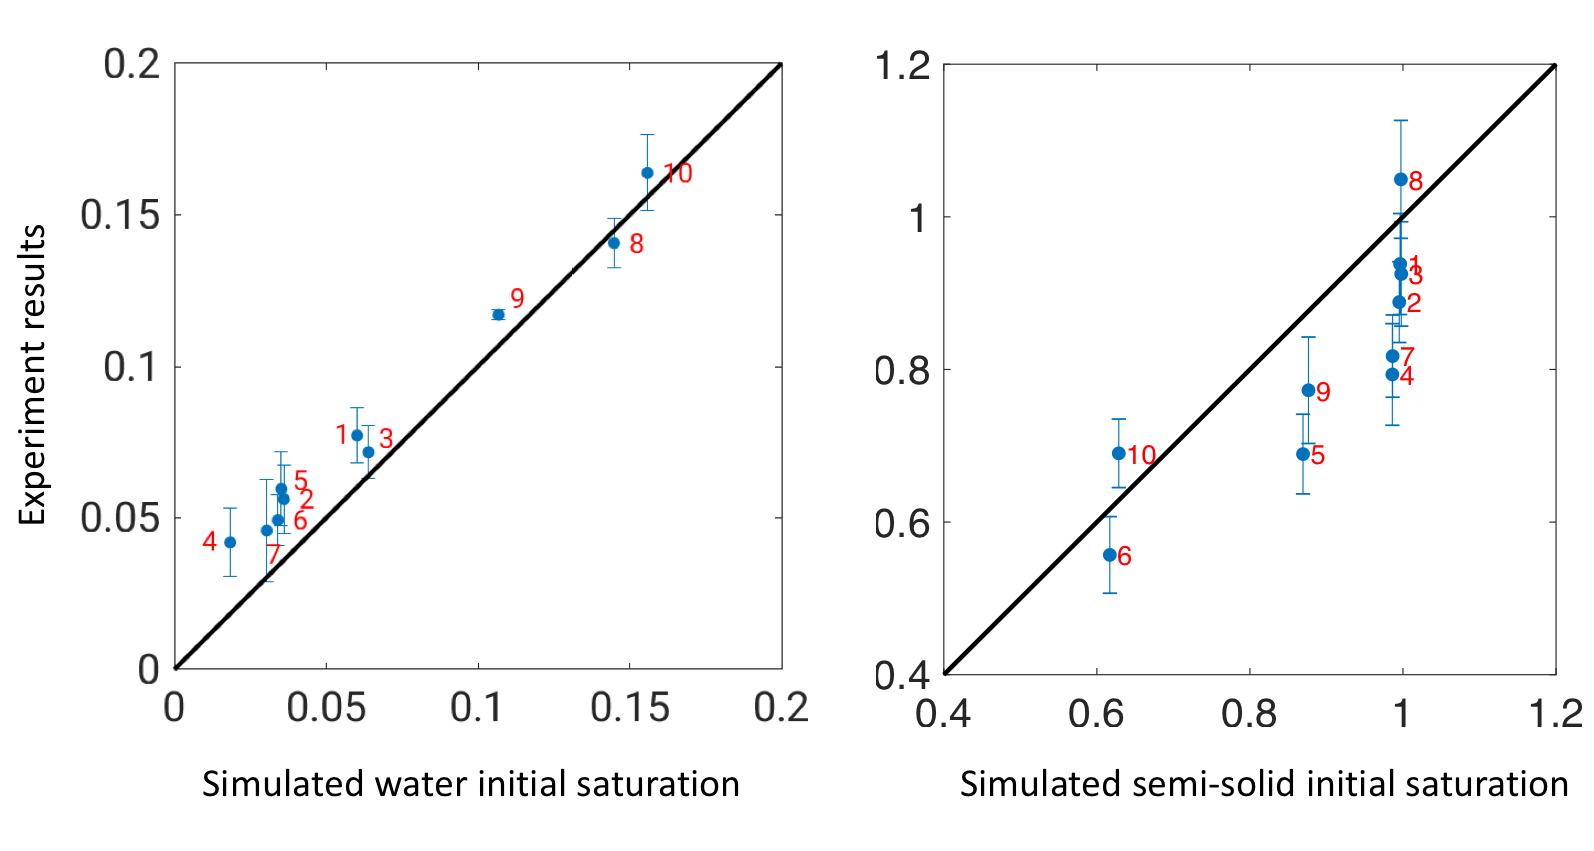
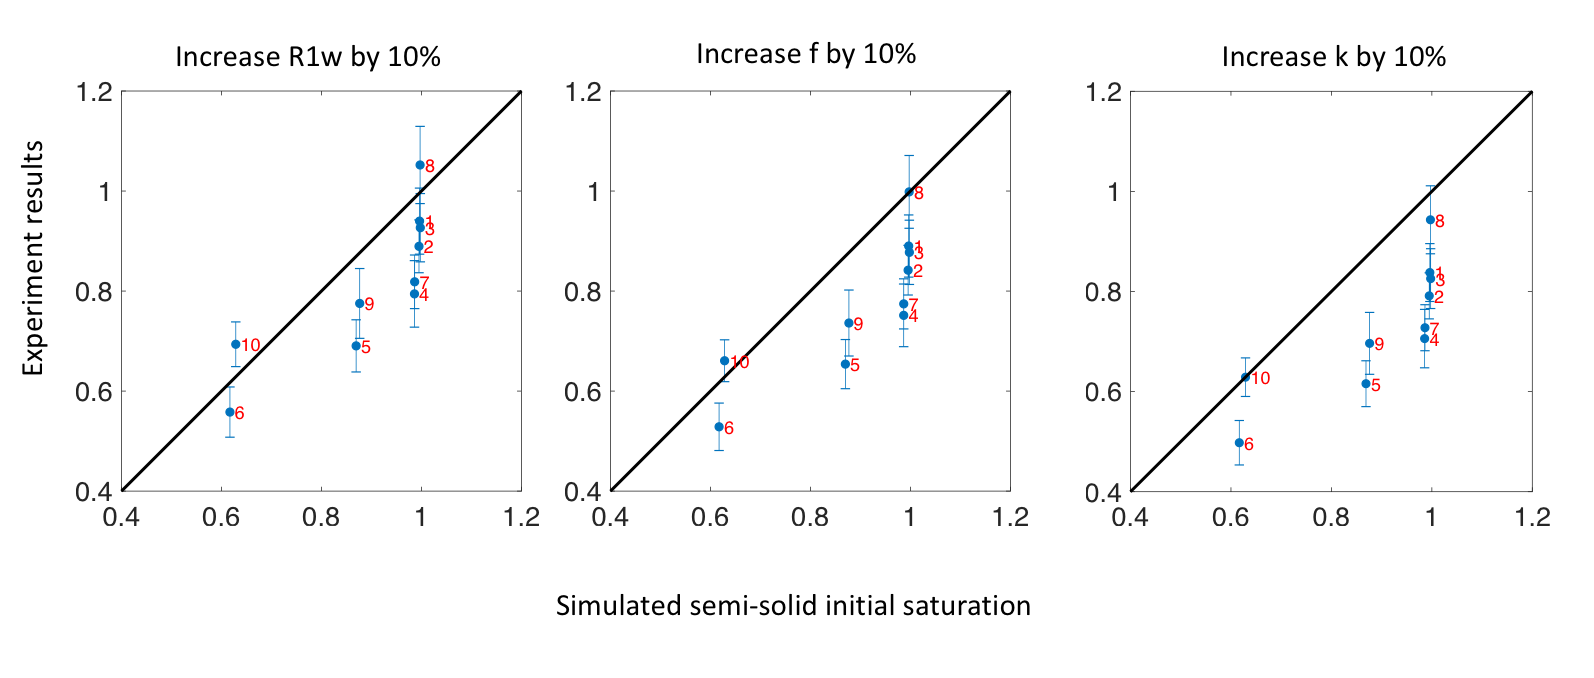
Comparison of initial saturation levels from experiment and simulation is shown in Figure3. For water pool, a good linear relationship is observed with a slight overestimation from the simulation approach. For semi-solid pool, even though a positive correlation is readily observed, there is no clear linearity. For high-energy pulses, simulation predicts entire saturation of the semi-solid pool while experimental results suggest otherwise. To evaluate the effects of parameters, R1,w, k and f were changed by 10% in turns. No significant change in data pattern is observed, indicating insensitivity to the exact choice of parameters (Figure4).
Sources of the discrepancy between simulation and measurement may be two-fold. Firstly, the macromolecules may be overly simplified by the two-pool model with a single T2 when evaluating their behavior under RF irradiation. Effects such as inhomogeneous MT and/or modelling of super-Lorentzian lineshape may be essential ingredients for this purpose. Secondly, calculation of initial semi-solid saturation using Eq.(4) implicitly assumes an underlying two-pool model, which may be too simple to reflect the complex environment of in-vivo brain white matter.
Conclusion
Delayed effects of common MT composite hard pulses on water can be estimated with high accuracy and robustness using two-pool Bloch equations and the assumption of a single semisolid isochromat. However, only rough estimation of semisolid initial condition is feasible using this model. More sophisticated models are needed to provide exact saturation levels right after the pulse and a full accounting for MT effects during MRI.Acknowledgements
This work has been supported by the Intramural program of NINDS.References
1. van Gelderen P, Jiang X, Duyn JH. Effects of magnetization transfer on T1 contrast in human brain white matter. NeuroImage 2016;128:85–95 doi: 10.1016/j.neuroimage.2015.12.032.
2. Morrison C, Henkelman RM. A Model for Magnetization Transfer in Tissues. Magn. Reson. Med. 1995;33:475–482 doi: 10.1002/mrm.1910330404.
3. Jiang X, van Gelderen P, Duyn JH. Spectral characteristics of semisolid protons in human brain white matter at 7 T. Magn. Reson. Med. 2017;78:1950–1958 doi: 10.1002/mrm.26594.
4. Henkelman RM, Stanisz GJ, Graham SJ. Magnetization transfer in MRI: a review. NMR Biomed. 2001;14:57–64 doi: 10.1002/nbm.683.
5. van Gelderen P, Duyn JH. White matter intercompartmental water exchange rates determined from detailed modeling of the myelin sheath. Magn. Reson. Med. 2018;0 doi: 10.1002/mrm.27398.
Figures