3981
Optimizing Neuromelanin-sensitive Turbo Spin Echo sequences using the extended phase graph formalism including magnetization transfer effects1ISR-Lisboa/LARSyS and Department of Bioengineering, Instituto Superior Técnico - Universidade de Lisboa, Lisbon, Portugal, 2Centre for the Developing Brain, School of Biomedical Engineering and Imaging Sciences, King's College London, London, United Kingdom, 3Biomedical Engineering Department, School of Biomedical Engineering and Imaging Sciences, King's College London, London, United Kingdom
Synopsis
Neuromelanin(NM)-sensitive imaging detects contrast differences due to magnetization transfer (MT) effects. We aimed to evaluate the value of adding preparation inversion pulses (IR) to multi-slice turbo spin echo (MS-TSE) sequences, using the recently introduced extended phase graphs with MT effects framework. Simulation results were in agreement with experimental phantom data. The MT contrast could be increased using IR MS-TSE sequences and these results were confirmed in vivo, with improved detectability of the substantia nigra. The next step will be to test the use of this type of sequences in the clinic, finding the optimal tradeoff between contrast and signal-to-noise ratio.
Introduction
Neuromelanin (NM)-sensitive imaging sequences1 have been used in an attempt to characterize the spatial distribution of NM-containing neurons in vivo. A decrease in the hyperintense Substantia Nigra (SN) area in Parkinson’s Disease (PD) patients1 has been shown; NM-MRI also enables to differentiate between PD and Essential Tremor, another movement disorder2. Initial studies used multi-slice Turbo Spin Echo (TSE) NM-sensitive sequences, relying on incidental magnetization transfer (MT) effects3 to obtain a hyper-intense signal in the SN compared to neighbouring regions as the cerebral crus (CC). Subsequent studies proposed to incorporate dedicated MT preparation pulses into these sequences4. Recently, Trujillo et al. investigated the dependency of the contrast ratio (CRSN) between the SN and CC: $$$CR_{SN}=(I_{SN}-I_{CC})/I_{CC}×100\%$$$ on the frequency offset of MT pulses, reporting an improvement to 21% compared to 10% without MT preparation5. Inversion-recovery (IR) sequences have also been suggested for PD diagnosis6. We hypothesised that IR NM-TSE sequences enable improved SN detectability and tested this with simulations using the recently introduced Extended Phase Graphs framework including MT effects (EPG-X)7, validating the results on an MT phantom. We simulated the obtainable signal for different TSE sequence variants using MT literature values for the SN and CC regions. Finally, we confirmed the improved contrast obtainable with IR TSE in vivo.
Methods
Experiments were performed using a 3T Philips Achieva scanner with an 8-channel head coil.
Phantom scans and simulations
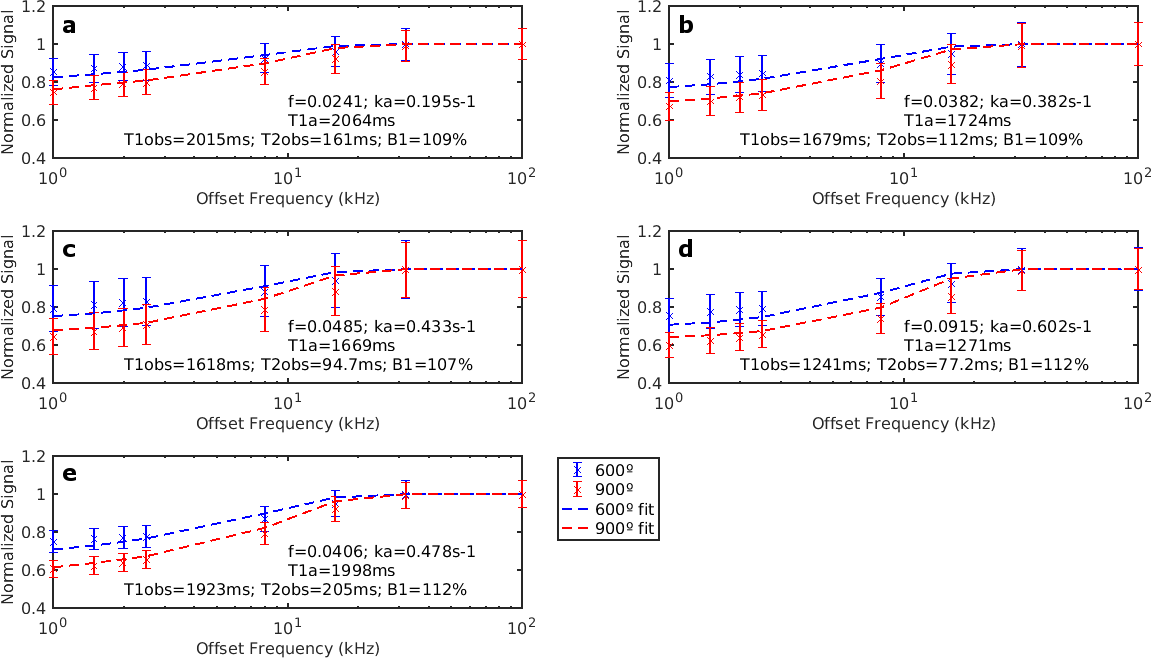
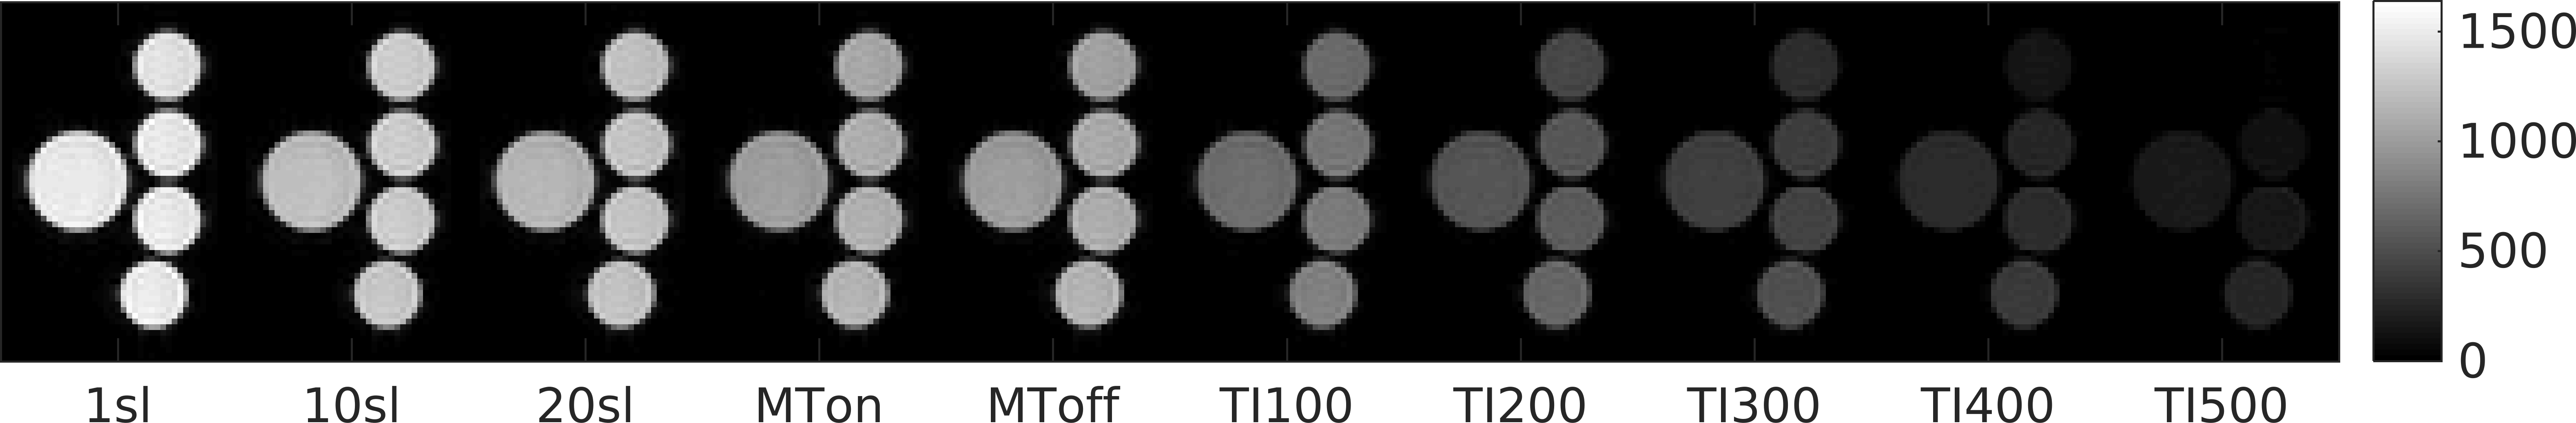
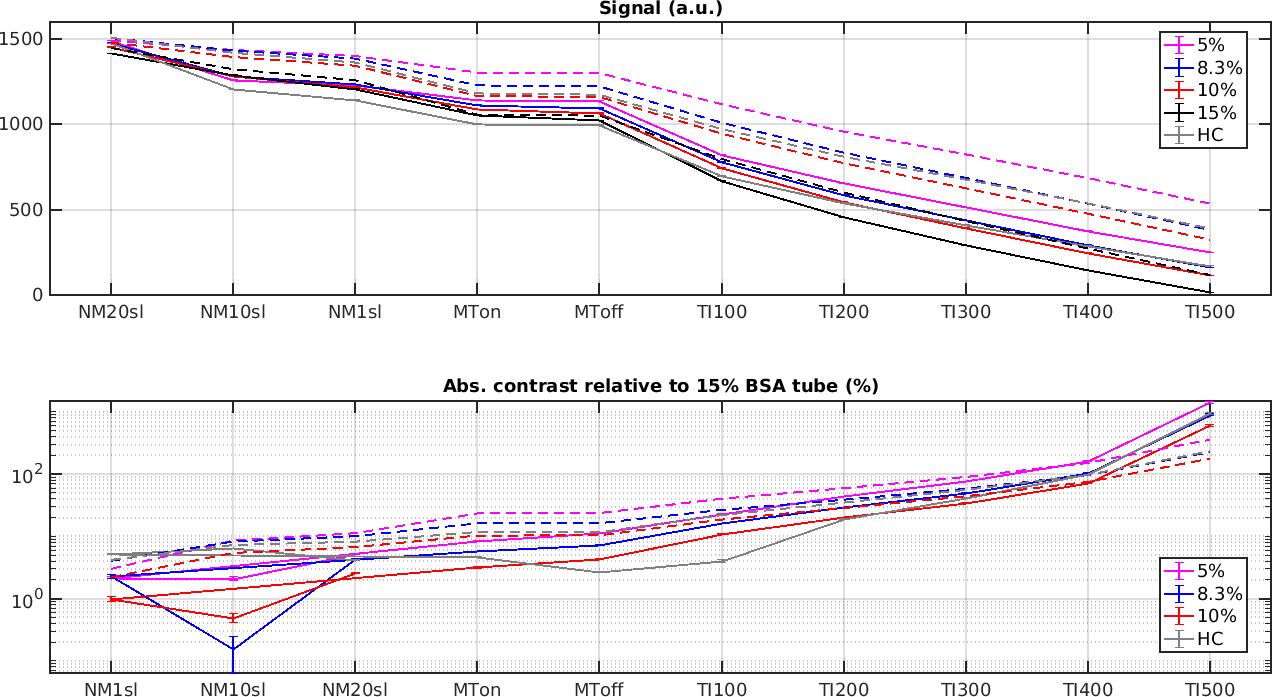
The phantom consisted of five vials: four contained varying concentrations (5%, 8.3%, 10% and 15% by weight) of bovine serum albumin (BSA) to replicate MT effects in human tissue8, and a fifth consisted of hair conditioner, known to display strong MT effects9. Phantom scans included MT-prepared 3D spoiled gradient echo images acquired with eight off-resonance frequencies (1.0, 1.5, 2.0, 2.5, 8.0, 16, 32, 100kHz) for two power levels (600º and 900º flip angles) as in 10, excitation 10º, TE/TR 4.61/47 ms, resolution 1.5×1.5×2.5 mm3, FOV 96×54×50 mm3. MT parameters were estimated using Matlab's 2016b lsqnonlin function considering the model by Yarnykh et al11. TSE images were acquired with matching FOV and resolution using: excitation 90º, TE/TR 10/4000 ms, 4 averages, echo-train length (ETL) of 3. To evaluate incidental MT, the baseline sequence was used to image 20, 10 and 1 slice. Full FOV acquisitions were performed with MT preparation pulses (manufacturer settings: “ON” - MTon and “OFF” - MToff), and several IR variants (inversion times TI of 100:100:500 ms). B1+ mapping was performed using Actual Flip-angle Imaging12. T1obs and T2a were estimated from separate IR (TI of 300, 500, 870, 1500 and 2000 ms) and multi-echo SE scans (8 echoes, 20 ms echo-spacing), respectively. TSE variants were simulated using EPG-X7, using measured MT parameters and accounting for effective B1+.
Brain simulations and in vivo acquisitions
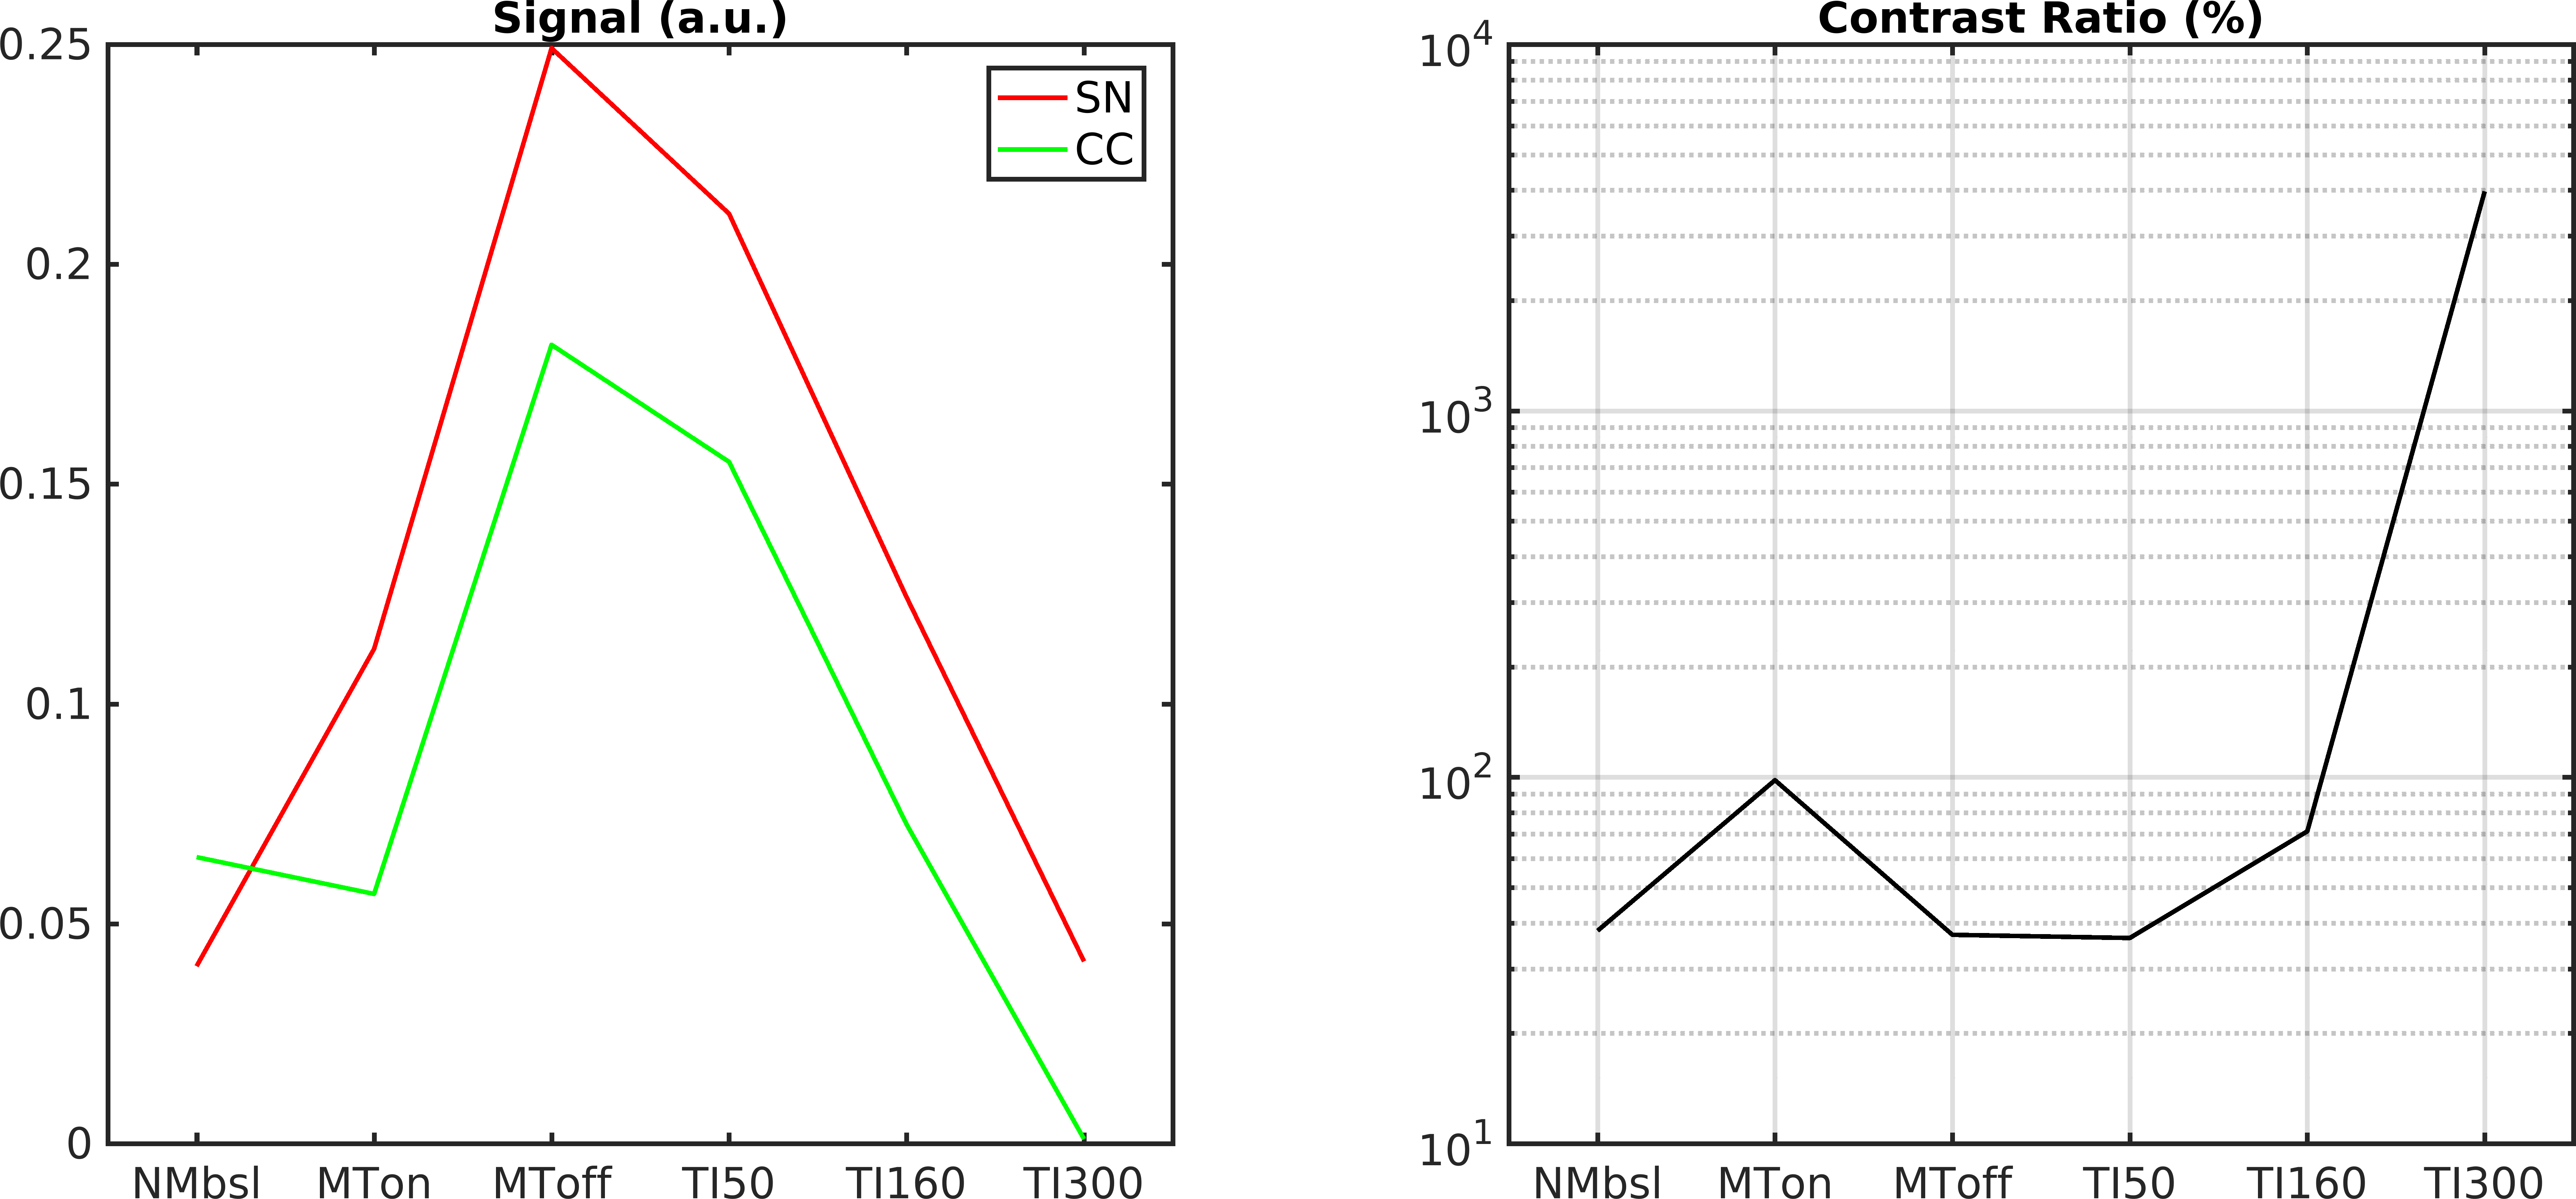
To predict the signal intensities obtained in SN and CC regions, MT parameters reported for healthy controls were used (SN: f=0.104, kb=10.05 Hz, T2a=23.03 ms, T2b=10.36 ms; CC: f=0.145, kb=8.60Hz, T2a=21.76ms, T2b=11.51 ms)10. In vivo TSE acquisitions were performed in 3 healthy young subjects with: 0.6×0.6×2.5 mm3, FOV 220×189×50 mm3, TE 10 ms, ETL 4, 2 averages. Baseline protocol had TR 781 ms, while the TR was 1683 ms for the remaining sequences (MTon, MToff and TI50, 160 and 300 ms).
Results
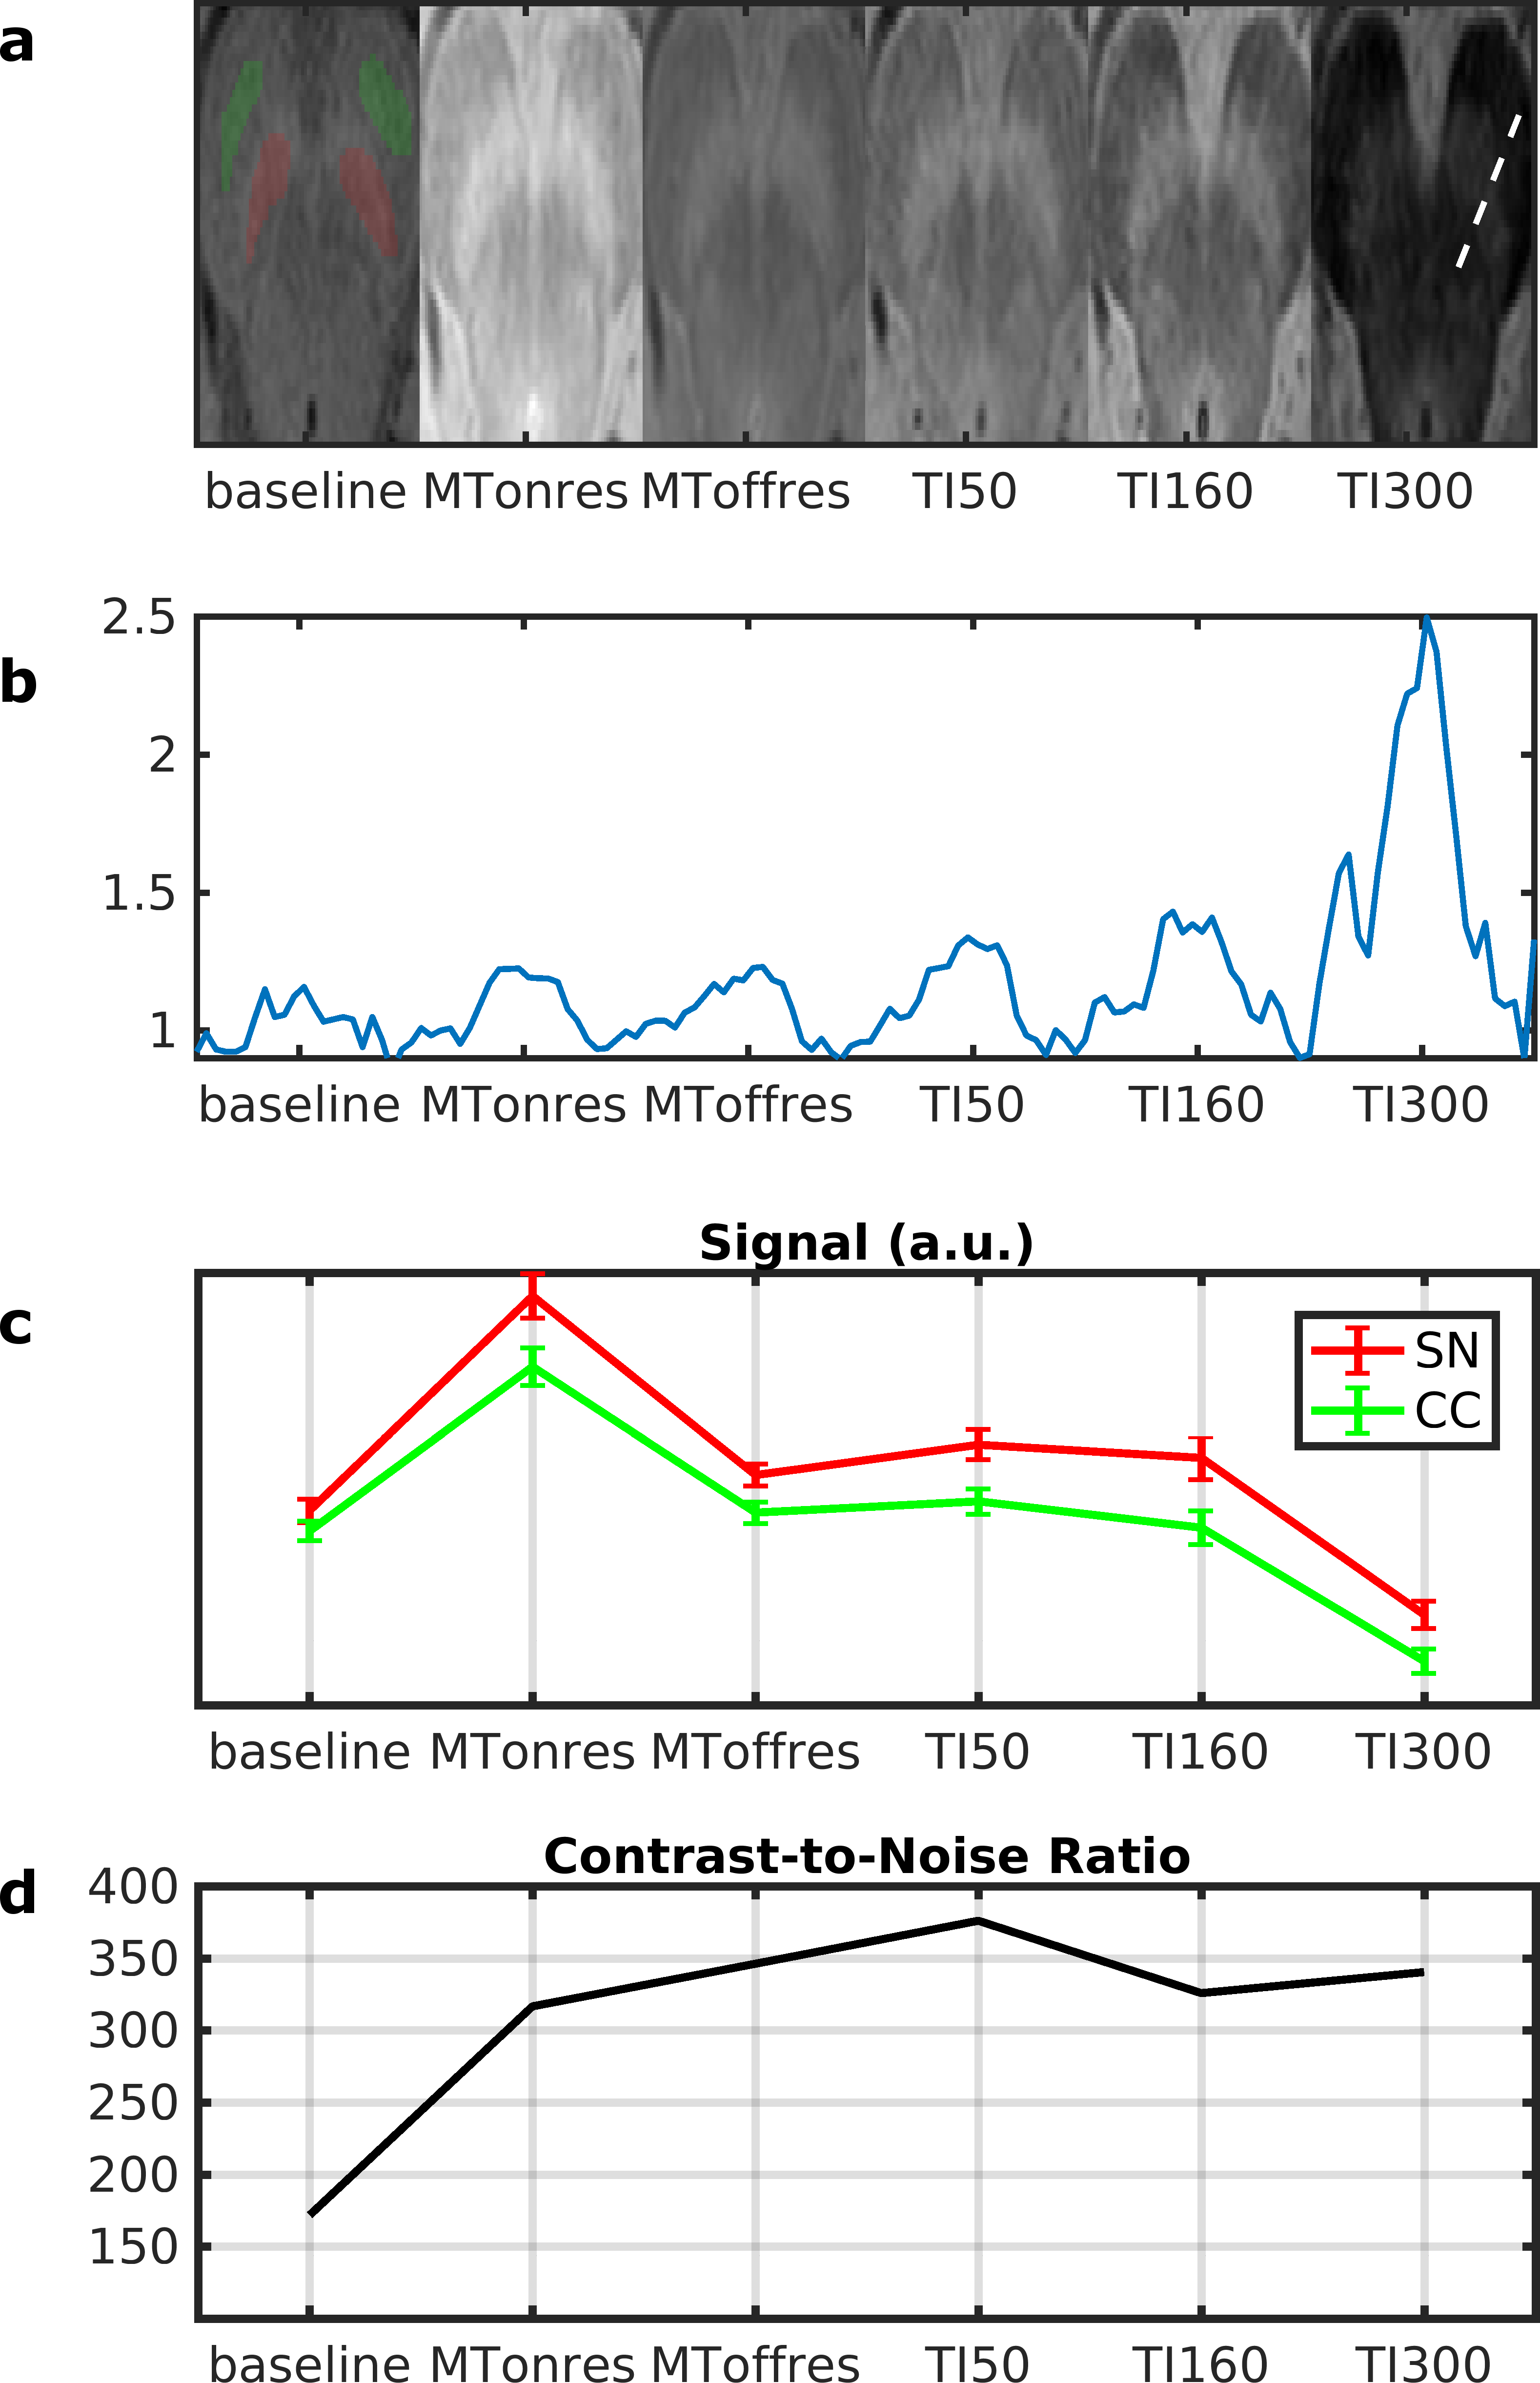
Fig 1 displays the normalized signals in the quantitative phantom MT experiment with corresponding fits. The TSE phantom images (Fig 2) confirms that IR can improve contrast between tissues with different MT properties. Experimental measurements were consistent with theoretical predictions (Fig 3) with differences that could be due to inaccuracies in the quantitative MT measurements since the macromolecular fraction f deviated from known BSA concentrations. Predicted in vivo signals and relative CRSN followed a similar trend (Fig. 4). In vivo images confirmed the value of adding IR pulses (Fig. 5a), with maximum contrast-to-noise ratio observed for a TI 50 ms.Discussion and Conclusions
The EPG-X formalism accurately predicted the measured NM-MRI phantom signals and may be used to evaluate the potential of other sequences in the future. In vivo results demonstrated that IR preparation pulses increase the CRSN at the cost of reduced signal intensities. TI were chosen to avoid excessively prolonging acquisition times, allowing to fit readouts for other slices.
Exams could be made more efficient by avoiding dead times between packages13. Future work is required to assess the clinical value of IR-TSE including robustness to motion, and the best trade-off for optimal depiction of the SN.
Acknowledgements
Portuguese Foundation for Science and Technology (FCT - IF/00364/2013, UID/EEA/50009/2013). This work was also supported by the Wellcome EPSRC Centre for Medical Engineering at Kings College London (WT 203148/Z/16/Z) and by the National Institute for Health Research (NIHR) Biomedical Research Centre based at Guy’s and St Thomas’ NHS Foundation Trust and King’s College London. The views expressed are those of the authors and not necessarily those of the NHS, the NIHR or the Department of Health.References
1. Sasaki M, Shibata E, Tohyama K, et al. Neuromelanin magnetic resonance imaging of locus ceruleus and substantia nigra in Parkinson's disease. Neuroreport. 2006; 17(11): 1215-1218.
2. Reimão S, Pita Lobo P, Neutel D, et al. Substantia nigra neuromelanin-MR imaging differentiates essential tremor from Parkinson's disease. Mov Dis. 2015: 30(7):953-959.
3. Chang Y, Bae SJ, Lee YJ, et al. Incidental magnetization transfer effects in multislice brain MRI at 3.0 T. J Magn Reson Imaging. 2007; 25(4): 862-865.
4. Nakane T, Nihashi T, Kawai H, et al. Visualization of neuromelanin in the Substantia nigra and locus ceruleus at 1.5T using a 3D-gradient echo sequence with magnetization transfer contrast. Magn Reson Med Sci. 2008; 7(4):205-210.
5. Trujillo, P., Smith, A.K., Summers, P.E. et al. High-resolution quantitative imaging of the substantia nigra. Proc. Annu. Int. Conf. IEEE Eng. Med. Biol. Soc. EMBS 2015–Novem, 5428–5431.
6. Hu MTM, White SJ, Herlihy AJ et al. A comparison of 18F‐dopa PET and inversion recovery MRI in the diagnosis of Parkinson's disease. Neurology 2001; 56(9): 1195–1200.
7. Malik SJ, Teixeira RPAG, Hajnal JV. Extended Phase Graph Formalism for Systems With Magnetization Transfer and Exchange. Mag Reson Med. 2018; 80:767-779.
8. Koenig SH, Brown RD 3rd, Ugolini R. Magnetization transfer in cross‐linked bovine serum albumin solutions at 200 MHz: A model for tissue. Mag Reson Med. 1993; 29(3):311-316.
9. Varma G, Duhamel G, De Bazelaire C et al. Magnetization transfer from inhomogeneously broadened lines: a potential marker for myelin. Magn Reson Med. 2015;73:614‐622.
10. Trujillo P, Summers PE, Smith AK, et al. Pool size ratio of the substantia nigra in Parkinson’s disease derived from two different quantitative magnetization transfer approaches. Neuroradiology. 2017; 59(12): 1251-1263.
11. Yarnykh VL and Chang C. Cross-relaxation imaging reveals detailed anatomy of white matter fiber tracts in the human brain. NeuroImage, 2004; 23:409-424.
12. Yarnykh VL. Actual flip-angle imaging in the pulsed steady state: a method for rapid three-dimensional mapping of the transmitted radiofrequency field. Magn Reson Med, 2007; 57(1):192-200.
13. Ferrazzi G, Price AN, Teixeira RPAG et al. An efficient sequence for fetal brain imaging at 3T with enhanced T1 contrast and motion robustness. Mag Reson Med. 2018; 80(1):137-146.
Figures