3979
Effects of Multiple Contrast Agents in Multi-Modality Imaging for Liver Embolizations: A Preliminary MR Analysis1Medical Physics, University of Wisconsin Madison, Madison, WI, United States, 2Radiology, University of Wisconsin Madison, Madison, WI, United States
Synopsis
Transarterial embolization (TAE) is a standard treatment for liver tumors and results in stasis and an accumulation of iodinated contrast agent in the liver. This study demonstrated that when iodinated contrast agents are present in MR, a T1 and T2 shortening effect can occur. We completed a preliminary analysis investigating pre- and post-TAE MR signal changes in the presence of iodine and gadolinium based contrast agents in-vivo (pilot swine study) and in phantoms. Understanding variations in MR images caused by contrast agents used for other modalities could help reduce errors in multimodality imaging studies.
Purpose
Transarterial embolization (TAE) is an effective, minimally invasive treatment for patients with hepatocellular carcinoma and liver metastases. Iodinated contrast agents are mixed with the embolic particles or beads to monitor the embolization under X-ray imaging, which persist in the tumor and vessels supplying the tumor post treatment1. Proper dosage of the embolic agent remains a clinical challenge and quantitative flow MRI might provide better markers than the currently used subjective X-ray fluoro interpretation. However, the presence of iodine changes the MR signal (T1 and T2) and has implications for post-treatment MRI2,3. These changes are particularly difficult to predict when a MR contrast agent is used as mixing of the agents can further influence the MR signal. In this pilot study, we investigate pre- and post-TAE MR signal changes in the presence of iodine and gadolinium based contrast agents in-phantoms and in-vivo in a swine study.Methods
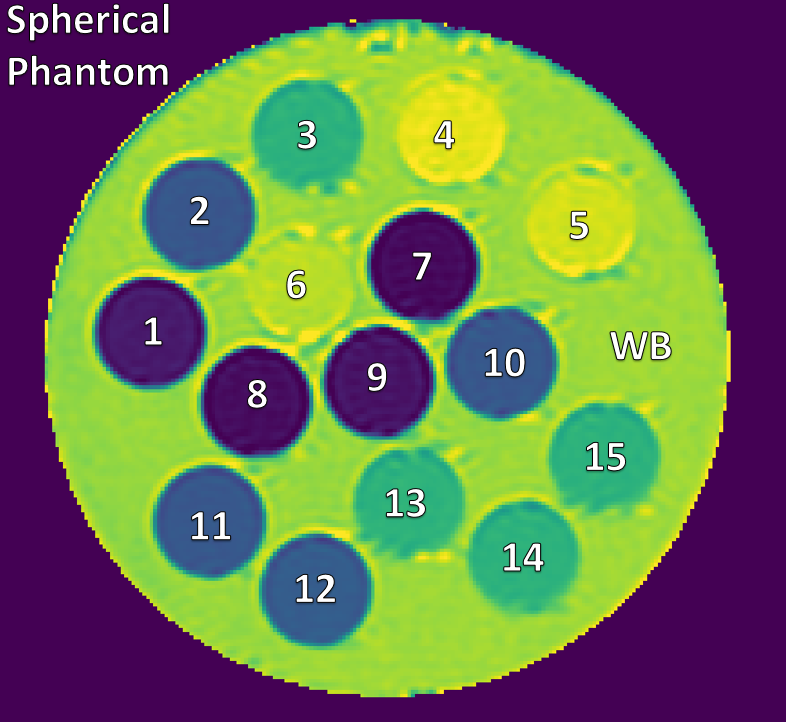
Phantom study: All scans were performed on a clinical 3T system (Discovery MR750, GE Healthcare). Deionized water was doped with manganese chloride and sodium benzoate to serve as background and contrast dilution. 2 phantom experiments with 15 vials in the doped water bed were conducted (Figure 1): (1) the vials contained various concentrations (0-100%) of an iodinated contrast agent (Omnipaque™ (iohexol) solution) and (2) the vials contained mixtures of various concentrations of a Gadolinium chelate (Gadoterate Meglumine, Dotarem: 0%, 0.2%, 0.6%, 1%) and Omnipaque (0%, 1%, 3%, 5%). Spin-echo and inversion recovery images were acquired to quantify (1) Omnipaque’s effect on T1 and T2 (2) to quantify changes in T1 and T2 from the addition of Dotarem. T1 and T2 quantification were completed using in-house software tools (MATLAB 2016a).
Swine study: Two female swine (~55 kg) were anesthetized with 1.5% isoflurane supplemented with O2. A total of 44 ml of contrast agent, Dotarem (0.5 mmol per ml), was used for perfusion scans prior to a 4D Flow acquisition. Two 4D Flow MRI exams of the abdomen were acquired with a radially undersampled sequence, PC VIPR4: imaging volume: 32x32x32 cm, acquired spatial resolution=1 mm isotropic, scan time: 15.6 min. Thereafter, the swine was transferred to an angiography suite and the left hepatic artery was partially embolized with microspheres (Embospheres, 100-300 µm) under X-ray fluoro guidance. Approximately 200ml of Omnipaque (300 mgI/ml) was injected during the TAE procedure. Finally, the 4D Flow MRI scans were repeated with identical parameters ~20 min after the embolization. SNR measurements of magnitude images were completed in identical ROIs in the embolized liver regions on the resulting four 4D Flow datasets.
Results
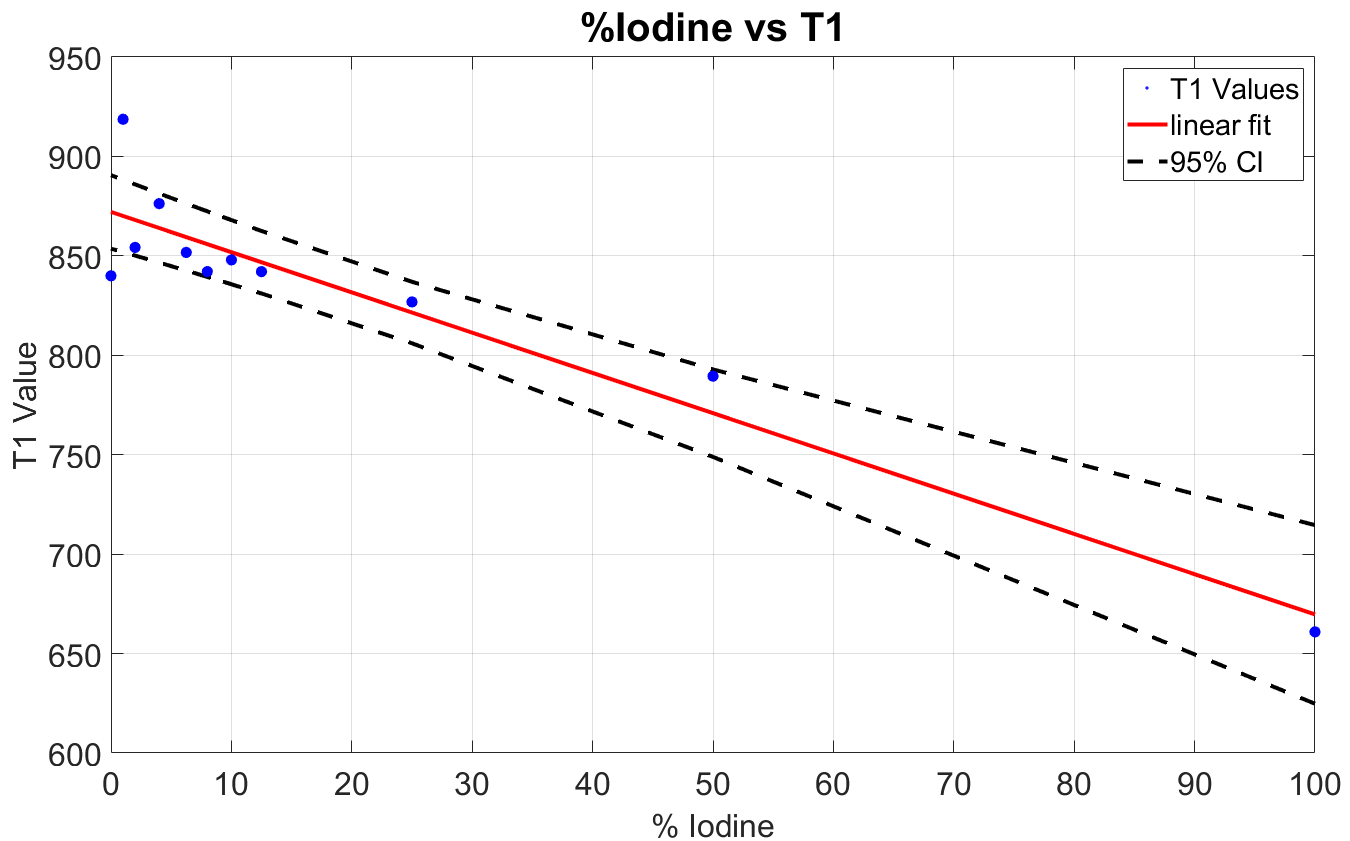
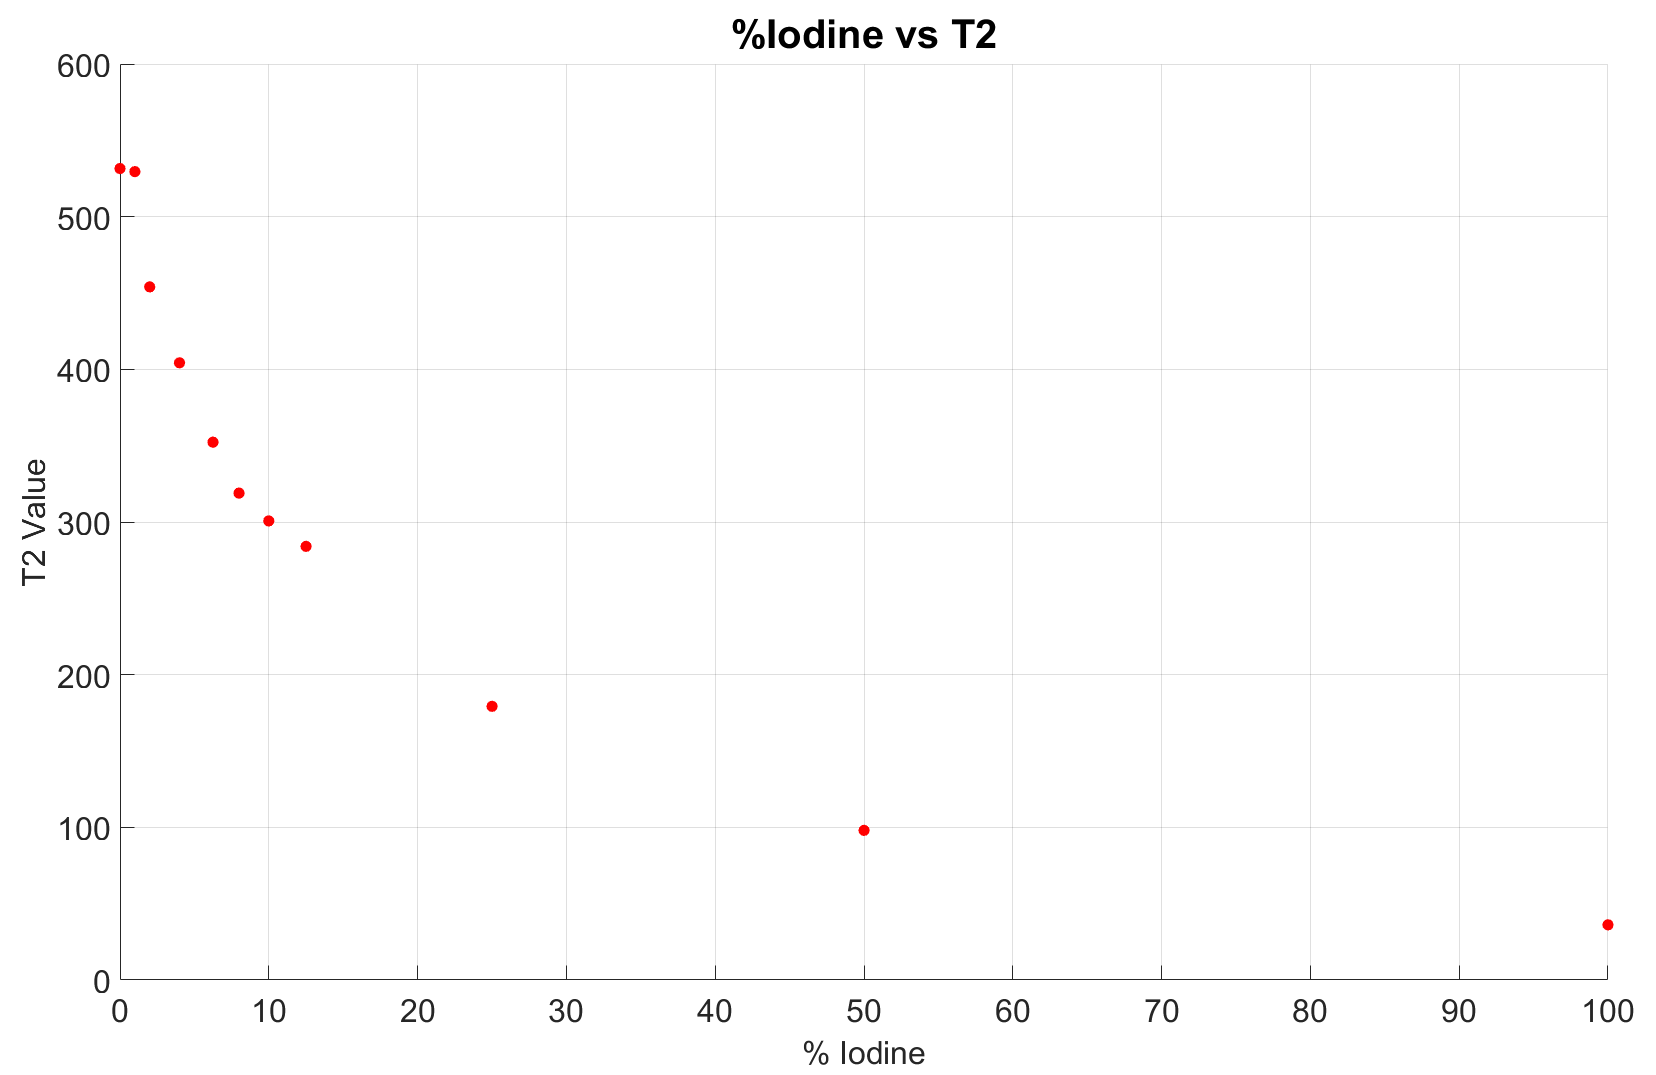
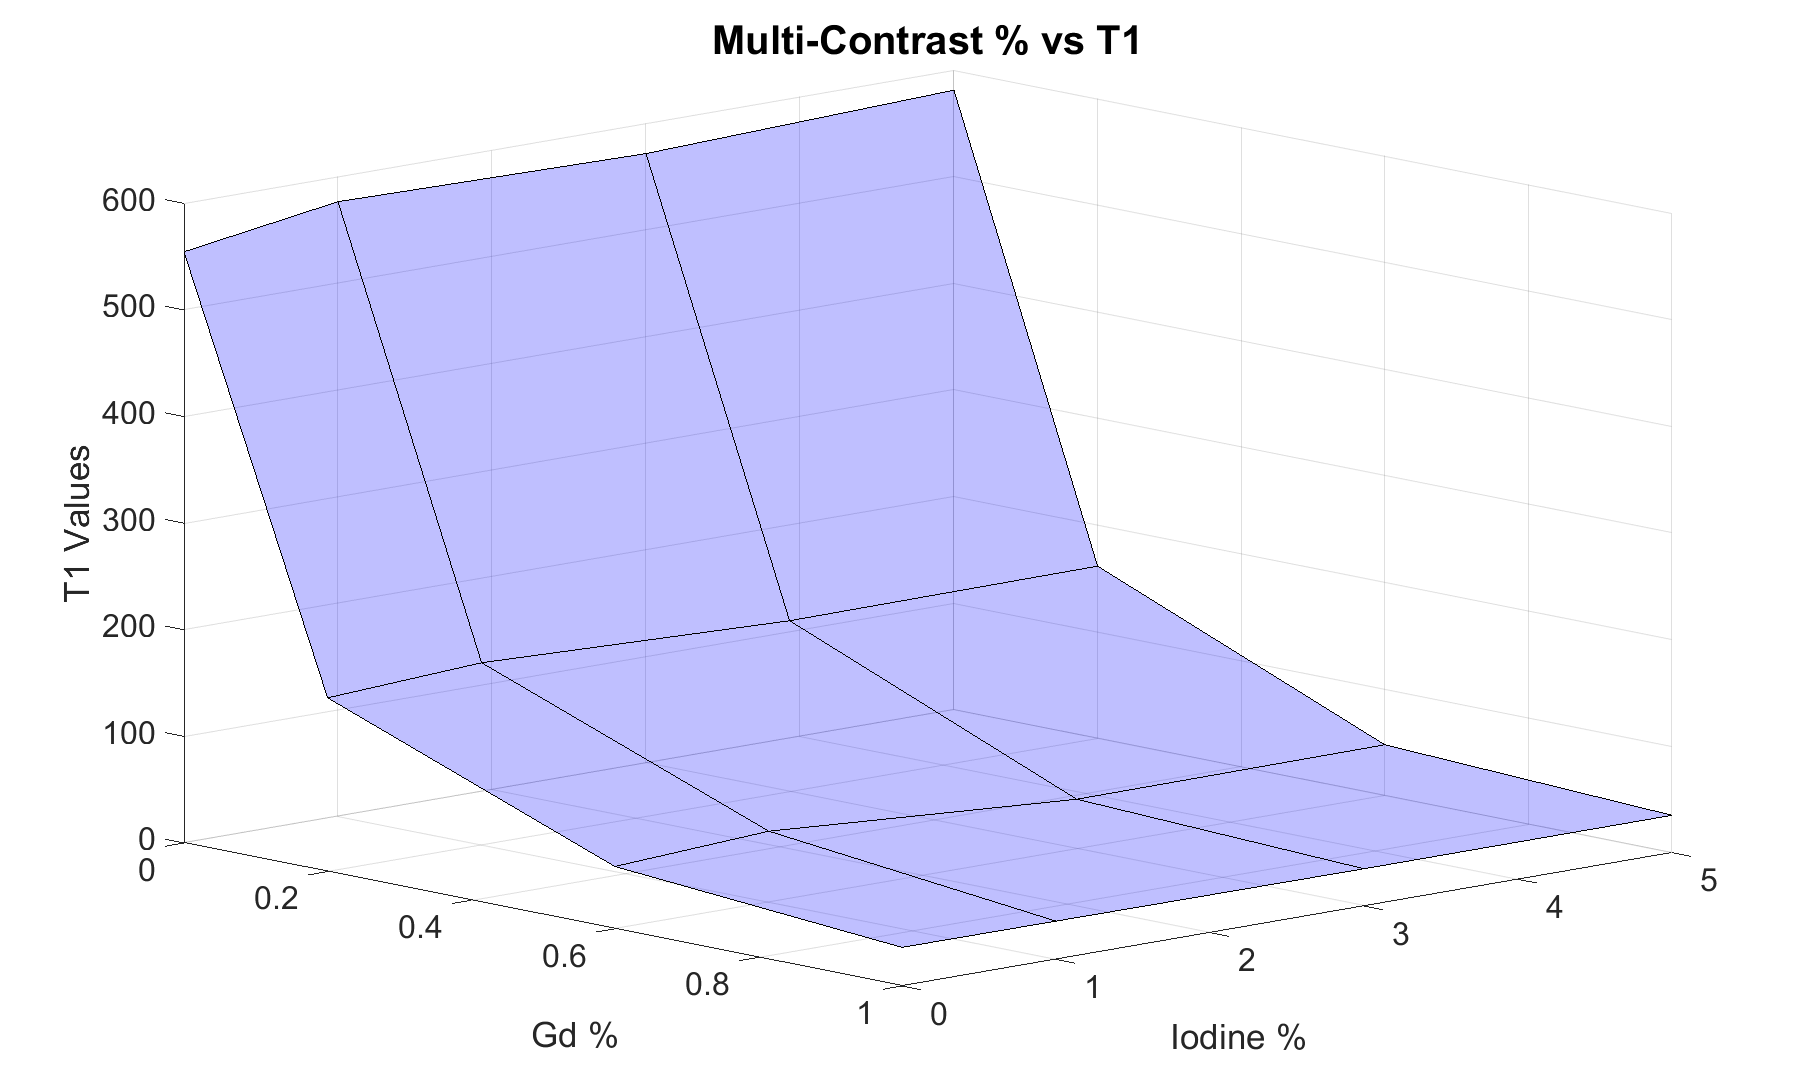
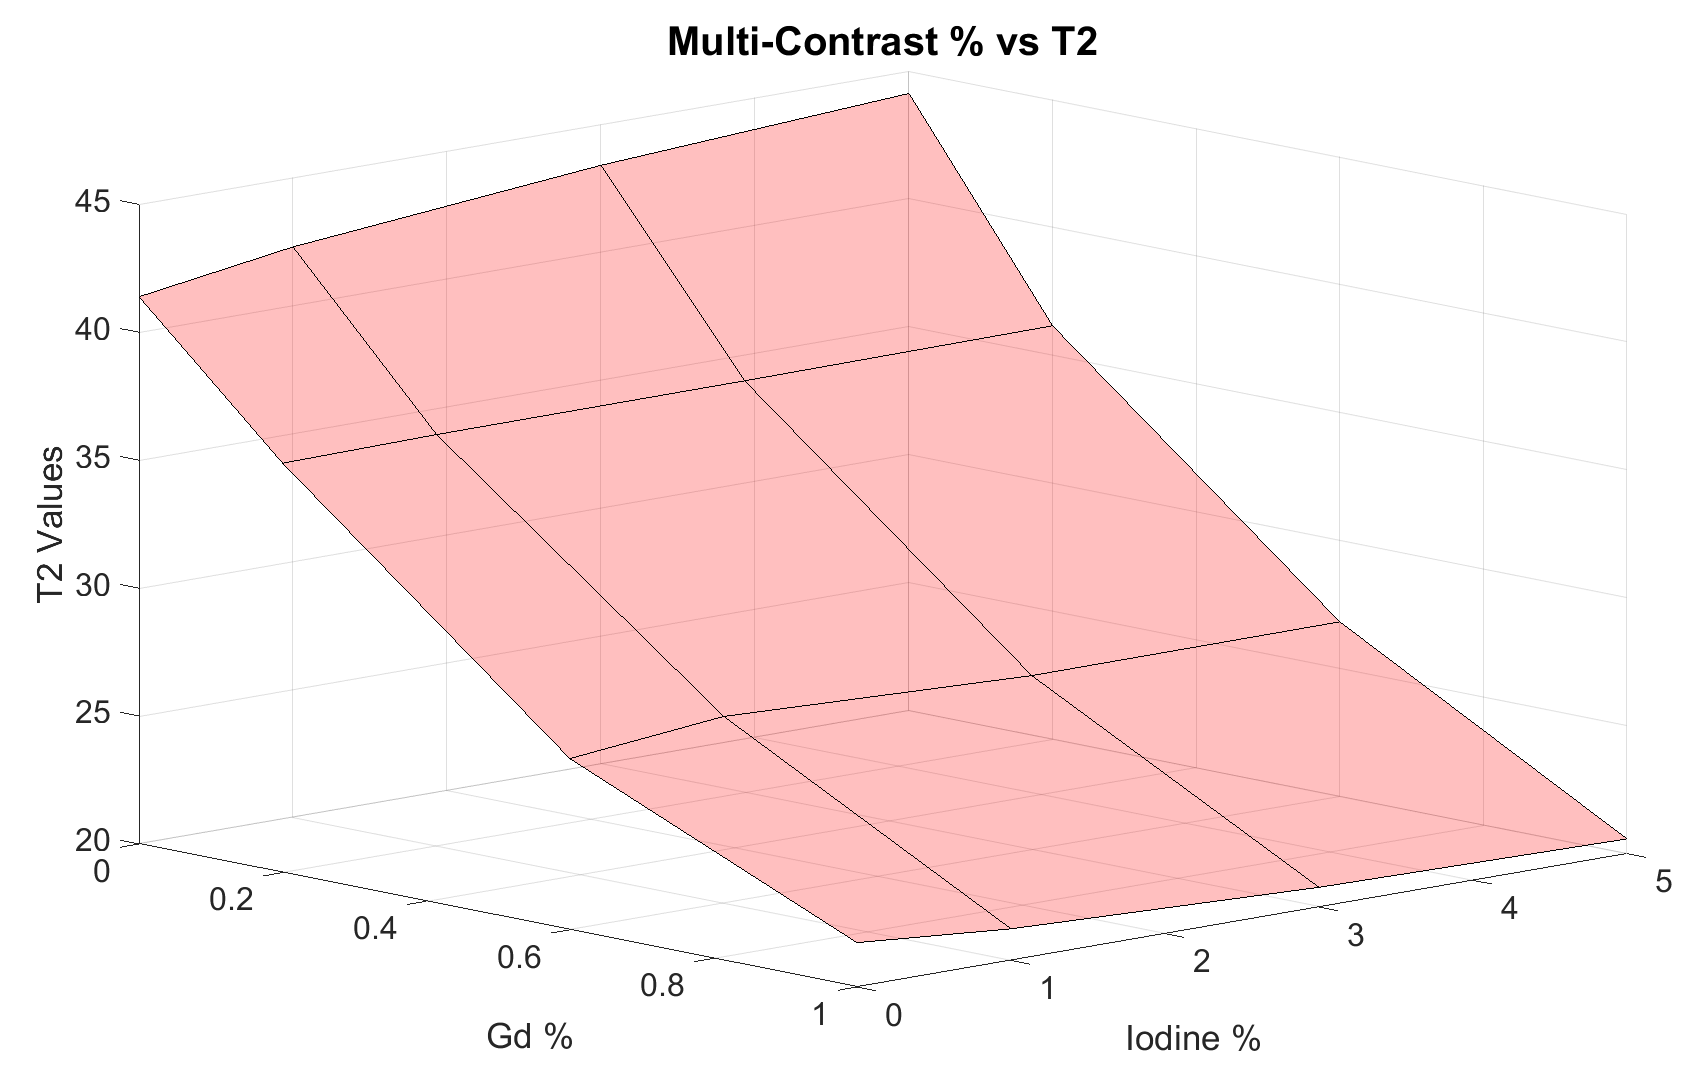
Phantom results showed that T2 values were more affected by the addition of the iodinated contrast agent than T1 values. A shortening in both T1 and T2 was observed as the concentration of Omnipaque increased (Figure 2 and 3). At low levels of iodine (0,1,3,5%) and gadolinium (0,0.2, 0.6,1%) contrast agents, the variations in T1 and T2 were driven primarily by the concentration of gadolinium(Figure 4 and 5). Visual inspection of the in-vivo images showed a loss in ability to resolve small vessels in the embolized region for the post-intervention 4D Flow acquisitions. Post TAE angiograms also appeared noisier, especially in regions near potential iodine stasis. Signal to noise ratio (SNR) measurements of the embolized regions decreased for all 4D Flow scans with an average SNR drop of 35.1 ± 9.3%.Discussion
The large effect on T2 values in the phantom experiments suggest that iodine is primarily a T2 shortening agent, varying the dephasing instead of intramolecular collisions5. In lower concentrations of Dotarem, as might occur after liver embolization, the influence of iodine on tissue T1 and T2 might increase. The 35% drop of SNR in the embolized region supports the presence of iodine at least 20-30 min following our TAE procedure and is likely the source for the noisier MR images. Using the phantom T2 fits, an approximate iodine concentration of ~6% is estimated for the embolized liver region, which is consistent with clinical liver iodine concentration approximations ranging from 0-10%.Conclusion
This study demonstrated that the presence of an iodinated contrast agent (Omnipaque), at clinically relevant levels, caused noticeable variations in MR signals in phantoms and in-vivo, including loss of SNR and conspicuity of vessels. Higher levels of iodine concentration and gadolinium mixing are relevant for other clinical procedures besides TAE (transarterial chemoembolization, MR Arthrogrpahy5), emphasizing the importance of investigating multi-contrast imaging. To utilize quantitative perfusion and flow MRI in post TAE assessment, implications of iodine’s presence and organ specific clearance rates must become defined.Acknowledgements
No acknowledgement found.References
1) Wang, Xiaodong, et al. "Pattern of retained contrast on immediate postprocedure computed tomography (CT) after particle embolization of liver tumors predicts subsequent treatment response." Cardiovascular and interventional radiology 36.4 (2013): 1030-1038.
2) Hergan, Klaus, et al. "Effects of iodinated contrast agents in MR imaging." European journal of radiology 21.1 (1995): 11-17.
3) Morales, Humberto, et al. "Effects of iodinated contrast on various magnetic resonance imaging sequences and field strength: implications for characterization of hemorrhagic transformation in acute stroke therapy." World journal of radiology 8.6 (2016): 588.
4) Johnson, K. M. et al Magnetic Resonance in Medicine. 2008; 60(6), 1329-1336.
5) Ganguly, Arundhuti, et al. "Quantitative evaluation of the relaxivity effects of iodine on GD‐DTPA enhanced MR arthrography." Journal of Magnetic Resonance Imaging: An Official Journal of the International Society for Magnetic Resonance in Medicine 25.6 (2007): 1219-1225.
Figures