3976
Correcting portal-venous partial-volume effects in dynamic contrast-enhanced MRI of the liver1Biomedical Imaging Science Department, University of Leeds, Leeds, United Kingdom, 2Leeds Teaching Hospitals NHS Trust, St James University Hospital, Leeds, United Kingdom
Synopsis
We investigated the effect of partial-volume corrections on the liver perfusion and function measured from DCE-MRI data using dual input two compartment uptake model. Following the convection principle in the human body, partial-volume error for hepatic portal vein is determined by taking the ratio of time integrals of venous and arterial input function. We found moderate correlation between the corrected and uncorrected venous plasma flow and a poor correlation between corrected and uncorrected extracellular volume and uptake rate. This indicates that partial-volume effect is significant and should be corrected for in the determination of perfusion and liver function.
Introduction
Liver perfusion and function can be quantified from DCE-MRI using two input functions in the abdominal aorta and in the portal vein, but portal-venous signals are likely to be corrupted by partial-volume effects and/or motion-induced blurring. In DCE-MRI and DSC-MRI of the brain it has been proposed to correct for partial-volume errors in the input using a reference measurement in the sagittal sinus [1, 2]. Here we propose to translate this solution to the liver using a reference measurement in the abdominal aorta and investigate its effect on liver function measurements in a population of 20 patients selected for liver surgery.Methods
Portal-venous partial-volume correction in a dual-inlet model
Within a convective system such as the vessel tree in the body, the time integral of upstream arterial (AIF, Ca) and downstream venous concentrations (VIF, Cv) must be equal [3]. In case of liver, we assume that AIF is unaffected by partial-volume error due to the large diameter of the abdominal aorta. From these two relations, the partial-volume correction factor, p<1 in the liver can be derived from the ratio of the areas under the VIF and AIF (Eq. 1 in Fig 1) and Cv is corrected by rescaling: Cv => Cv/p.
Data acquisition
DCE-MRI was performed on twenty patients with colorectal metastases for 5 minutes at a temporal resolution of 2.2 seconds at 1.5 Tesla with a 3D T1-weighted spoiled gradient-echo sequence in free breathing (TWIST, time resolved angiography with stochastic trajectories). Imaging parameters were as follows: 48 coronal sections (10 mm thick), 3.125 mm pixel size, FA 25°, TR 2.45 ms, TE 0.76 ms. Gadoxetate concentration was 0.1 mL/kg (rate 2 mL/sec).
Data post-processing
Data post-processing was performed with PMI 0.4 software [4]. No motion correction was performed and concentrations were approximated as S(t) – S(0). ROIs for aorta and vein were determined by drawing a broadly outlined region on area under the concentration curve (AUC) map and model-free plasma flow map, respectively and extracting the pixels in the top 10% of the value range. The liver ROI was determined by manually segmenting the liver after thresholding the AUC map. Model fitting was performed using a dual input two-compartment uptake model [4] – see Eq. 2 for model equation. This produces 4 independent parameters Fa (arterial plasma flow), Fv (venous plasma flow), VE (extracellular volume fraction) and KI (intracellular uptake rate).
Evaluation of the partial volume correction
The effect of partial-volume correction was assessed by measuring p and comparing results with and without partial-volume correction, using linear regression analysis and Pearson’s correlation coefficient (R).
Results
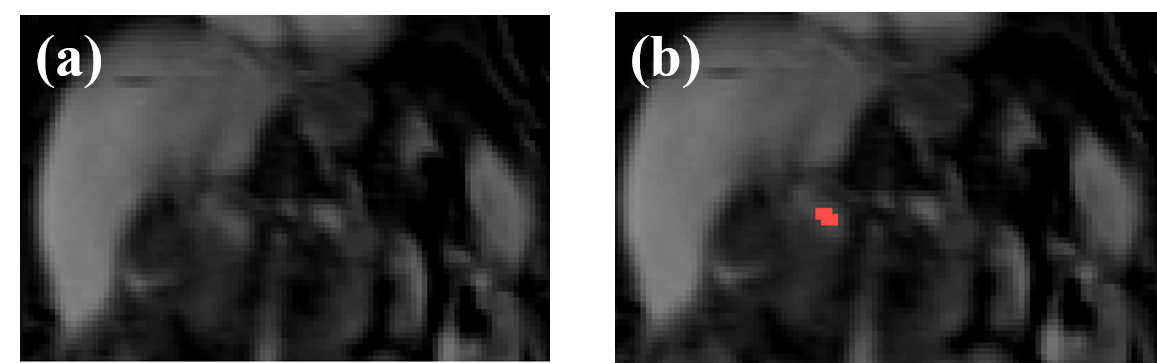
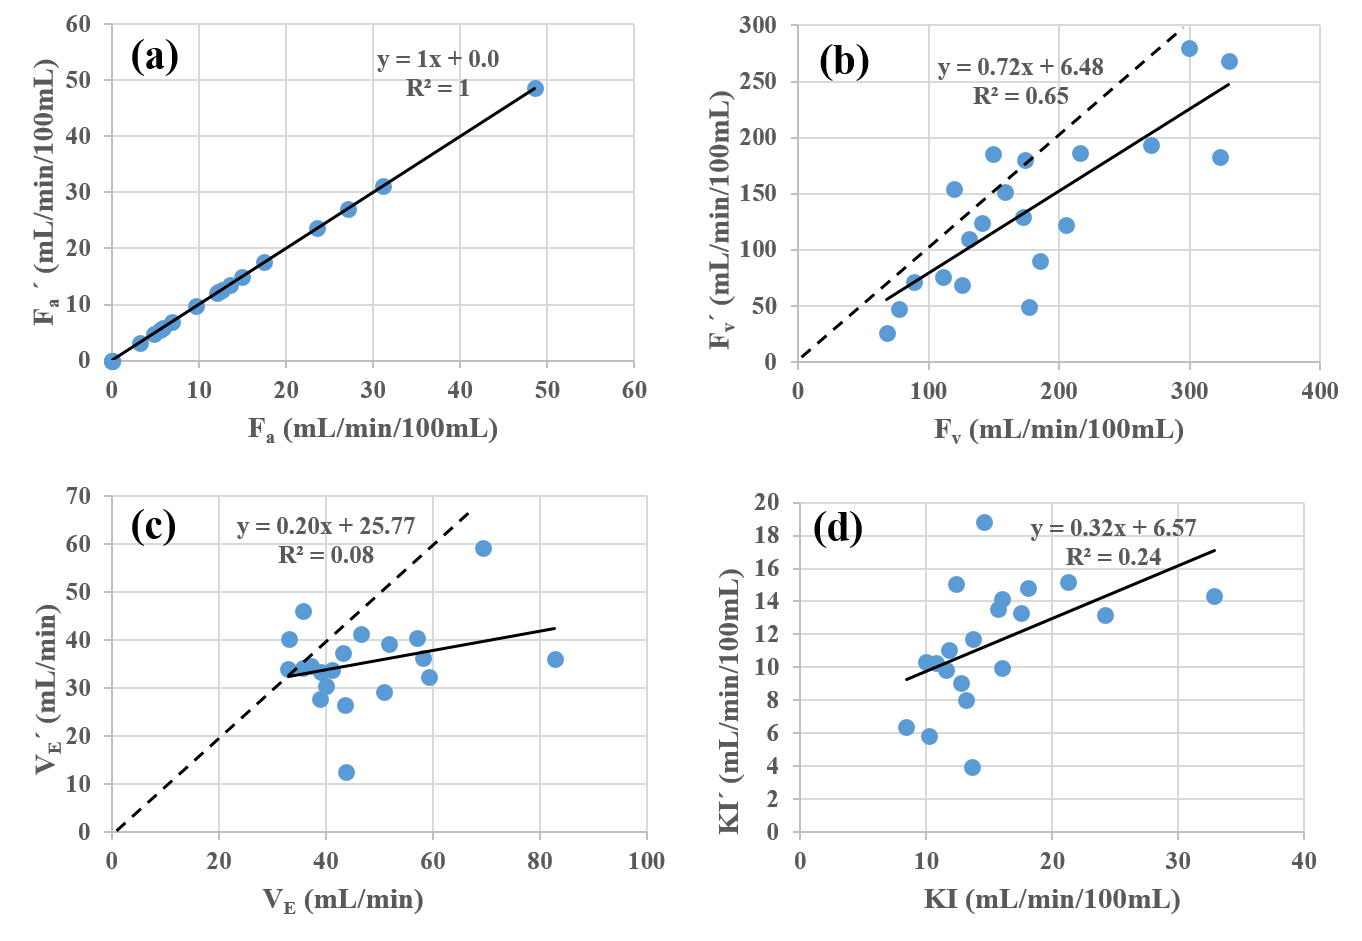
The AUC map of the liver shows that the portal vein is poorly differentiated, indicating a probable partial-volume effect (Fig. 2). The mean and standard deviation of p are 0.76 and 0.25, respectively and its minimum and maximum values are 0.28 and 1.29, respectively. Three values of p are larger than 1 (1.04, 1.24, 1.29). Comparison between corrected and uncorrected values of the parameters show perfect agreement for Fa (as expected), moderate correlation for Fv and very poor correlation for VE and KI (Fig. 3). The mean and standard deviation of all the parameters are listed in Fig. 4.Discussions
The average partial-volume correction factor is 76%, suggesting that on average 24% of the portal-venous ROI is taken up by tissue. This is in the range of expectations considering the slice thickness and the effect of motion-induced blurring. The magnitude of the correction is highly subject dependent, showing that fixed correction factors are inadequate to compensate.
In terms of the effect on perfusion parameters, the data show that partial-volume correction does not affect Fa, which can be expected as Fa is a scaling factor in Ca(t), which is not corrected. The effect on Fv is an approximate 28% reduction – on closer inspection the effect on Fv is in fact proportional to p because any correction Cv => Cv/p can be compensated exactly by substituting Fv => Fv/p.
However, the effect on VE and especially on the key functional parameter KI is major, and significantly larger than the average value of p would suggest. The effect on average of KI is mild but the corrected and uncorrected parameters are almost fully uncorrelated. This indicates that partial-volume correction is essential to the clinical utility of KI and it could significantly improve correlations with clinical outcome metrics or reference measures of liver function.
Acknowledgements
We acknowledge MRC grant no. P023398References
[1] Knutsson L et al., Tomography 2017; 3(2):74-78
[2] Hansen A et al., Magnetic Resonance in Medicine 2009; 62:1055–1059
[3] Jacquez J A et al., Compartmental analysis in biology and medicine, 2nd edition (The University of Michigan Press; USA)
[4] Sourbron S et al., Radiology 2012; 263(3): 874-83.
Figures

Fig. 1: Equation (1) represent formula for partial-volume correction p.
Eq. (2) represents tracer concentration (C(t)) from dual input two compartment uptake model where Te : extracellular mean transit time, fi : hepatic uptake fraction, Fa: arterial plasma flow, Fv: venous plasma flow, Ca: arterial input function, Cv: venous input function and * represents convolution product.