3969
Partial Vibration MR Elastography: Zero-MR phase image MRE1Radiological Sciences, Tokyo Metropolitan University, Tokyo, Japan, 2National Institute of Advanced Industrial Science and Technology (AIST), Ibaraki, Japan, 3Office of Radiation Technology, Keio University Hospital, Tokyo, Japan, 4Tokyo Denki University, Tokyo, Japan
Synopsis
We developed a new technique for MR elastography (MRE) without using MR phase images (Zero-MR phase image MRE). A general MRE uses MR phase images as a wave image. Proposed technique was used MR magnitude images instead of MR phase images as a wave image by using the partial vibration. Proposed technique (partial vibration MRE technique) performance was comparable to that of a continuous vibration (conventional) MRE. Since partial vibration MRE need an only few second vibration, it could dramatically eliminated the patients' vibration-related discomfort.
INTRODUCTION
MR elastography utilizes accumulated MR phase sifts to estimate the motion which is used to reconstruct the mechanical properties of tissue. For general MRE, continuous harmonic mechanical excitation is applied to the tissue. In order to detect the motion in the tissue, a motion encoding gradient is used to encode the motion information onto the MR phase image. When the accumulated MR phase sifts are out of the [-π, π] range, the true phase values will be wrapped back to this range, creating discontinuities in the phase maps and subsequently in the estimated motion. Thus the phase needs to be unwrapped before the motion can be estimated accurately. However, the out of the range of [- π, π] is also caused by significantly different magnetic susceptibility. If the MR phase shifts and the significantly different magnetic susceptibility region are overlapped, there is a possibility that an error occurs in the phase unwrapping process.
Our previous study reported a new method for MRE using the GRE-MultiEcho-MRE sequence without motion encoding gradient (MEG)1. The GRE-MultiEcho-MRE uses a series of echoes acquired as a train following after a single excitation pulse. The multiple symmetrical gradient-echoes in the GRE-MultiEcho-MRE are acquired by symmetrical bipolar readout gradient (GR). This GR has a function comparable to MEG (MEG-like effect). In the all MRE, the vibration power was giving continuous vibrations throughout the whole acquisition. For a new attempt, we changed the vibration of the GRE-MultiEcho-MRE from continuous to the partial vibration. Specifically, an arbitrary Gaussian distribution of vibration power was formed on half an acquisition time (Fig.1). Interestingly, it was observed that the propagating wave pattern was visualized on MR magnitude image. Glaser et al. (2003) reported a phenomenon that the propagating wave pattern was visualized on MR magnitude image as intravoxel phase dispersion (IVPD)2. We found the phenomenon by using the partial vibration was an entirely different from IVPD. In this report, we demonstrate the properties of the amount of the partial vibration and the propagating wave pattern on MR magnitude image.
METHODS
All MRE experiments were performed on a clinical MR imager (Achieva 3.0 T; Philips) using a flex-M coil (phantom) and a torso coil (volunteer lower back). A self-made waveform generation system (LabVIEW, USB-6221; National Instruments) was used to generate the vibration waveform. This system is capable of generating sinusoidal waveforms with arbitrary frequencies and phases. For the partial vibration, this waveform generation system can control an arbitrary Gaussian distribution of output voltage at during acquisition. Power amplifier (XTi 1000; Crown) and a pneumatic pressure generator (Subwoofer TIT320C-4 12”; Dayton Audio) units were used to supply vibrations to a vibration pad. The vibration pad was designed using a three-dimensional printer (3D touch; 3D system) in order to adapt to the gel-phantom and the lower back region. The GRE-MultiEcho-MRE sequence parameters were TR: 40ms, 1st TE: 2.2ms, dTE: 3.3ms@150Hz; 5ms@100Hz; 10ms@50Hz, flip angle: 20degree, scan matrix: 512×256, image matrix: 512×512, k-space ordering: Hi-Low-Hi, vibration frequency: 50Hz (phantom and lower back); 100Hz (phantom); 150Hz (phantom), vibration phase offset: 4, total acquisition time: 82s, MEG-like effect direction: A-P(lower back) or L-R(phantom). All elastograms were produced by Local Frequency Estimate (LFE) algorithm freeware (MRE/Wave, MAYO CLINIC).RESULTS and DISCUSSION
Figure 2 shows the MR magnitude images and the MR phase images of gel-phantom by using 100 Hz continuous and partial vibration methods. In Fig.2a-c, the black painted area was vibration time. Vibration of Fig.2d,g were maximum power during the acquisition time (all-spatial frequency domain of k-space). Since the maximum vibration power was optimized as to prevent IVPD, the vibration pattern visualized only on MR phase image (Fig.2g). Vibration of Fig.2e,h were selected only low-spatial frequency domain. Vibration of Fig.2f,i were selected high-spatial frequency domain. When vibration was selected on low-spatial or high-spatial frequency domain, the wave pattern contrast on the each magnitude image was inverted (Fig.2e,f). Figure 3 shows the MR magnitude images of gel-phantom by using each frequency and partial vibration methods. In all vibration frequencies, the narrower the widths of partial vibration, the contrast of the wave propagation pattern were enhanced. Wave propagation pattern on magnitude image in partial vibration, unfortunately, is not well understood. This phenomenon need more investigation and is still open to discuss. Figure 4 shows the making process of wave images from MR magnitude images. Figure 5 demonstrates the wave images (a,b) and elastograms (c,d) obtained from different vibration in volunteer psoas major muscles, respectively. The partial vibration MRE performance was comparable to that of a conventional (continuous vibration) MRE.Acknowledgements
No acknowledgement found.References
- Numano T, Mizuhara K, Hata J, et al. A simple method for MR elastography: a gradient-echo type multi-echo sequence. Magn Reson Imaging 2015;33(1):31-7
- Glaser KJ, Felmlee JP, Manduca A, et al. Shear stiffness estimation using intravoxel phase dispersion in magnetic resonance elastography. Magn Reson Med. 2003 Dec;50(6):1256-65.
Figures
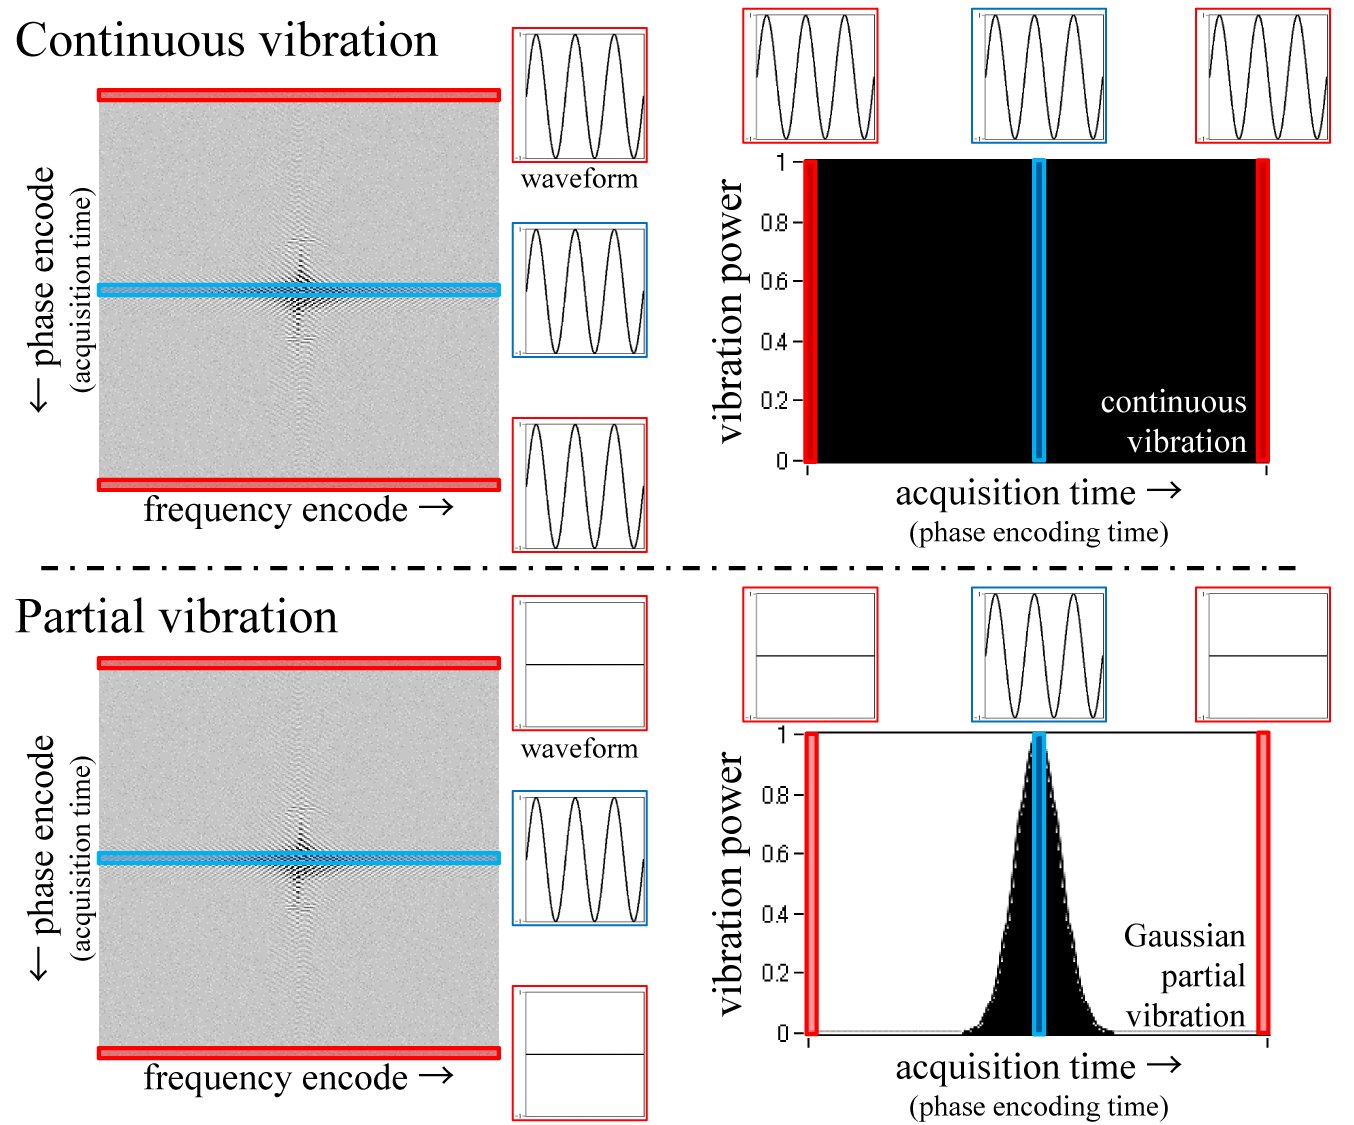
Figure 1. Continuous vibration and partial vibration
In general MRE, continuous vibration, the vibration power is steady state during image acquisition. The vibration effect of k-space in the continuous vibration was convolved in all spatial frequency domains as an example red and blue area. In contrast, the partial vibration was changing power in accordance with a Gausian distribution. The vibration effect of k-space in the partial vibration was selectively convolved in only low-spatial frequency domain as an example only blue area.
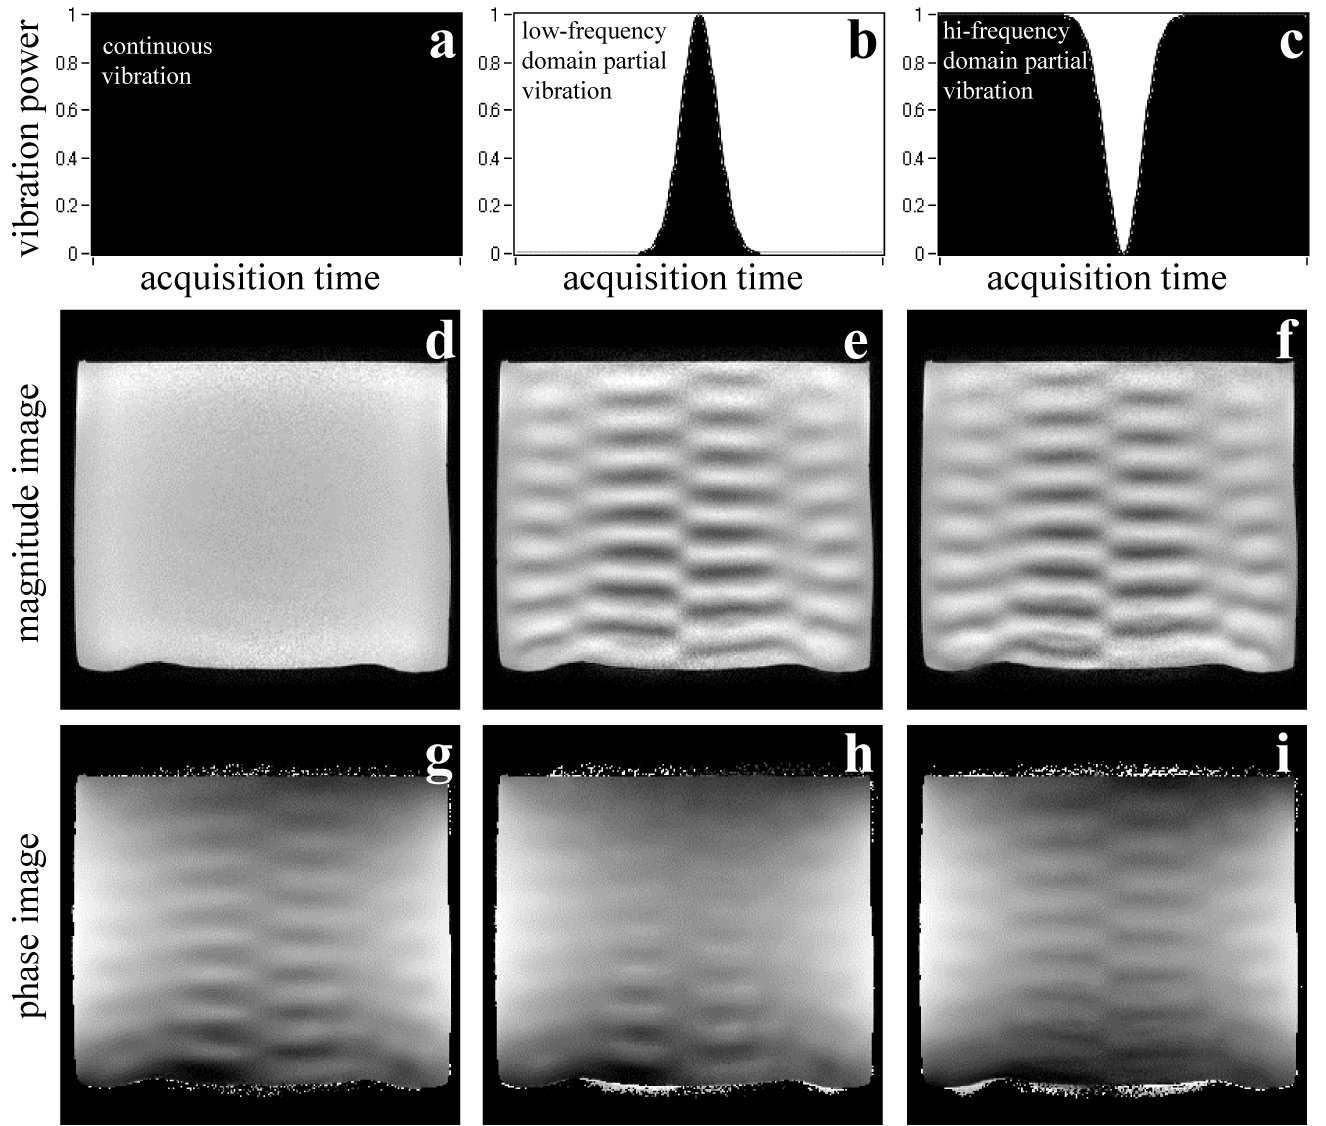
Figure 2. Vibration method vs. magnitude and phase image
a: Vibration was constant in all frequency domain of k-space. b: Partial vibration was selected in only low-spatial frequency domain. c: Partial vibration was selected in only high-spatial frequency domain. d,g: When vibration was suitable and constant, the wave propagation pattern was made in only the phase image. e,f,h,i: When vibration was only low-spatial or high-spatial frequency domain, the wave pattern were made in both images. e,f: When vibration power was selected on low-spatial or high-spatial frequency domain, the wave pattern contrast on the each magnitude image was inverted.
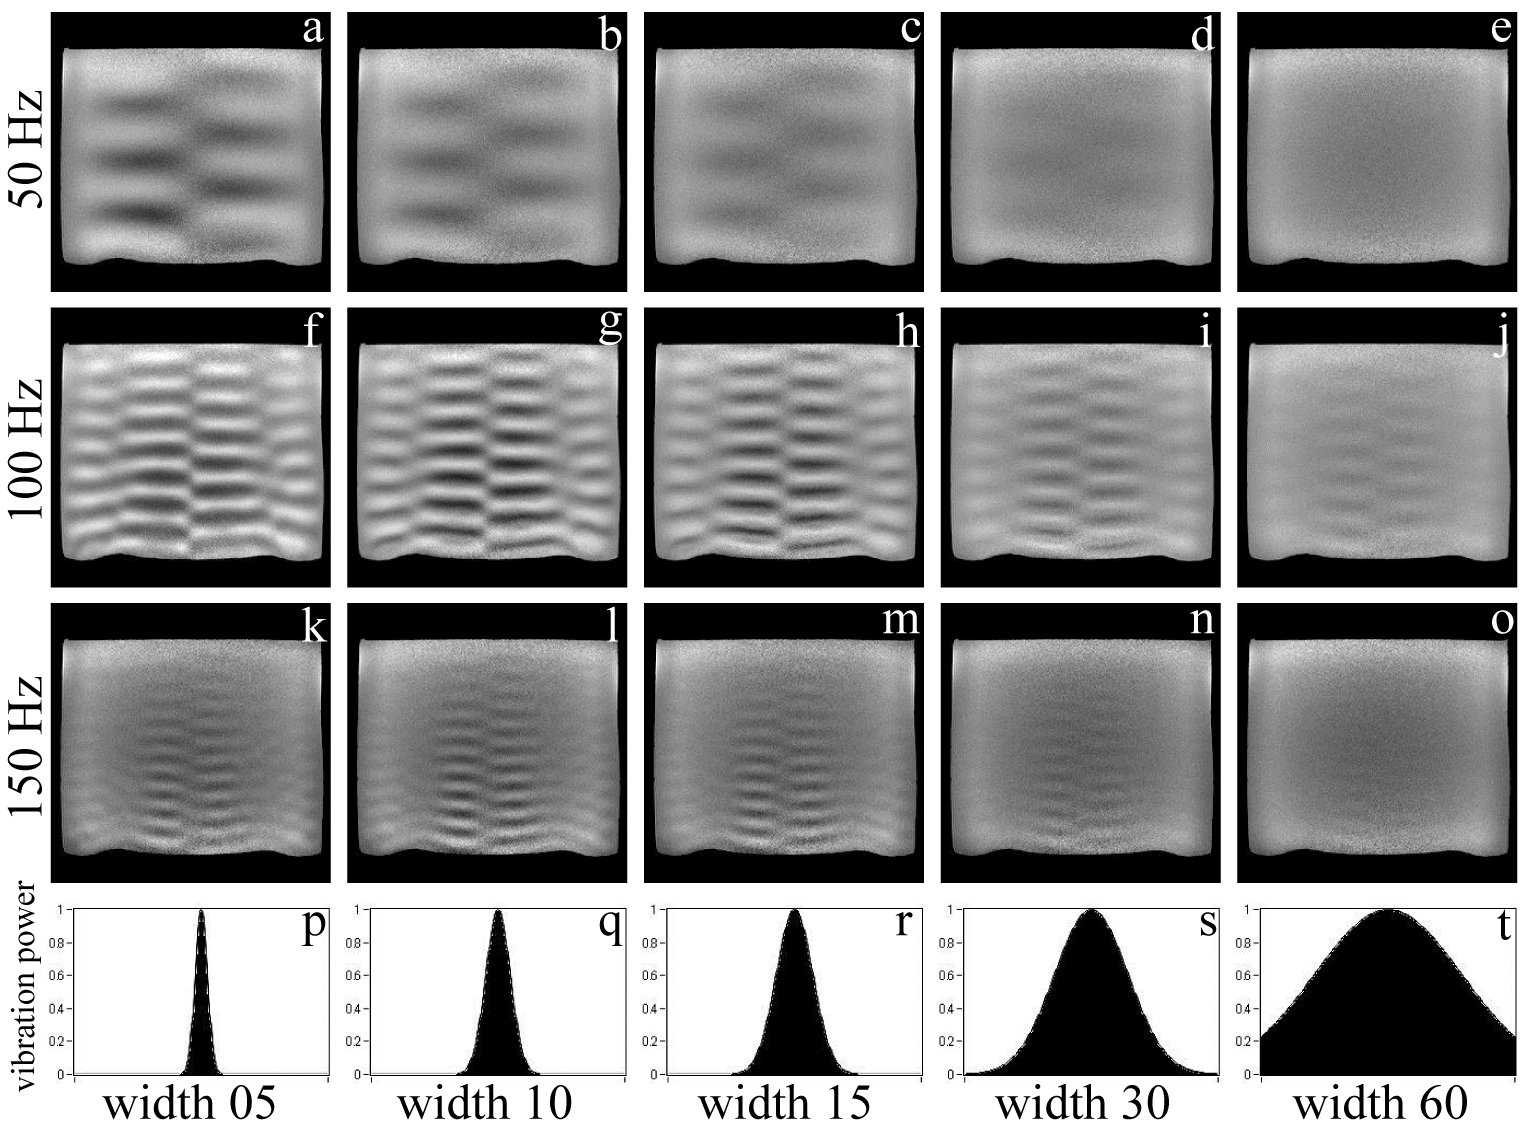
Figure 3. Phantom experiment results
a-e: 50 Hz MR magnitude images in partial vibration MRE. f-j: 100 Hz MR magnitude images in partial vibration MRE. k-o: 150 Hz MR magnitude images in partial vibration MRE. p-t: Each low-spatial frequency domain partial vibration, the numerical number was width of Gausian distribution as the vibration area of low-spatial frequency domain.
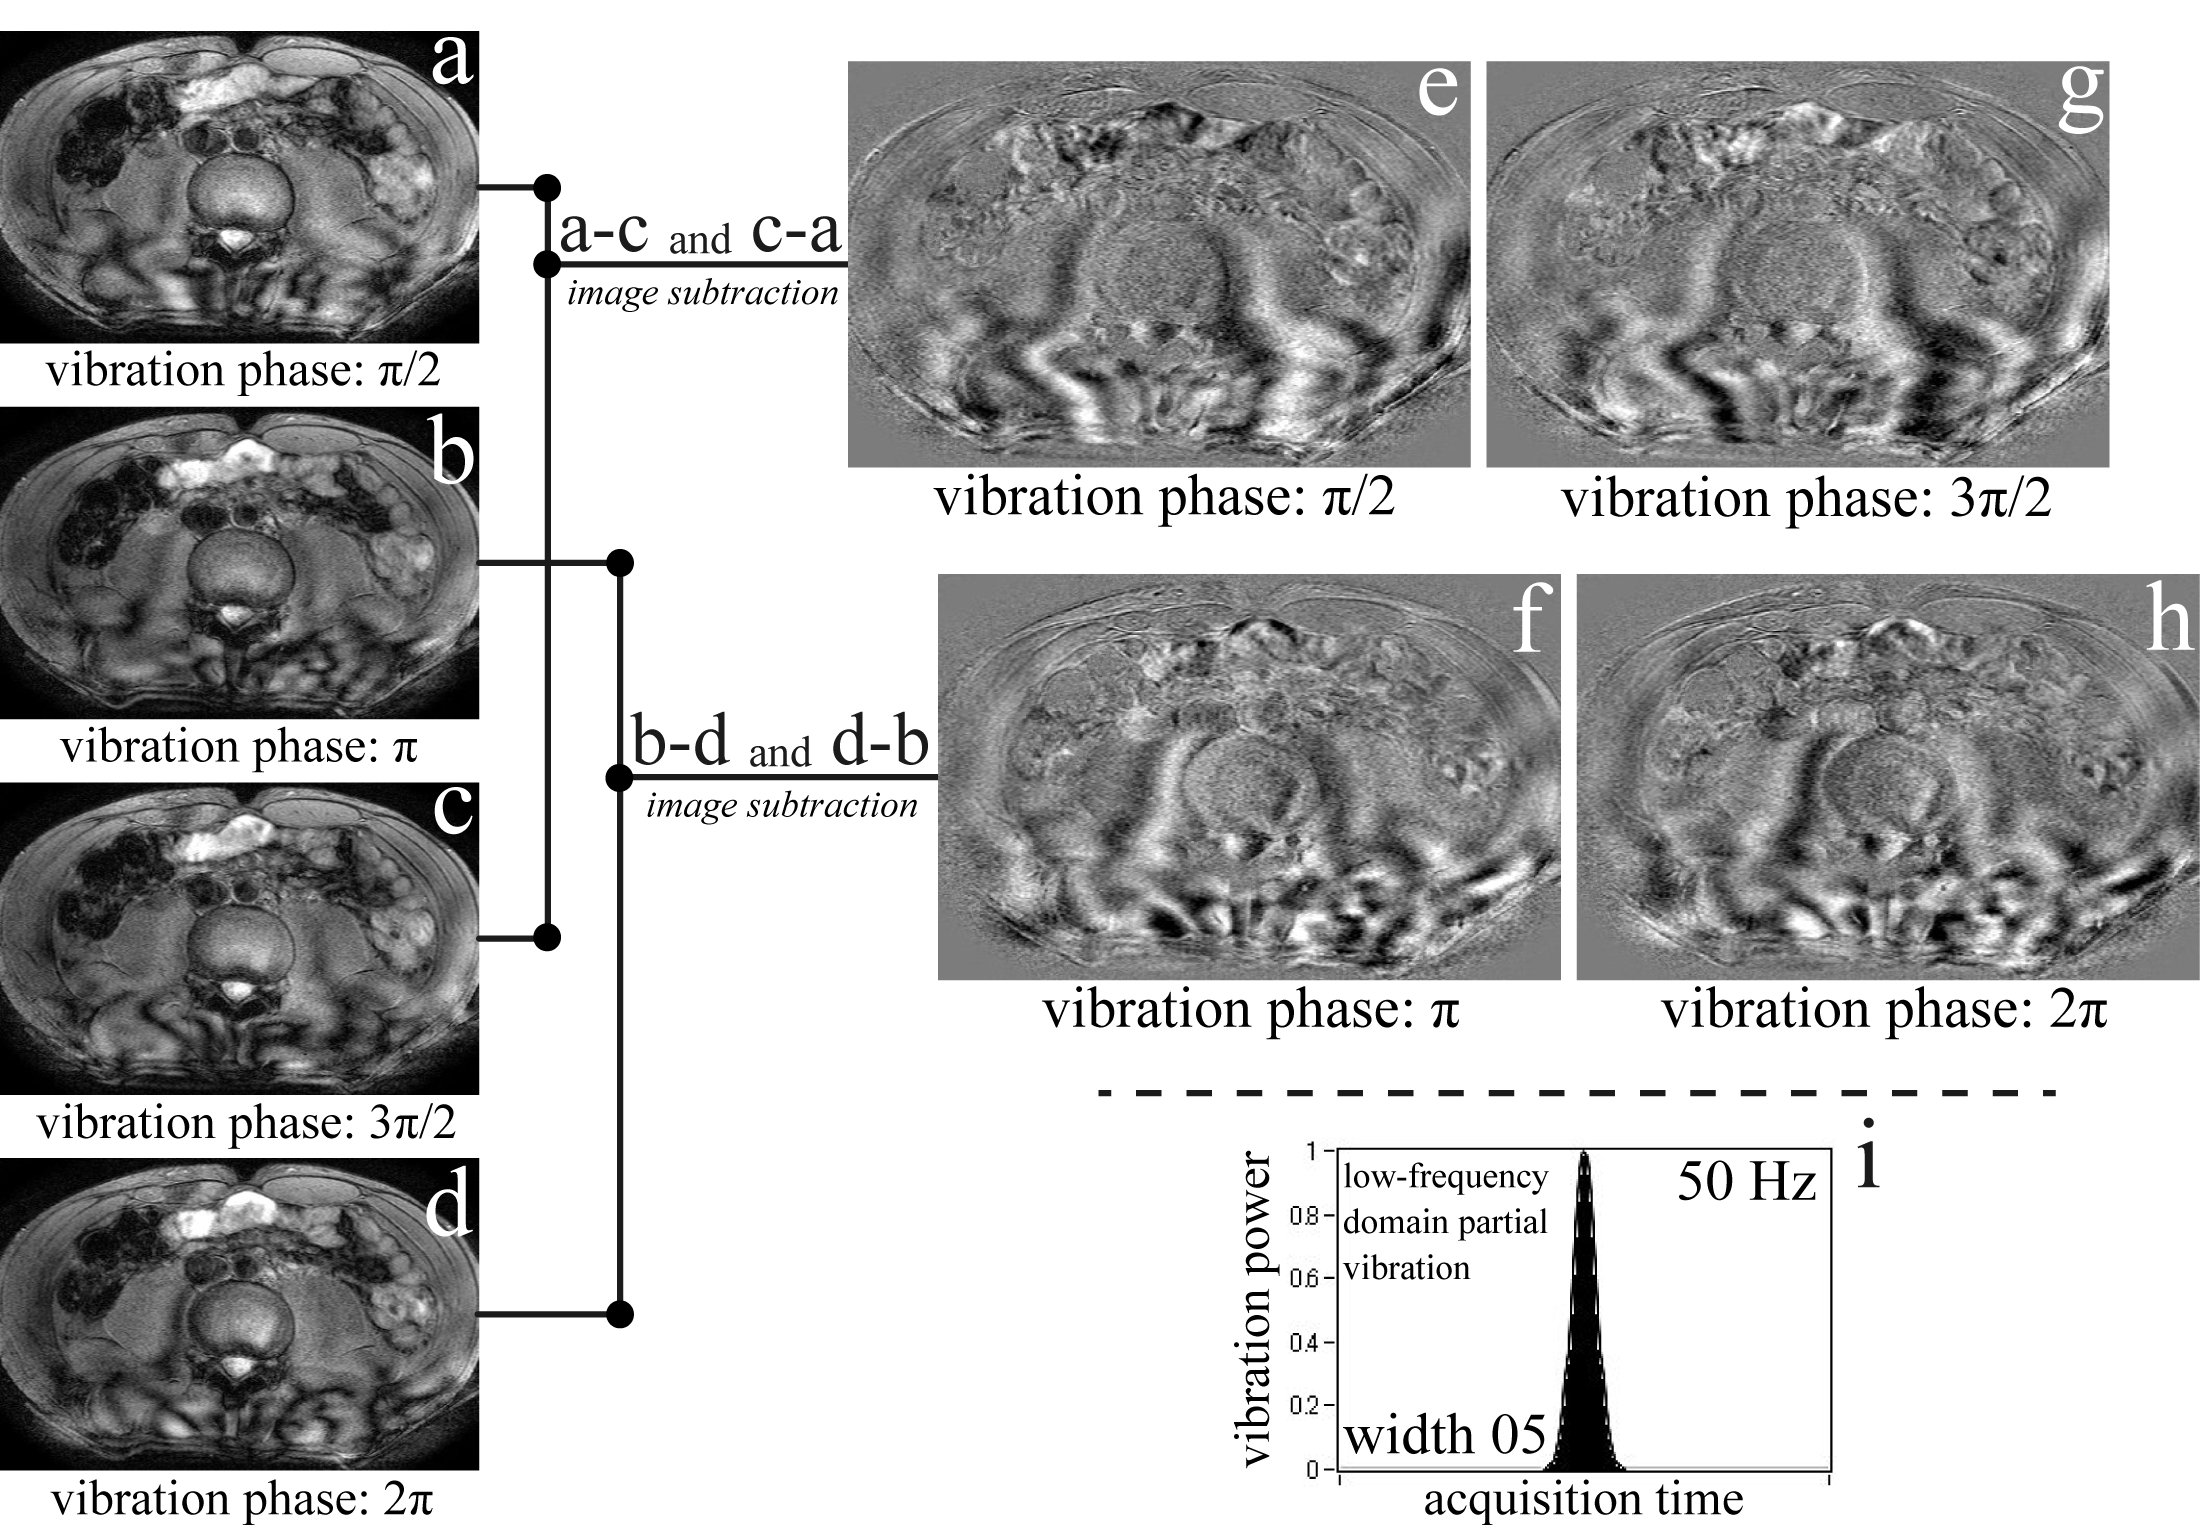
Figure 4. Make wave image from MR magnitude images
a-d: The volunteer lower back region MR magnitude images in partial vibration MRE. These images were 4 vibration phase offset. e-h: For creating the wave image, the opposite vibration phase images (a vs. c, b vs. d) were subtracted on each other as it turned out the organ structure information was eliminated. i: The vibration frequency of the volunteer study was 50 Hz and the vibration area of low-spatial frequency domain was width 05. Since the duration of “width 05” was a few seconds, it could dramatically eliminate the vibration-related discomfort.
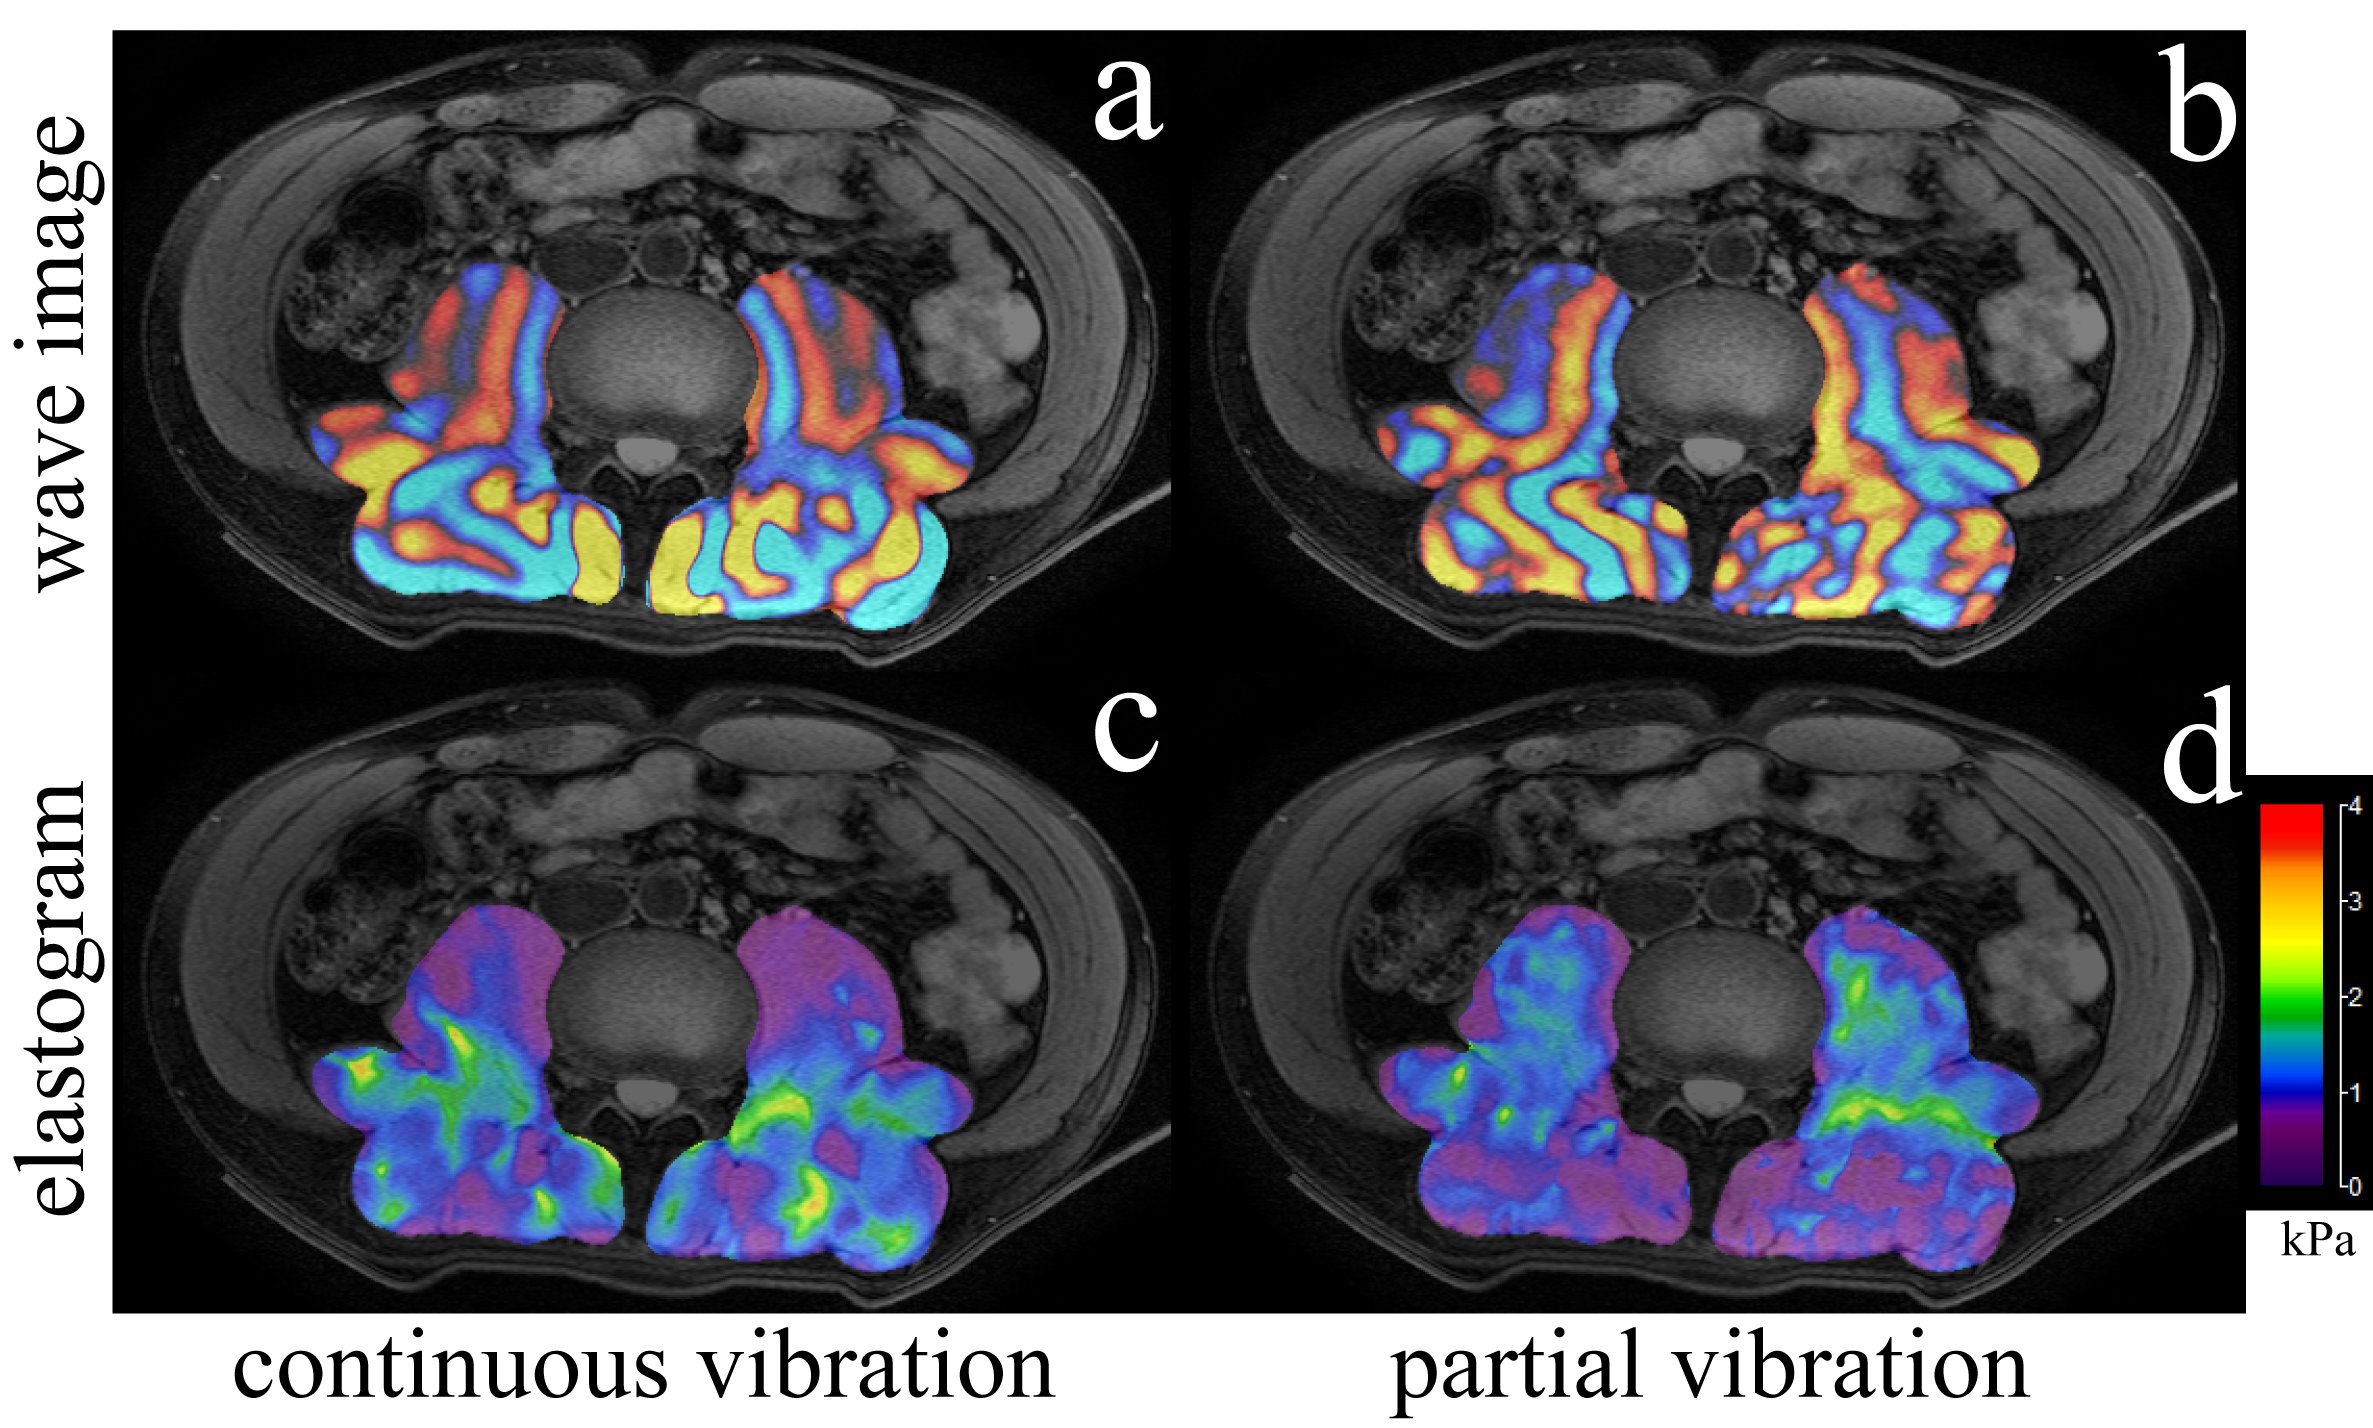
Figure 5. Volunteer study results
a,b: Each image was displayed by fusion of the wave image with the structural image. c,d: Each image was displayed by fusion of the elastogram with the structural image. a,c: Results of continuous vibration MRE as general MRE technique. The MR phase images used for the wave image, it was need phase unwrapping process. b,d: Results of partial vibration MRE. These results used only MR magnitude images (Zero-MR phase image MRE). The partial vibration MRE performance was comparable to that of a continuous vibration MRE.