3967
Cluster based analysis of fMRE data: computing heterogeneous regions of visual activation through correlation analysis.1Department of Nuclear medicine and Radiobiology, University of Sherbrooke, Sherbrooke, QC, Canada, 2ESEO (École Supérieure d'Électronique de l'Ouest), ANGERS, France, 3MR Clinical Science, Philips Healthcare, Markham, ON, Canada, 4Department of Mechanical Engineering, University of Sherbrooke, Sherbrooke, QC, Canada
Synopsis
A method for more completely assessing the regions of activation in functional Magnetic Resonance Elastography is presented. This method allows the full size of the regions of activation to be estimated and also provides information on the region substructure. Results are presented in conjunction with Time of Flight cerebrovascular data, showing the relationship between arterial dilation, viscoelastic changes, and region substructure. This method has excellent potential to expand our understanding of mechanical and structural changes in the active brain.
Introduction
Functional Magnetic Resonance Elastography (fMRE) has shown the ability to detect mechanical changes in the brain relative to cerebral activation.1-3 In a fMRE study of the human brain with visual stimulation, regions of activations are identified throughout the brain. The regions are small, given the selection criteria of each active region being a minimum number of contiguous pixels having p-values less than 0.05. The question arises of what is the true size of the activation region. Here we use a Cluster-based analysis as described by Heller et al. 4, where correlation values within the BOLD fMRI signal were used to extend the regions of activation. This method helps to ensure that all the activated voxels of the brain have been identified. Here, the cluster-based analysis is applied to fMRE data with visual stimulation to fully identify the regions of activation as well as identify substructures of associated voxels through correlation testing.Methods
The study was performed on seven healthy volunteers (5 males, 2 females) with ages between 24 and 32. Visual stimulation was provided by the Matlab Psychophysics Toolbox. First, the visual cortex was located using BOLD fMRI with 20 second stimulation intervals. Six repeated intrinsic MRE sequences for stimulation ON (5mins) and OFF (5mins) were then performed (total time: 6x5mins=30mins). The cardiac-gated intrinsic fMRE data was acquired on a 3T Philips Ingenia with 8 motion phases and 2.8 mm isotropic voxels. A Time of Flight (ToF) images of the cerebrovasculature during ON and OFF cycles were also taken for each subject.
Viscoelastic properties, i.e., storage and loss modulus, were calculated for each of the 6 measured displacement fields3,5,6 and registered in MNI space (1 mm isotropic voxels). Each group of ON and OFF were compared via the Welch’s t-test, with p-values recorded for each image voxel. Regions with more than 75 contiguous voxels each having a p-value of less than 0.05 (p1) were considered to be ‘activated’.
These Original activation regions are recorded and used to seed the cluster-based analysis. In this iterative process, the correlation between the fMRE signal for each voxel adjacent to an existing activation region is computed. Those voxels having correlation value above a specified threshold (p2) are added to a proposed region. This proposed region is then tested as a group for significant differences between ON and OFF fMRE signals. If the p-value for this t-test is less than a specified value (p3), the proposed region is accepted and becomes the new activation region for the following iteration. The process stops when the proposed region fails the t-test for significant differences between ON and OFF signals.To determine the substructure of an activation region, a list of voxel associations by the correlation test (p2) is kept during the iterative process. For this study, the critical p-values were: p1= 0.05, p2= 0.0005 and p3= 0.01.
Results
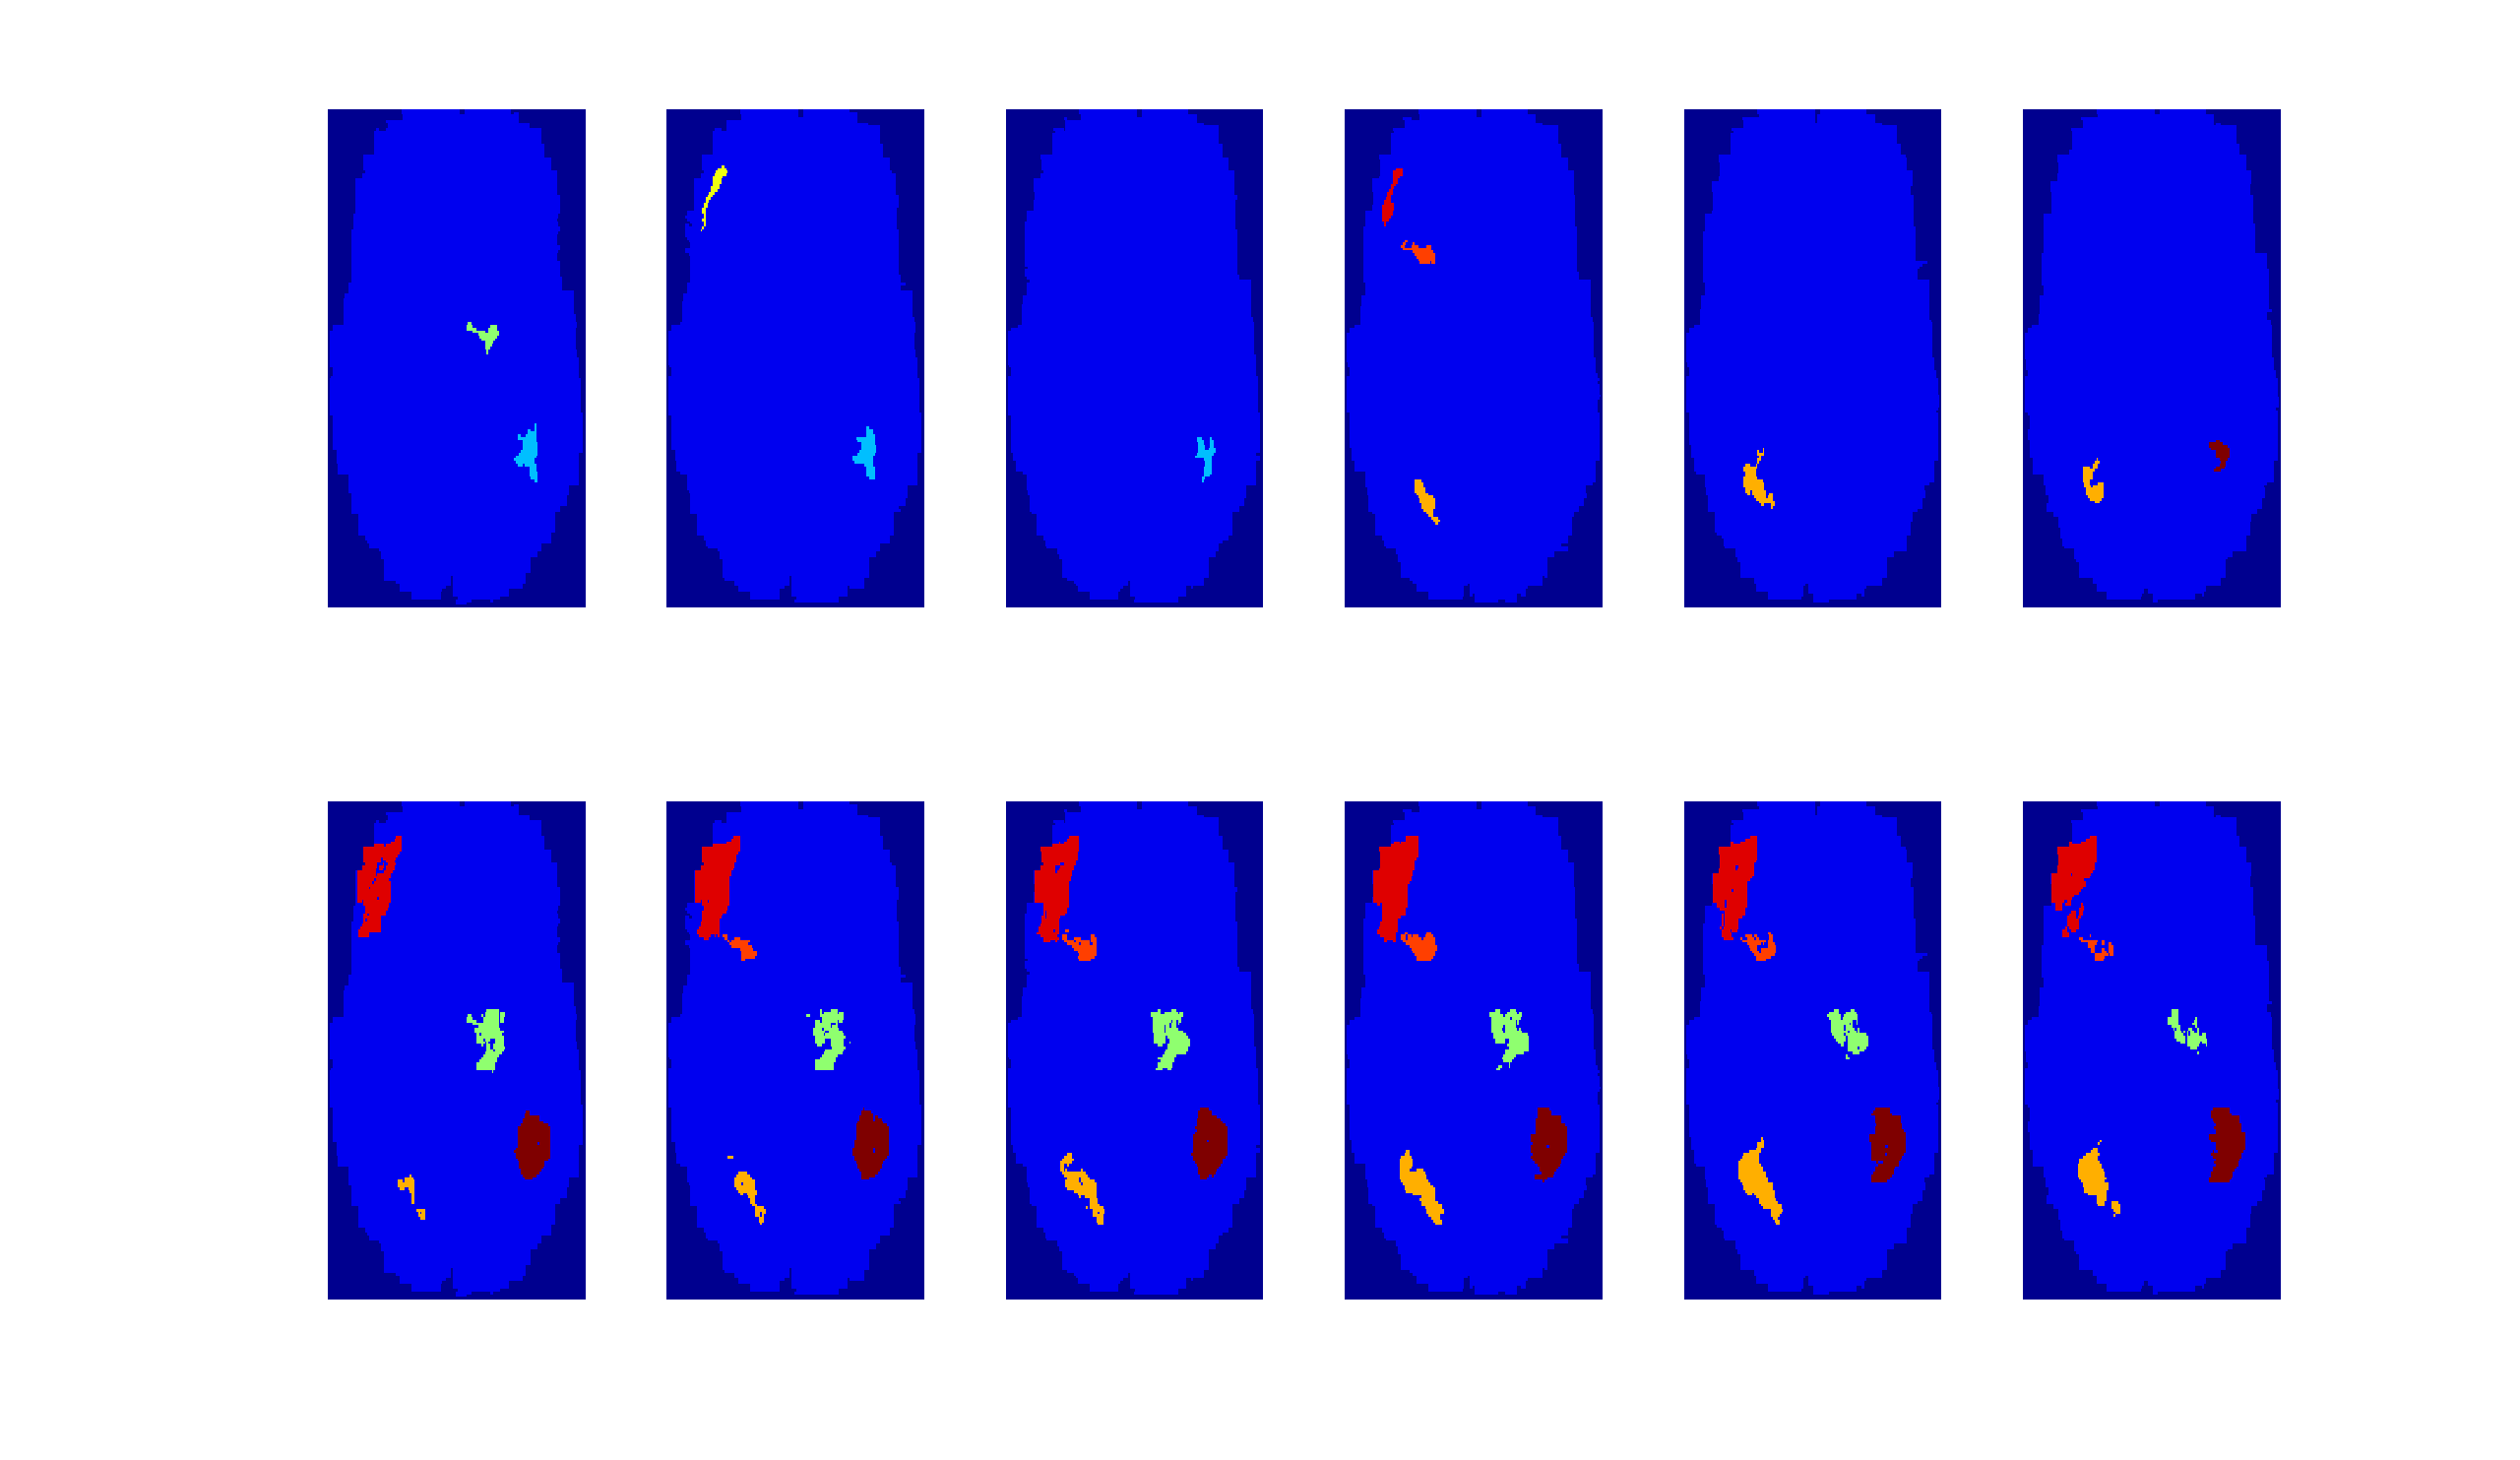
Figure 1 shows the cluster-based activation region geometries (bottom row) compared to the original regions (top row). Color indicates region number. During the clustering process, some regions may be absorbed by neighboring regions.
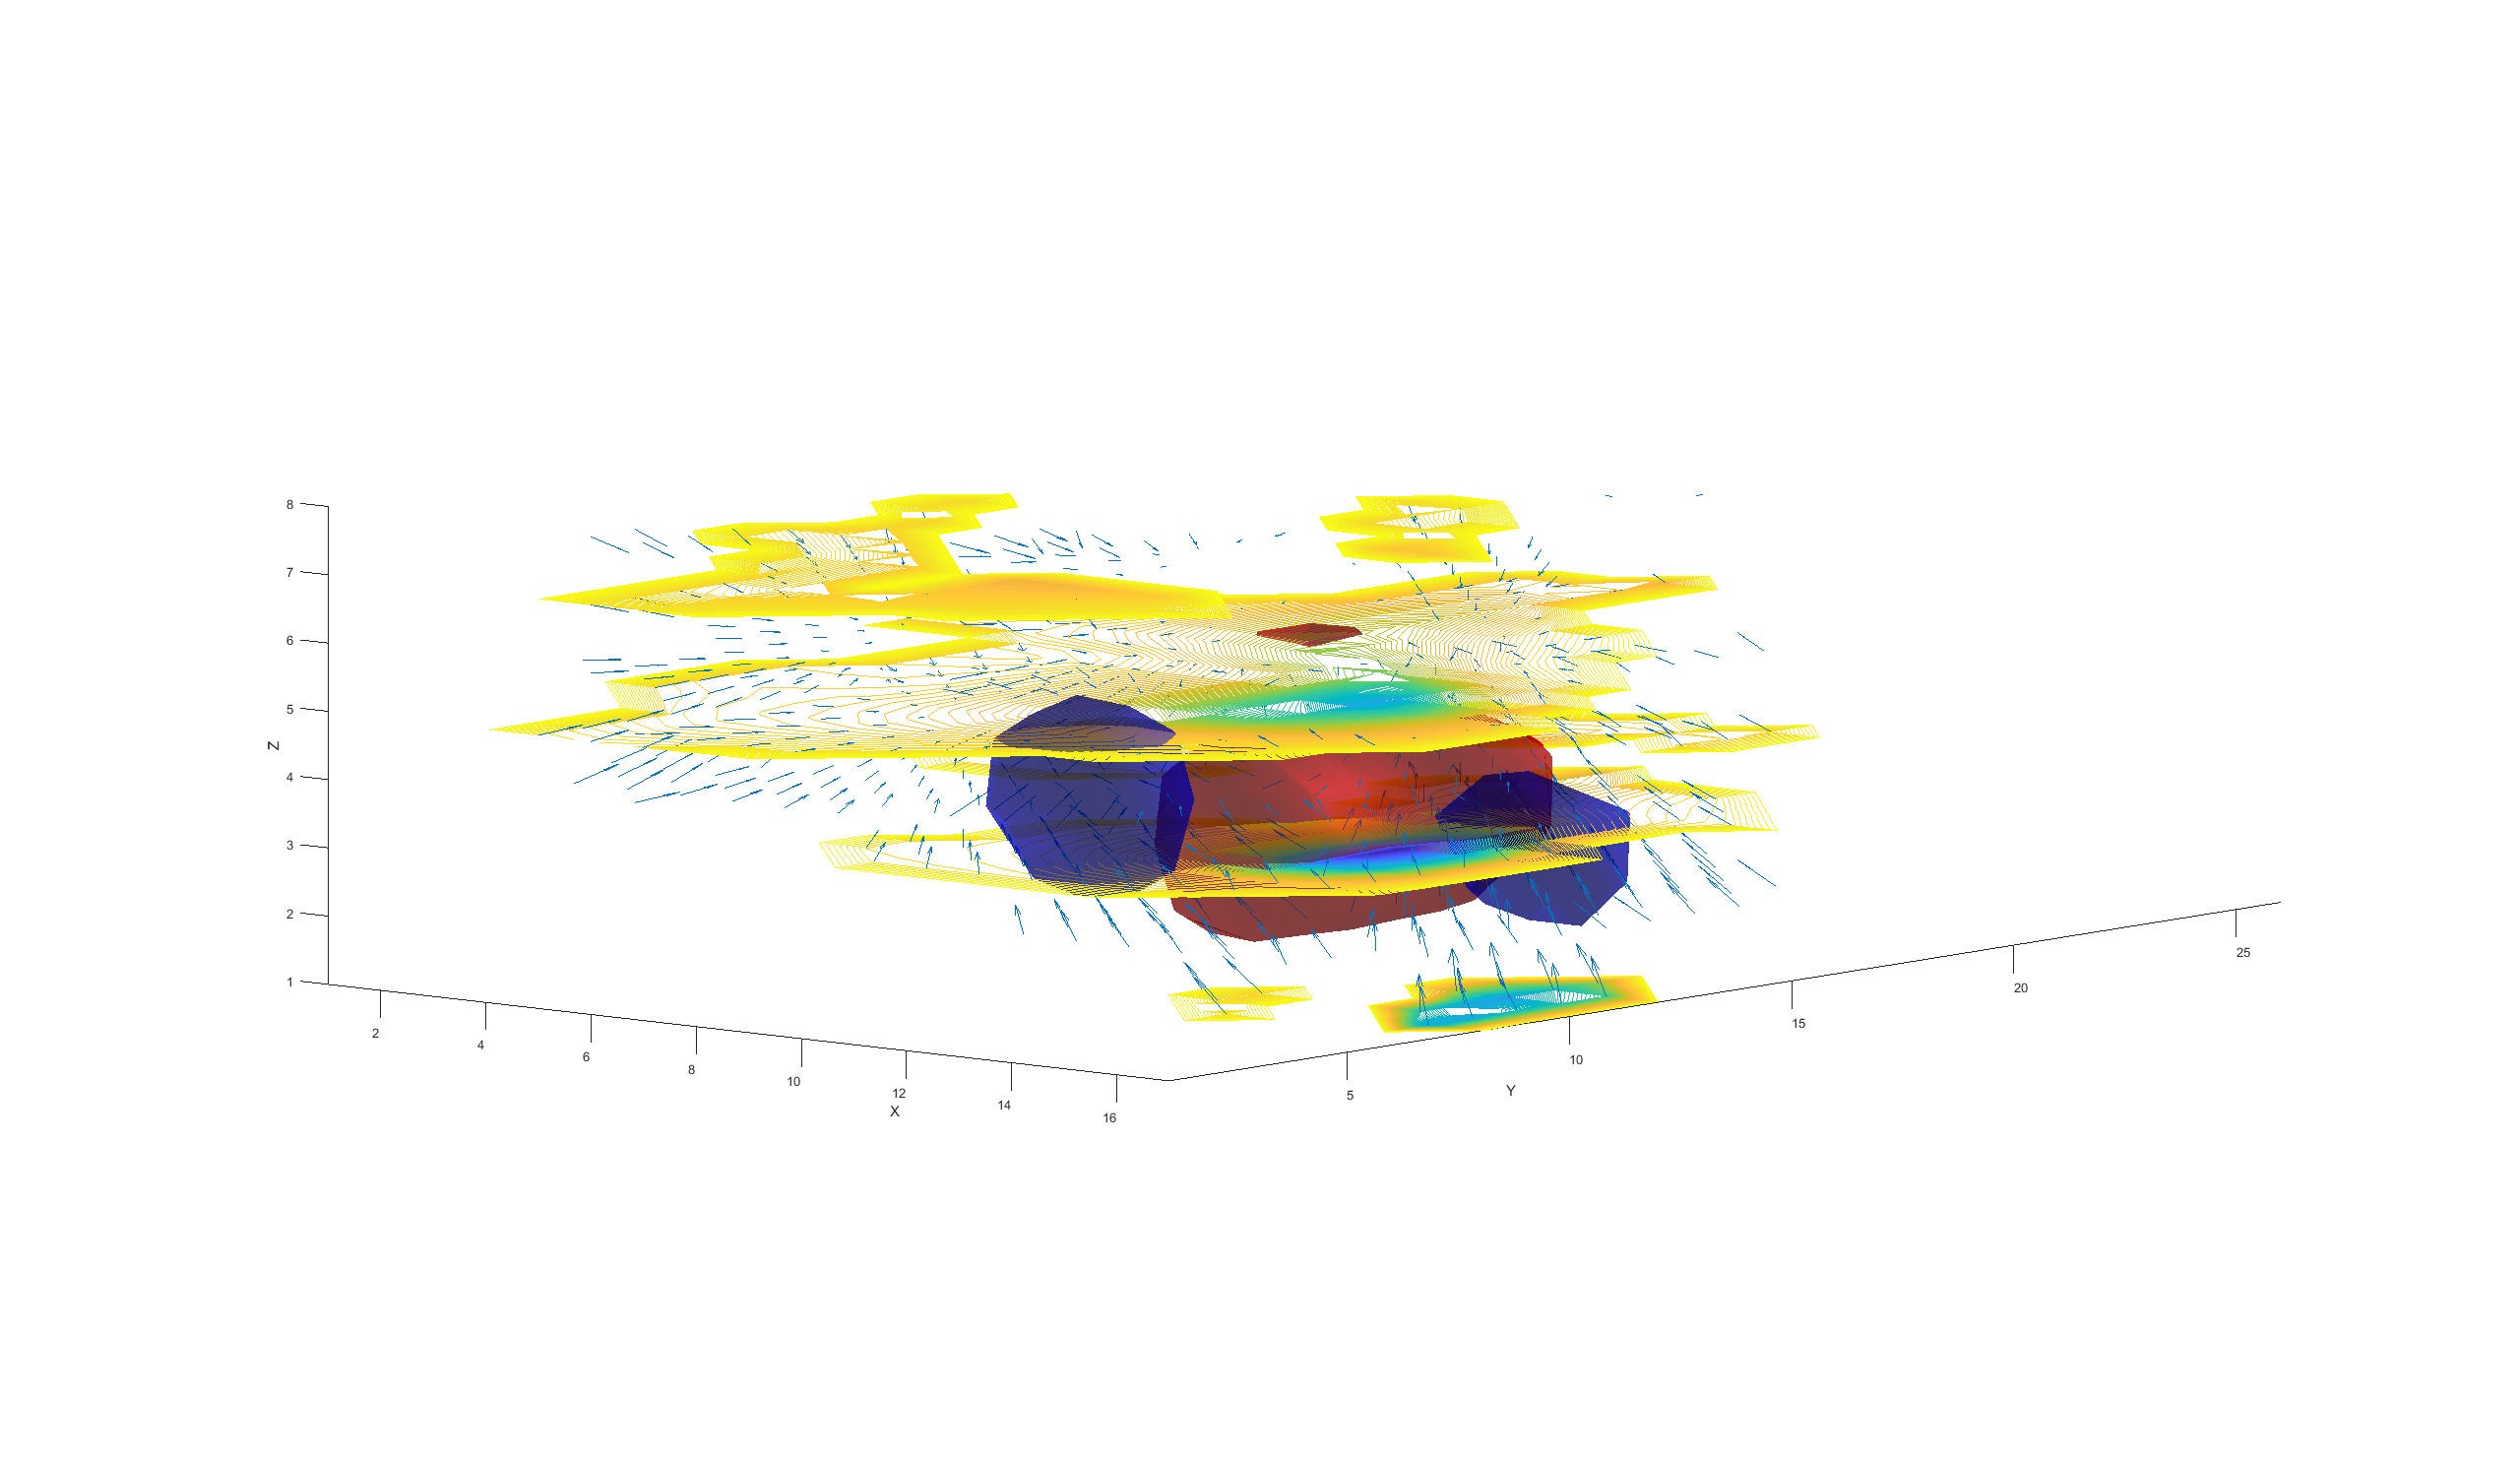
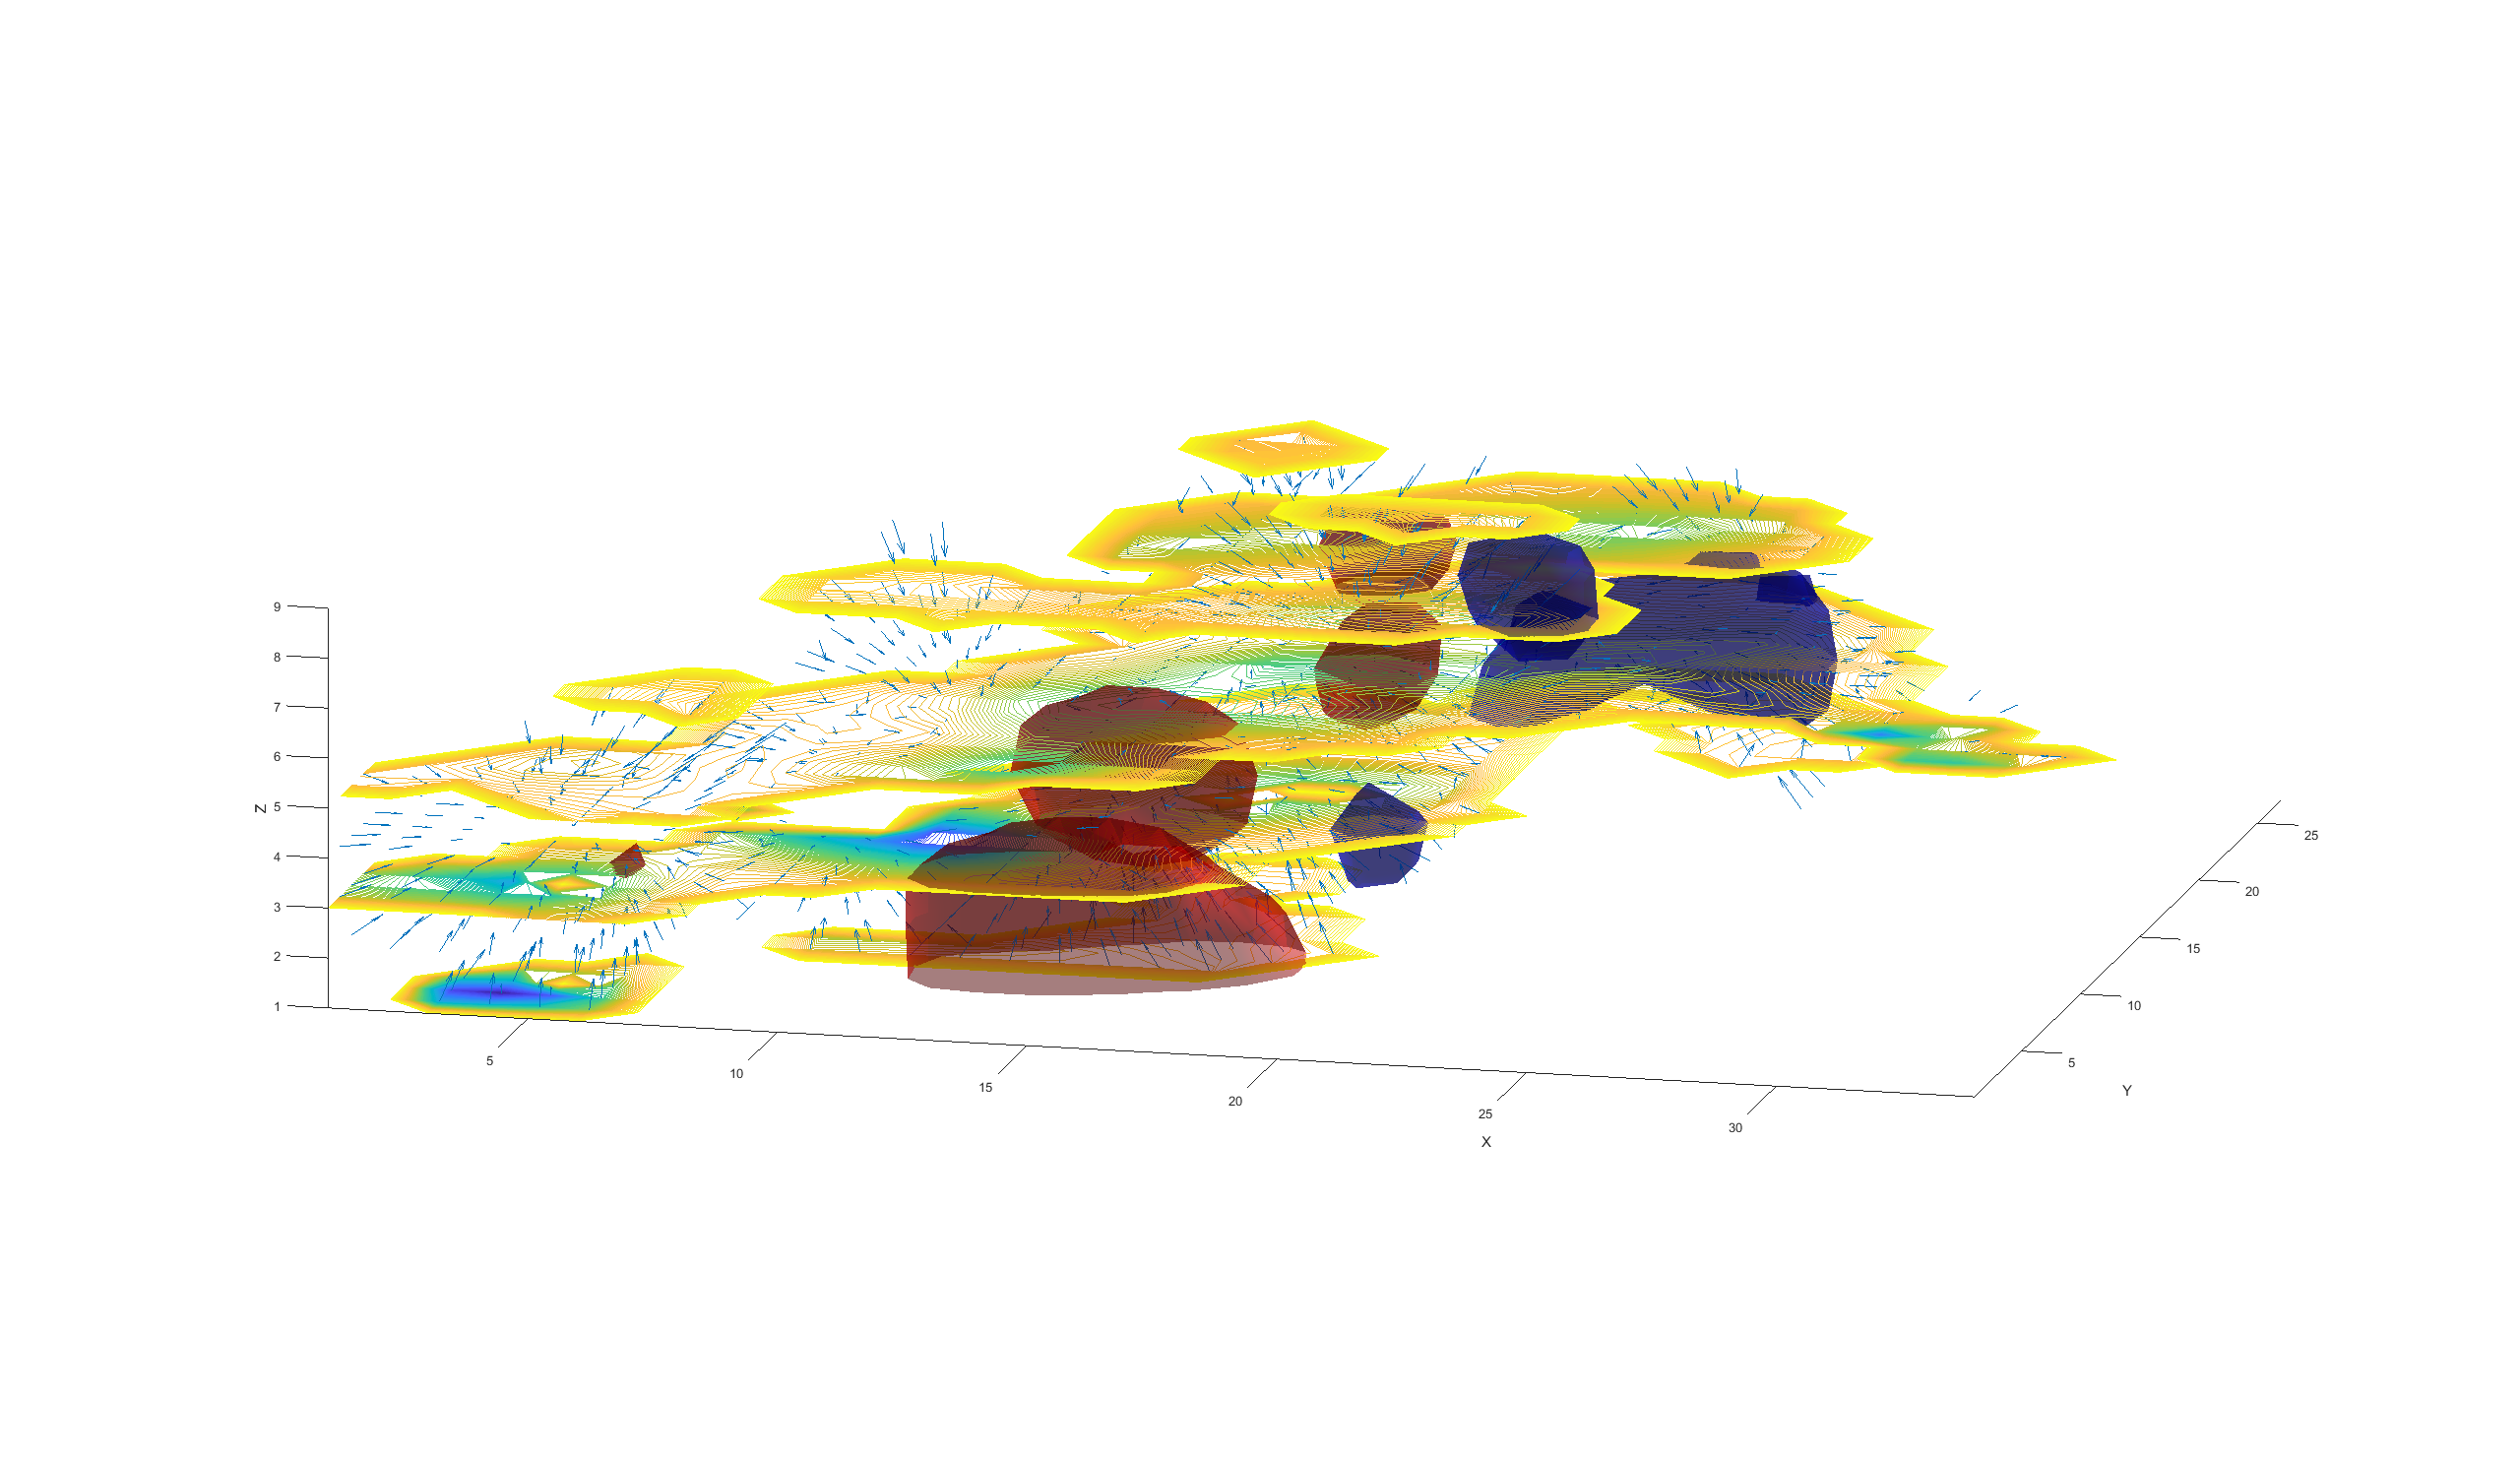
Figures 2 and 3 show detailed imaging results within two representative regions. Here, the color contours represent the changes in the storage modulus (blue represents a decreased stiffness with activation). The colored volumes represent the ToF vessel volumes during rest (blue) and stimulation (red). In these two cases, vessel volume increases (dilates) with activation. The arrows represent the correlation relationships between substructure voxels. Arrows at each voxel point toward the voxel within the original region that correlated with the corresponding substructure.
Discussion
These enlarged regions of activation provide a more complete comparison with the ToF data, allowing the changes in mechanical properties to be associated with arterial dilation or contraction within the regions of interest. In addition, identifying the substructure of each activation region will help to identify the physiological origins of mechanical changes within the region.Conclusion
Intrinsic activation fMRE allows us to explore mechanical and structural changes in the active brain. This new technique will help understand the cerebrovascular responses that are part of normal brain function and thus better comprehend the impact of disease and trauma.Acknowledgements
This work was supported in part by pilot study funding from the Réseau de Bio-imagerie du Québec. EEWVH is a member of the FRQS-funded Centre de recherche du Centre hospitalier universitaire de Sherbrooke (CR-CHUS).References
1. Hirsch S, Braun J, Sack I. Magnetic Resonance Elastography: Physical Background And Medical Applications. Wiley-VCH; 2017.
2. Patz S, et al. Mapping Neural Circuitry at High Speed (10Hz) using functional Magnetic Resonance Elastography (fMRE). In Proceedings of ISMRM. 2018; p. 0704.
3. Forouhandehpour R, Van Houten E. Imaging Visual Cortex Activity with Intrinsic Activation MRE. In Proceedings of ISMRM. 2018; p. 1068.
4. Heller R, Stanley D, Yekutieli D, et al. Cluster-based analysis of FMRI data. Neuroimage. 2006;33(2):599–608.
5. Gordon-Wylie S ,et al. MR Elastography at 1 Hz of Gelatin Phantoms Using 3D or 4D Acquisition.J. Magn. Reson. 2018; 296:112–120.
6. Weaver J, et al. Brain mechanical property measurement using MRE with intrinsic activation. Phys. Med. Biol. 2012;57(22):7275–7287.
Figures