3962
Analysis and Maximization of SNR in MR Elastography Inversion1Department of Electrical and Electronics Engineering, Bilkent University, Ankara, Turkey, 2National Magnetic Resonance Research Center (UMRAM), Ankara, Turkey
Synopsis
Reconstructed elastography maps suffer from noise due to derivative operations in the inversion algorithms. Considering the noise on the complex MRI signal, SNR of the reconstructed elastogram is derived analytically for k-MDEV inversion. Verified SNR derivations by Monte Carlo Simulations, an SNR-weighted k-MDEV inversion was proposed to maximize SNR of the elastogram. Quality of the proposed reconstruction was assessed by estimation error, noise performance and edge response analyses. SNR of the elasticity improved twice as the conventional method. Results on phantom and human liver data are also provided. As future work, this analysis will be performed for other inversion methods.
Introduction
Although SNR of the elasticity map is critical for diagnostic purposes, there are only a few studies on the SNR of MR elastography (MRE)1,2. Moreover, the SNRs of the elasticity reconstruction algorithms have not been investigated analytically. Considering the noise on the complex MRI signal, SNR of the reconstructed elasticity map can be formulated. This analysis can be beneficial for deciding weights for combining multi-directional, multi-frequency MRE data in order to obtain high quality elasticity maps.Theory
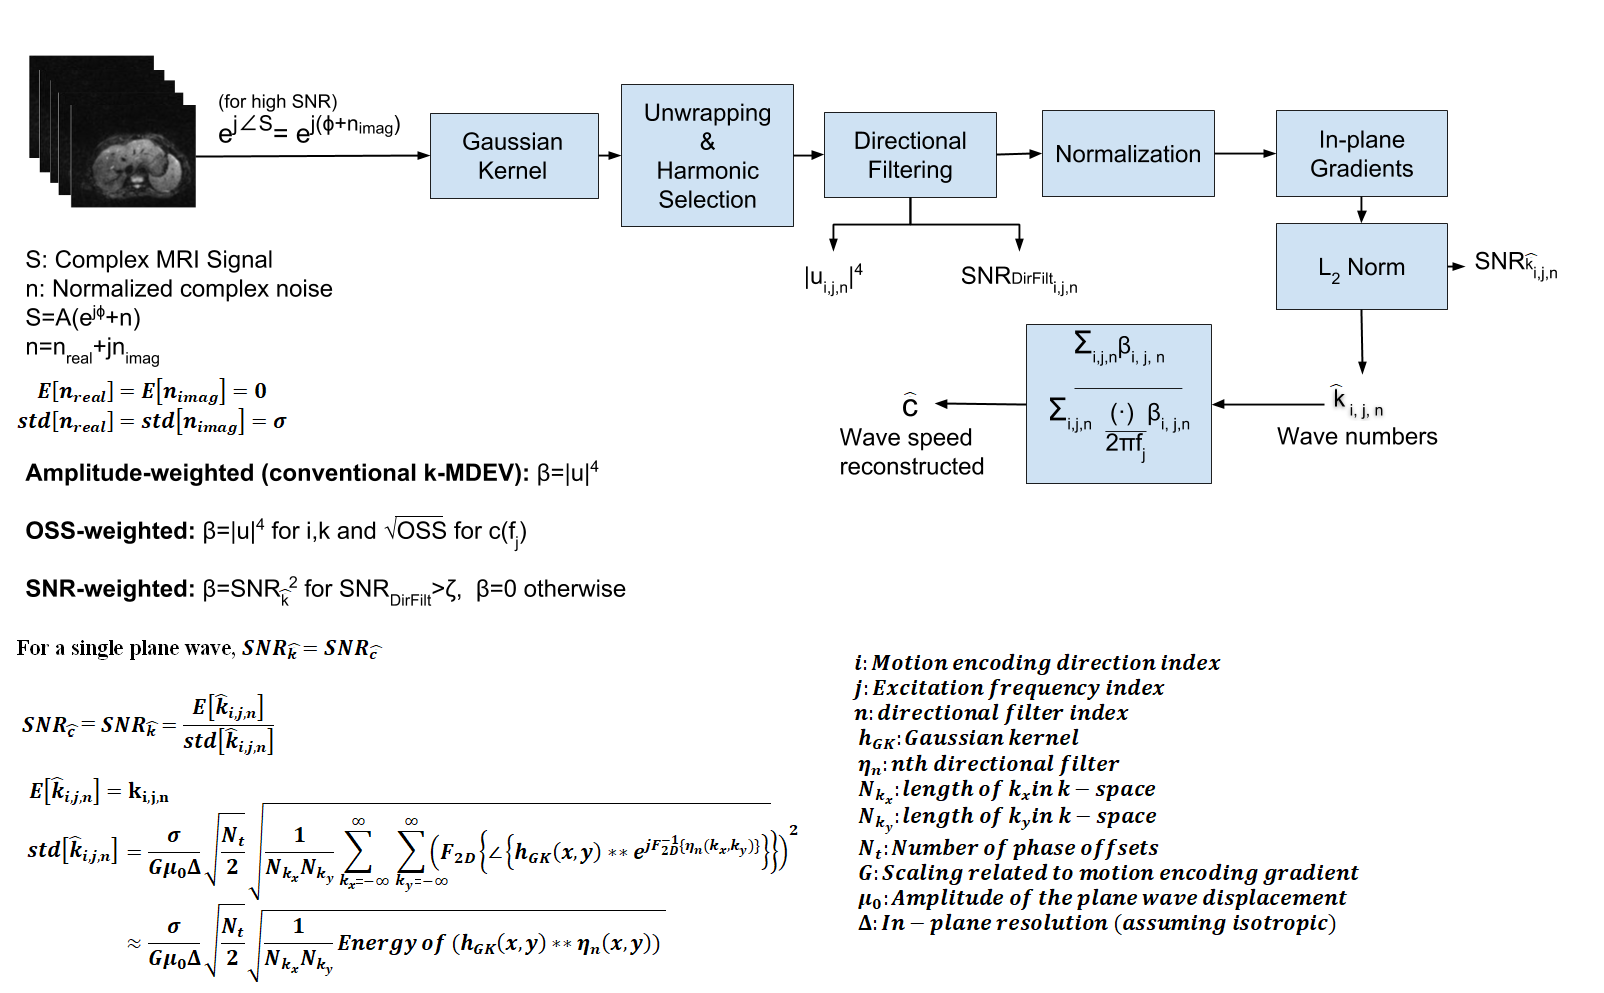
The primary noise source on complex MRI signal is thermal and modelled as additive white Gaussian noise (WGN). With the assumption of high SNR, the noise characteristics of the wave speed obtained using k-MDEV inversion3 technique can be linearized and analytical expression for SNR of the wave-speed (SNRc), shown in Figure 1, can be obtained. It can be seen that SNRc is directly proportional with SNR of the MRI (SNRMRI) signal, voxel size, number of directional filters, and inversely proportional with the number of phase offsets and size of the Gaussian kernel.Methods
To verify analytical derivations, SNRc was computed by Monte Carlo Simulations (MCS) conducted on a simulated plane wave data by adding WGN with SNR swept from 1 to 28 and compared with analytically derived SNR of the wave speed map. The minimum SNR value (SNRmin) that high SNR assumption holds for the analytical derivations was determined. Using this information, an SNR-weighted elasticity reconstruction was implemented by modifying k-MDEV inversion, as depicted in Figure 1. In the proposed reconstruction, computed wave numbers at each frequency, motion encoding direction and directional filter are weighted averaged with the square of SNR of wave numbers (SNRk). SNR values of the filtered displacements at the output of directional filtering are computed analytically and corresponding SNRks are set to zero if they are under the threshold, determined by SNRmin. To test the SNR-weighted reconstruction; estimation error, noise performance and edge response analyses were conducted. Estimation error and noise performance analyses were conducted on a 2D homogeneous phantom. For estimation error, the mean-squared-error between the reconstructed wave speed and the ground truth was calculated. Moreover, noise performance of the proposed SNR-weighted inversion was assessed by adding WGN with SNR swept and calculating standard deviation of the wave speed map over repetitions. For edge response analysis, simulations on a 2D step phantom with two mediums having different elasticities were conducted and response of the reconstruction was investigated at the edge between mediums. For validation on experimental data, multifrequency MRE phantom data4, reported in previous studies3,5, and multifrequency MRE liver data6 were used. For comparison, all the analyses were additionally performed on amplitude-weighted (conventional) and Octahedral Shear Strain (OSS)1-weighted7 k-MDEV.Results
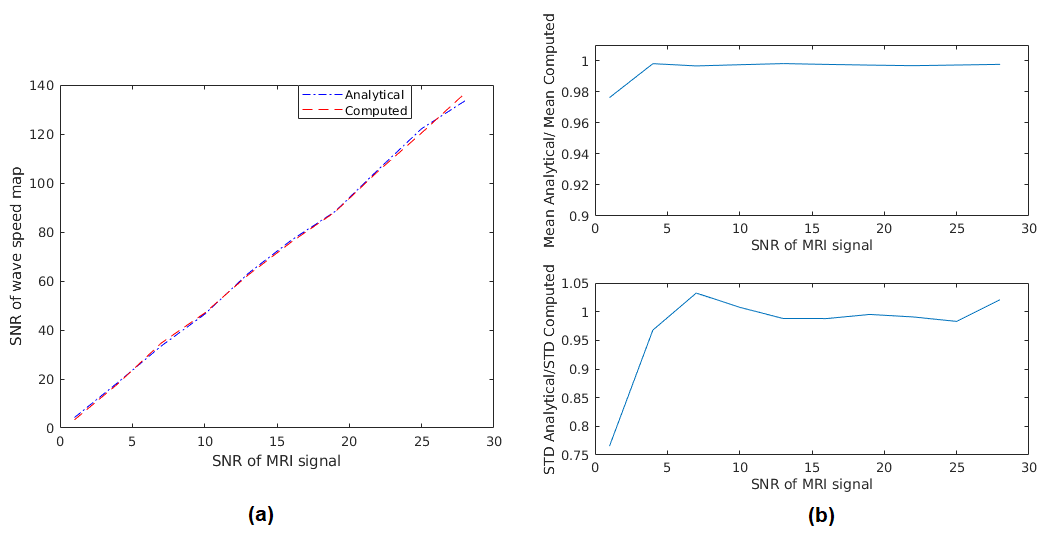
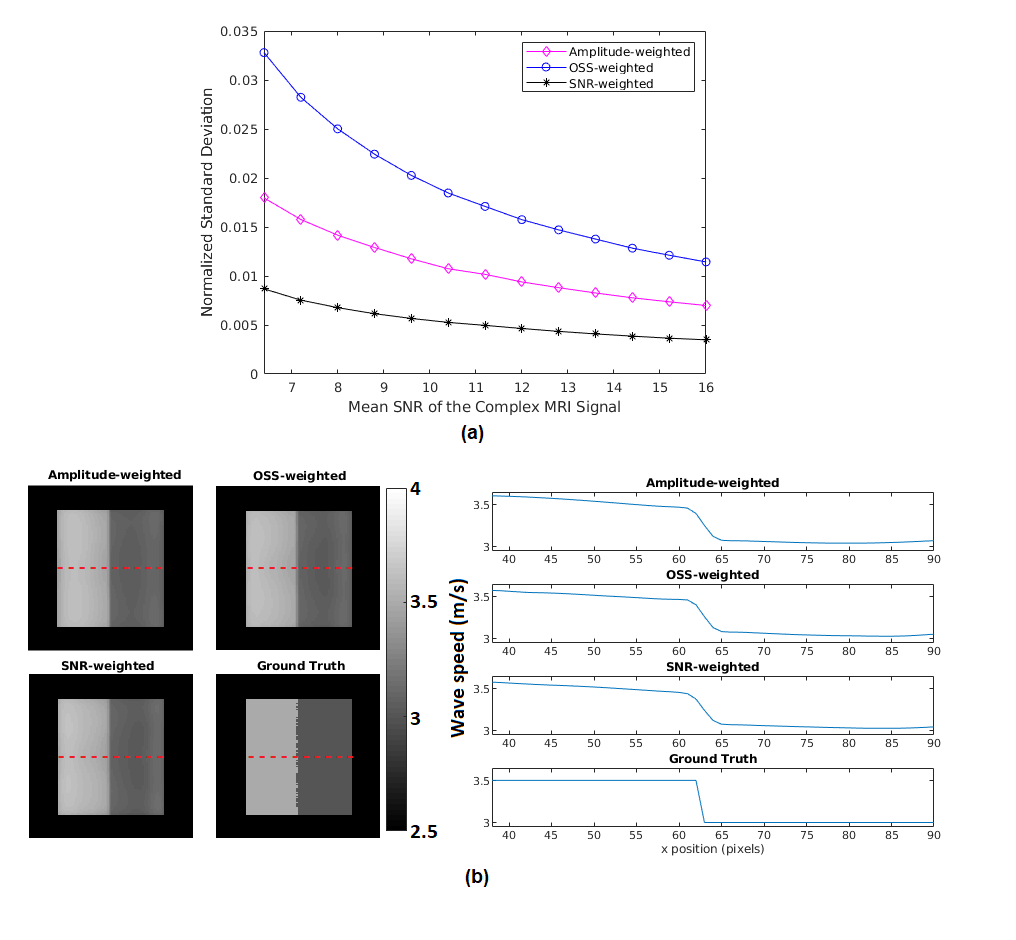
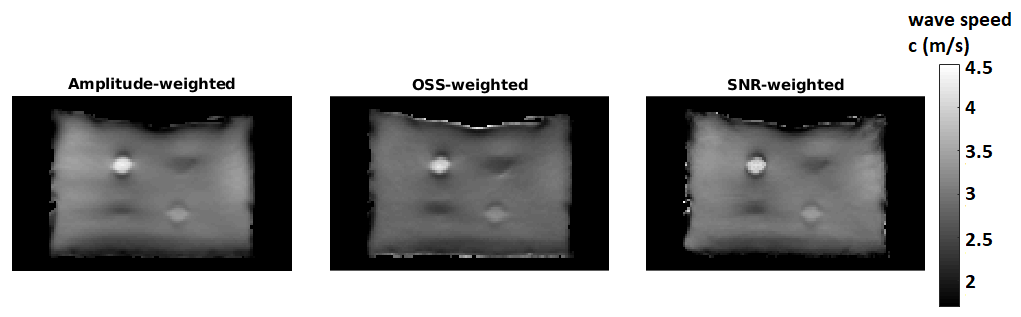
Comparison of computed and analytical SNRc is shown in Figure 2(a,b). Estimation errors for all reconstructions were computed to be less than 0.2%, indicating the accuracy of the methods. Results of MCS to assess the noise performance and edge response of the reconstructions are depicted in Figure 3(a,b). Furthermore, reconstructed wave speed maps for MRE phantom and human liver are depicted in Figure 4 and 5, respectively.Discussion
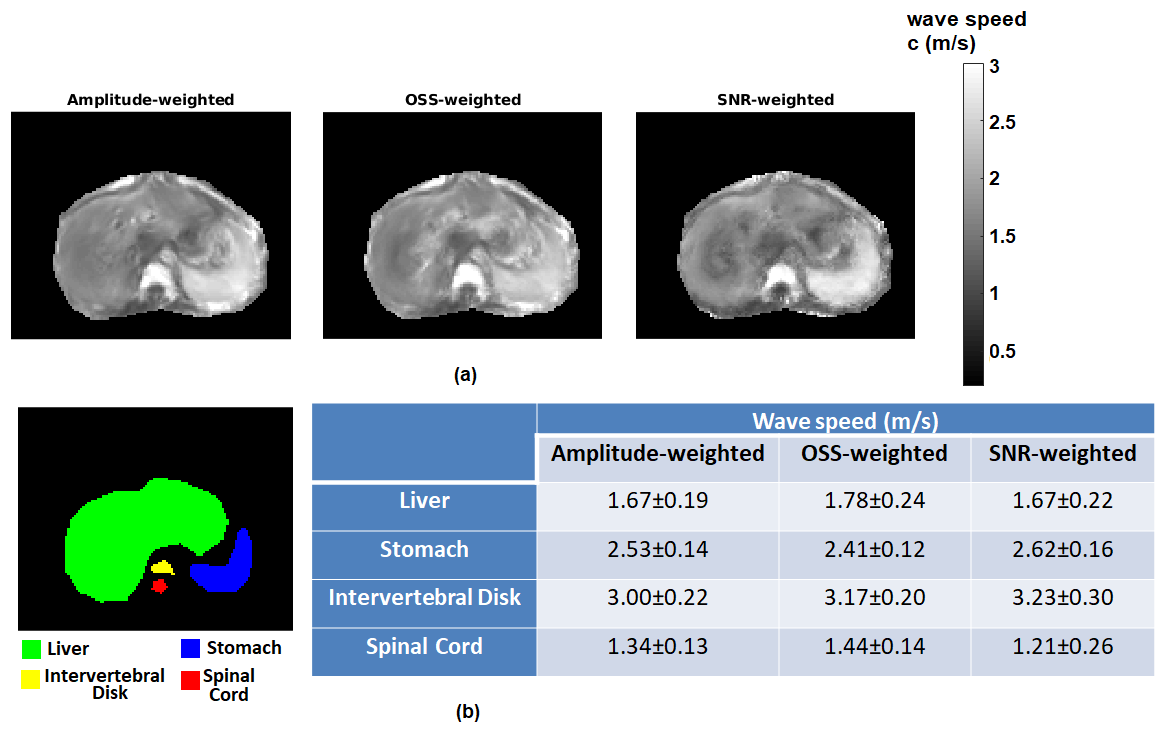
Analytically derived SNR is verified by computed SNR using MCS, which holds for SNRMRI>6 (Figure 2). This implies that the high SNR assumption used in the derivations fails below this value. According to MCS results, depicted in Figure 3(a), SNR of the elastogram was improved twice and four times when SNR-weights were used instead of amplitude-weights and OSS-weights, respectively. As seen in Figure 3(b), there are no differences for the edge response of the reconstructions; hence resolutions are measured to be the same for the parameters used. In Figure 4, some wave artifacts are observed at the background of the amplitude-weighted inversion which are suppressed in other reconstructions. Mean wave speed of liver, stomach, intervertebral disk and spinal cord were found to be consistent with the values reported in the literature3. In addition, contrast of the SNR-weighted wave speed map of the liver is slightly better than other reconstructions. Despite the absence of a ground truth for human liver results, based on significant improvements in the SNR of the elastography maps without any loss in resolution and accuracy, one may argue that this weighting can be useful to achieve SNR maximization for MRE inversion.Conclusion
SNR of the elasticity map for the k-MDEV algorithm has been derived and used as weights to combine multiple data to obtain possible maximal SNR for the elastogram. In addition, this analysis could be useful for tuning parameters of the inversion to increase SNR of the elastograms. Moreover, SNR performances of inversion algorithms could be compared. As a future work, this analysis will be performed to other inversion techniques.Acknowledgements
No acknowledgement found.References
[1] McGarry MDJ, Van Houten EEW, Perrinez PR, Pattison AJ, WeaverJB, Paulsen KD. An octahedral shear strain-based measure of SNR for 3D MR elastography. Phys Med Biol 2011;56:N153–N164
[2] Manduca A, Lake DS, Huynh KT, Eon RS, Annoni EM, Ehman RL. Consistent SNR Measures for Magnetic Resonance Elastography. In Proceedings of the 23rd Annual Meeting of ISMRM, Toronto, Ontaria, Canada, 2015. p. 2519
[3] Tzschatzsch H , Guo J, Dittmann F, Hirsch S, Barnhill E, Johrens K, Braun J, Sack I. Tomoelastography by multifrequency wave number recovery from time-harmonic propagating shear waves. Med Image Anal2016;30:1–10
[4] Charite Universitatsmedizin Berlin, Germany. MRE Phantom Data. https://bioqic-apps.charite.de/downloads Accessed November 6,2018.
[5] Papazoglou S, Hirsch S, Braun J, Sack I. Multifrequency inversion in magnetic resonance elastography. Phys Med Biol 2012;57:2329–2346 McCurry M et al., Elastojournal, 41(3): 724-33, 2015
[6] Charite Universitatsmedizin Berlin, Germany. MRE Liver Data. https://bioqic-apps.charite.de/downloads Accessed November 6,2018.
[7] Ariyurek C, Tasdelen B, Ergun AS, Ider YZ, Atalar E. Usage of Octahedral Shear Strain Weights in the Inversion of Multifrequency MR Elastography. In Proceedings of the 26th Annual Meeting of ISMRM, Paris, France, 2018. p. 1076.
Figures