3960
In-Vivo Quantification of Aortic Stiffness using a Multi-Slice Spin-Echo Echo-Planar Imaging Sequence: A Comparison to a Gradient-Recalled Echo Sequence1Department of Radiology, The Ohio State University Wexner Medical Center, Columbus, OH, United States, 2Department of Biomedical Engineering, The Ohio State University, Columbus, OH, United States, 3Siemens Healthcare USA, Columbus, OH, United States, 4Internal Medicine-Cardiovascular Division, The Ohio State University Wexner Medical Center, Columbus, OH, United States
Synopsis
Aortic stiffness is an important biomarker of cardiovascular diseases. Magnetic Resonance Elastography (MRE) is a non-invasive tool for measuring in-vivo aortic stiffness. Gradient-Recalled Echo (GRE) MRE sequences are widely employed for aortic MRE. However, GRE MRE sequences are sensitive to T2* decay, leading to signal loss and lower Signal-to-Noise Ratio (SNR). In this work, a cardiac-gated Spin-Echo Echo-Planar Imaging (SE-EPI) MRE sequence was developed and validated against GRE MRE. Similar aortic stiffness was observed between the two techniques. Moreover, shorter scan time, higher first-harmonic amplitude, and Octahedral Shear Strain-Based SNR (OSS-SNR) were achieved using SE-EPI MRE (p<0.05).
Introduction
Aortic stiffness is associated with a variety of cardiovascular diseases (e.g., aortic aneurysm, hypertension, age-induced vascular degeneration1-3). Moreover, aortic stiffening is an indication of elevated risk of cardiovascular events, making aortic stiffness an important factor in understanding and detecting of cardiovascular diseases4-5. However, conventional mechanical testing to estimate aortic stiffness is based on ex-vivo specimens and, thus, is not clinically applicable. On the other hand, the established Pulse Wave Velocity (PWV)-method only provides global stiffness estimation without crucial spatial information6-7. Aortic Magnetic Resonance Elastography (MRE) is a non-invasive phase-contrast technique to measure aortic stiffness and has been demonstrated to be an excellent tool with high reproducibility7. Currently, Gradient-Recalled Echo (GRE) MRE sequences are widely employed for aortic MRE measurements8-10. However, GRE MRE is sensitive to T2* decay11, leading to signal loss and lower Signal-to-Noise Ratio (SNR). In addition, acquiring multiple slices using GRE MRE results in prolonged scan time.
Therefore, the goal of this work is to study the feasibility and reproducibility of a multi-slice Spin-Echo Echo-Planar Imaging (SE-EPI) MRE sequence for in-vivo aortic MRE measurements. Specifically, this work aims to compare the mean aortic stiffness, first-harmonic amplitude, and Octahedral Shear Strain-Based SNR (OSS-SNR) obtained using SE-EPI and GRE MRE sequences.
Methods
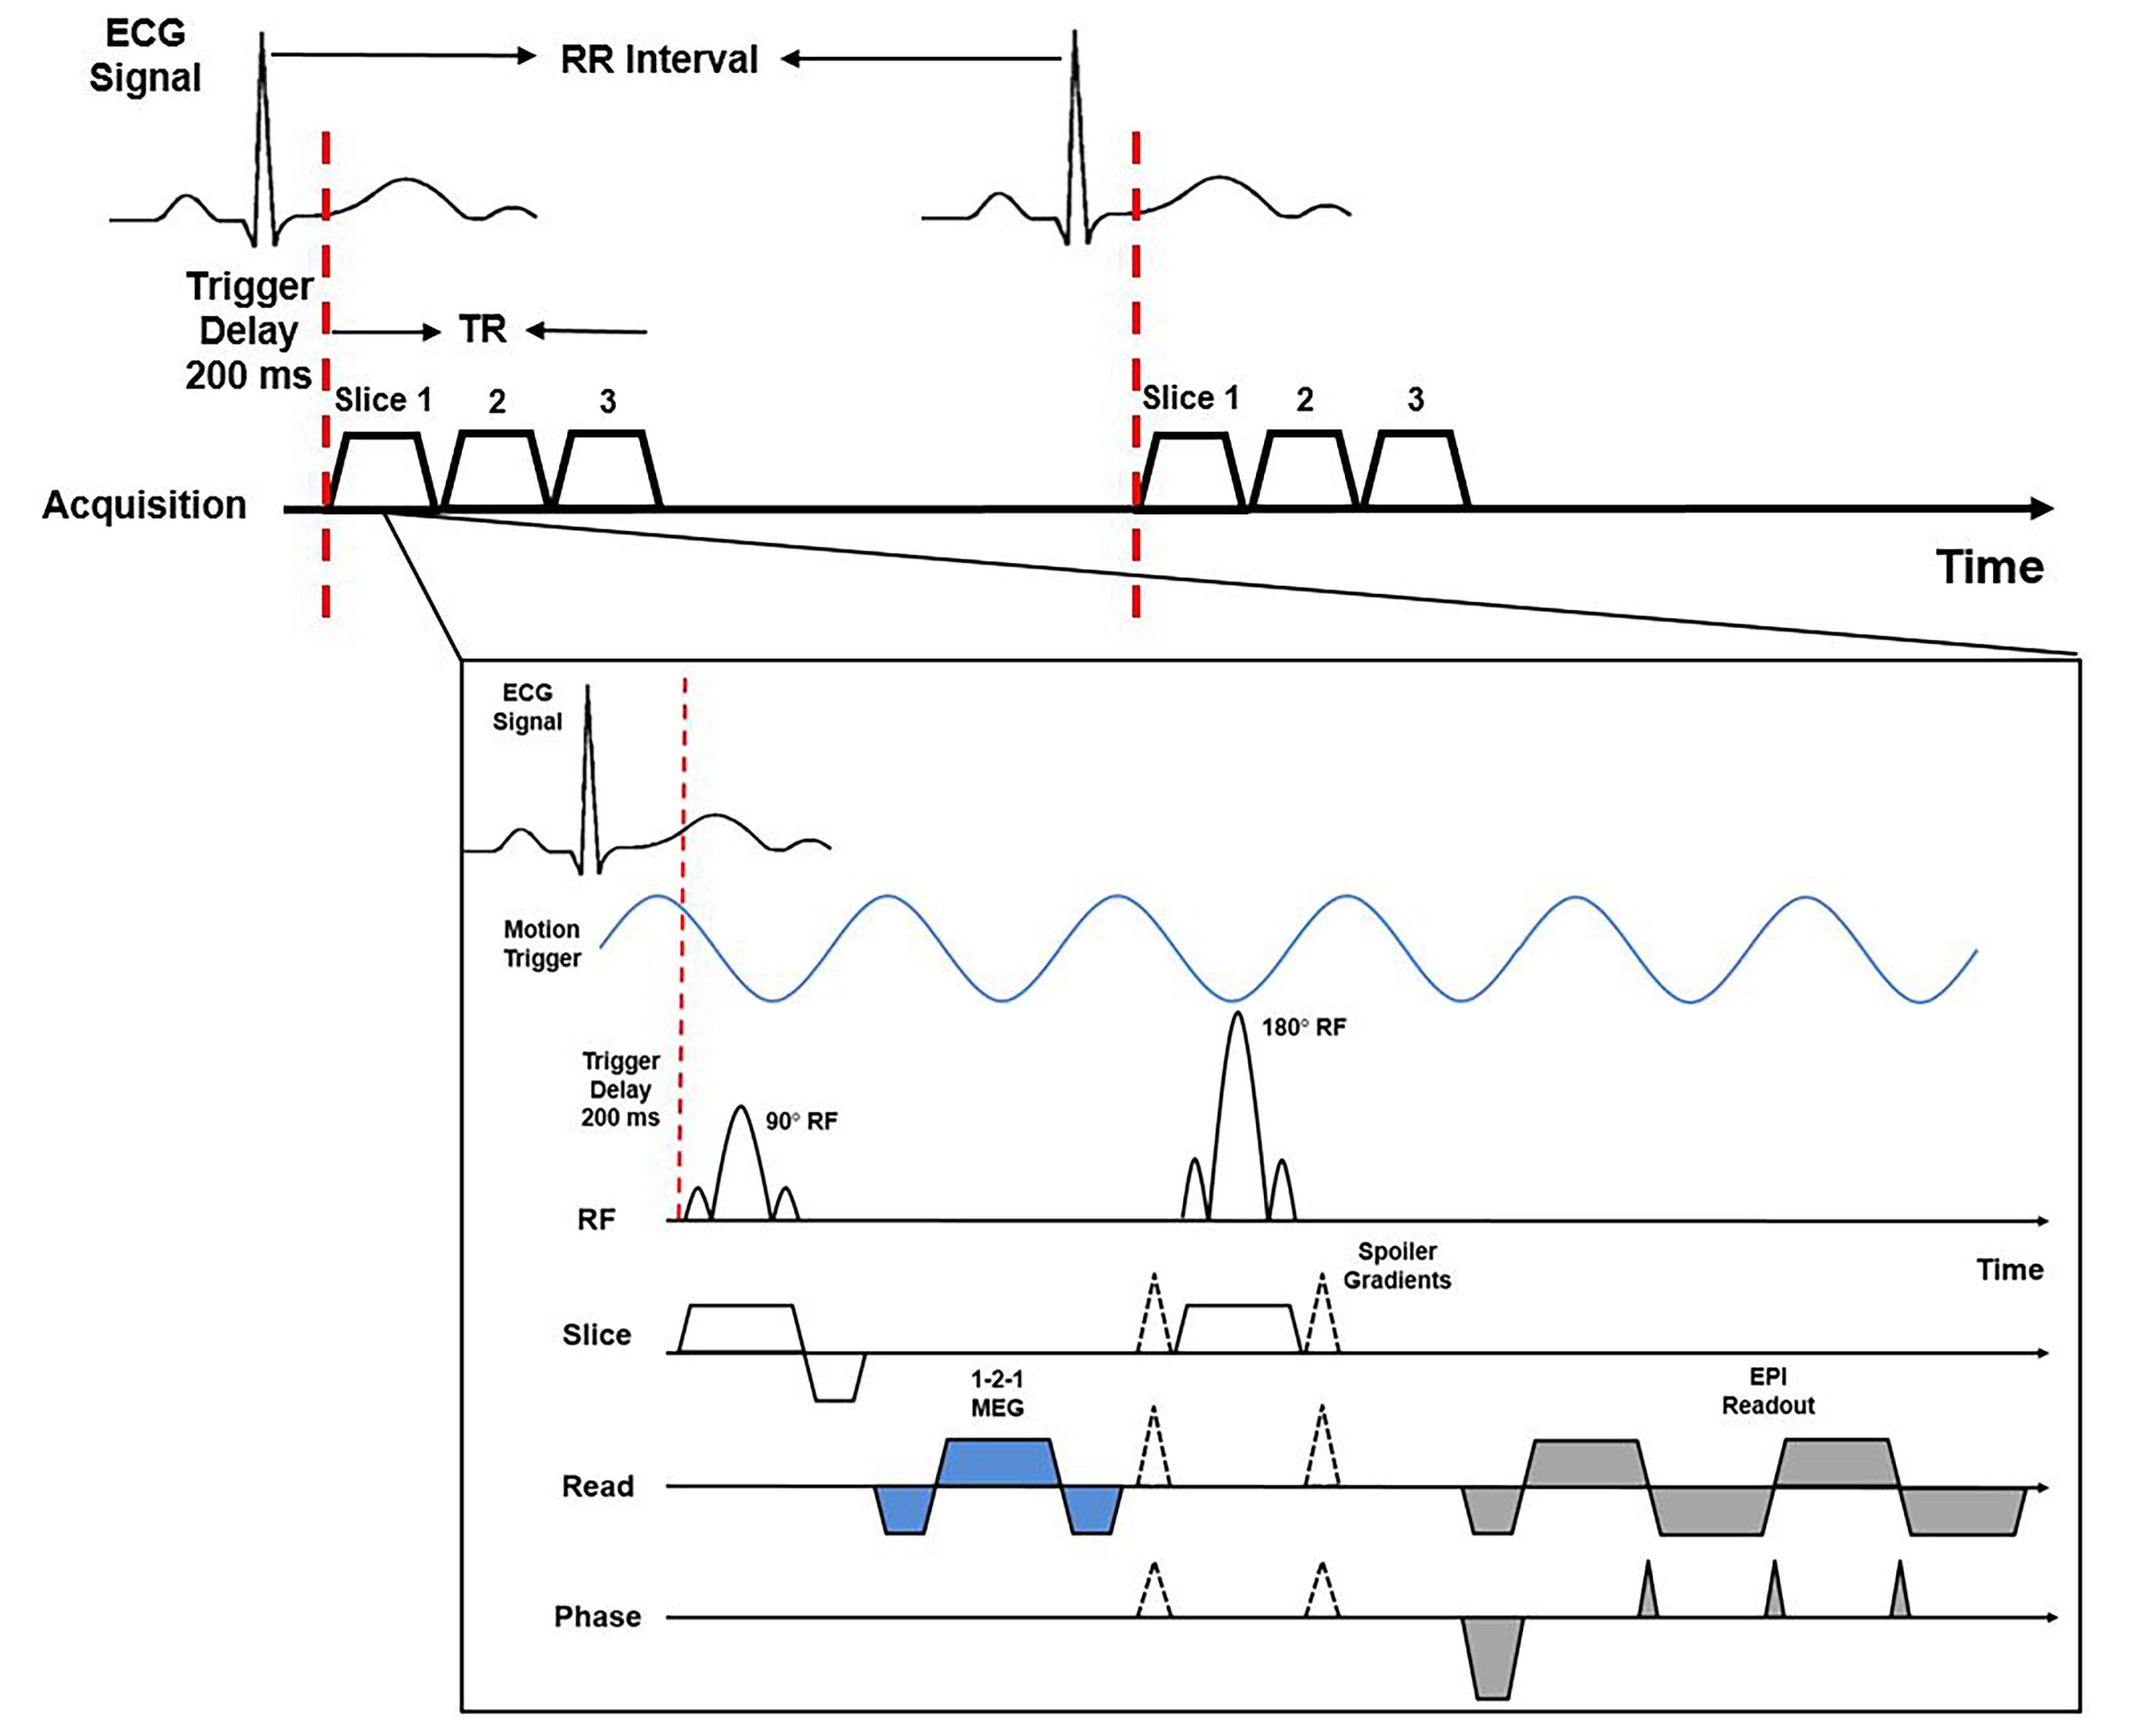
A cardiac-gated SE-EPI MRE sequence (Figure 1) was developed and initially validated using a custom-built MRE phantom. To reduce the effect of aortic flow on MRE phase images, the Motion-Encoding Gradient (MEG) was designed to be both zero- and first-moment-nulled. Unlike the conventional 1-1 bipolar MEG, which also encodes constant flow velocity (a critical concern in aortic MRE), the designed MEG (i.e., 1-2-1) is not sensitive to aortic flow (i.e., constant velocity). EPI ghosting and distortion were effectively corrected via protocol optimization and a non-phase-encoded reference scan.
All imaging was performed on a 3T MR scanner (MAGNETOM Skyra, Siemens Healthcare, Erlangen, Germany) using the developed cardiac-gated SE-EPI MRE sequence and the established GRE MRE sequence. In this study, 10 healthy volunteers (age: 26±4 years) were recruited. Imaging parameters included: mechanical/MEG frequency=70/100Hz; three-directional motion encoding; 4 phase offsets; no. of slices=3; FOV=400x400x2.5mm3; acquisition matrix=128x64 (GRE) and 128x96 (SE-EPI); TE=10.18ms (GRE) and 28.0ms (SE-EPI); TR =14.29ms (GRE) and 257.14ms (SE-EPI); EPI factor=32, trigger delay=200ms, no. of averages=2.
For SE-EPI scans, all three slices were acquired within one TR. Both SE-EPI and GRE scans were performed during free-breathing in the same sitting. To determine the reproducibility of aortic MRE using multi-slice SE-EPI, the subjects were asked to leave the scan room and repositioned for the subsequent repeat EPI scan.
Aortic MRE data were processed using MRElab (Mayo Clinic, Rochester, MN). Eight 4th-order Butterworth band-pass directional filters with cutoff of 1-40waves/FOV were used to eliminate the undesirable noise, longitudinal waves and wave reflections. Subsequently, 3D Local-Frequency Estimation (LFE) inversion was performed to obtain the weighted effective stiffness map from each motion-encoding direction12. The weighing was based on the first-harmonic amplitude from each motion-encoding direction.
Results and Discussion
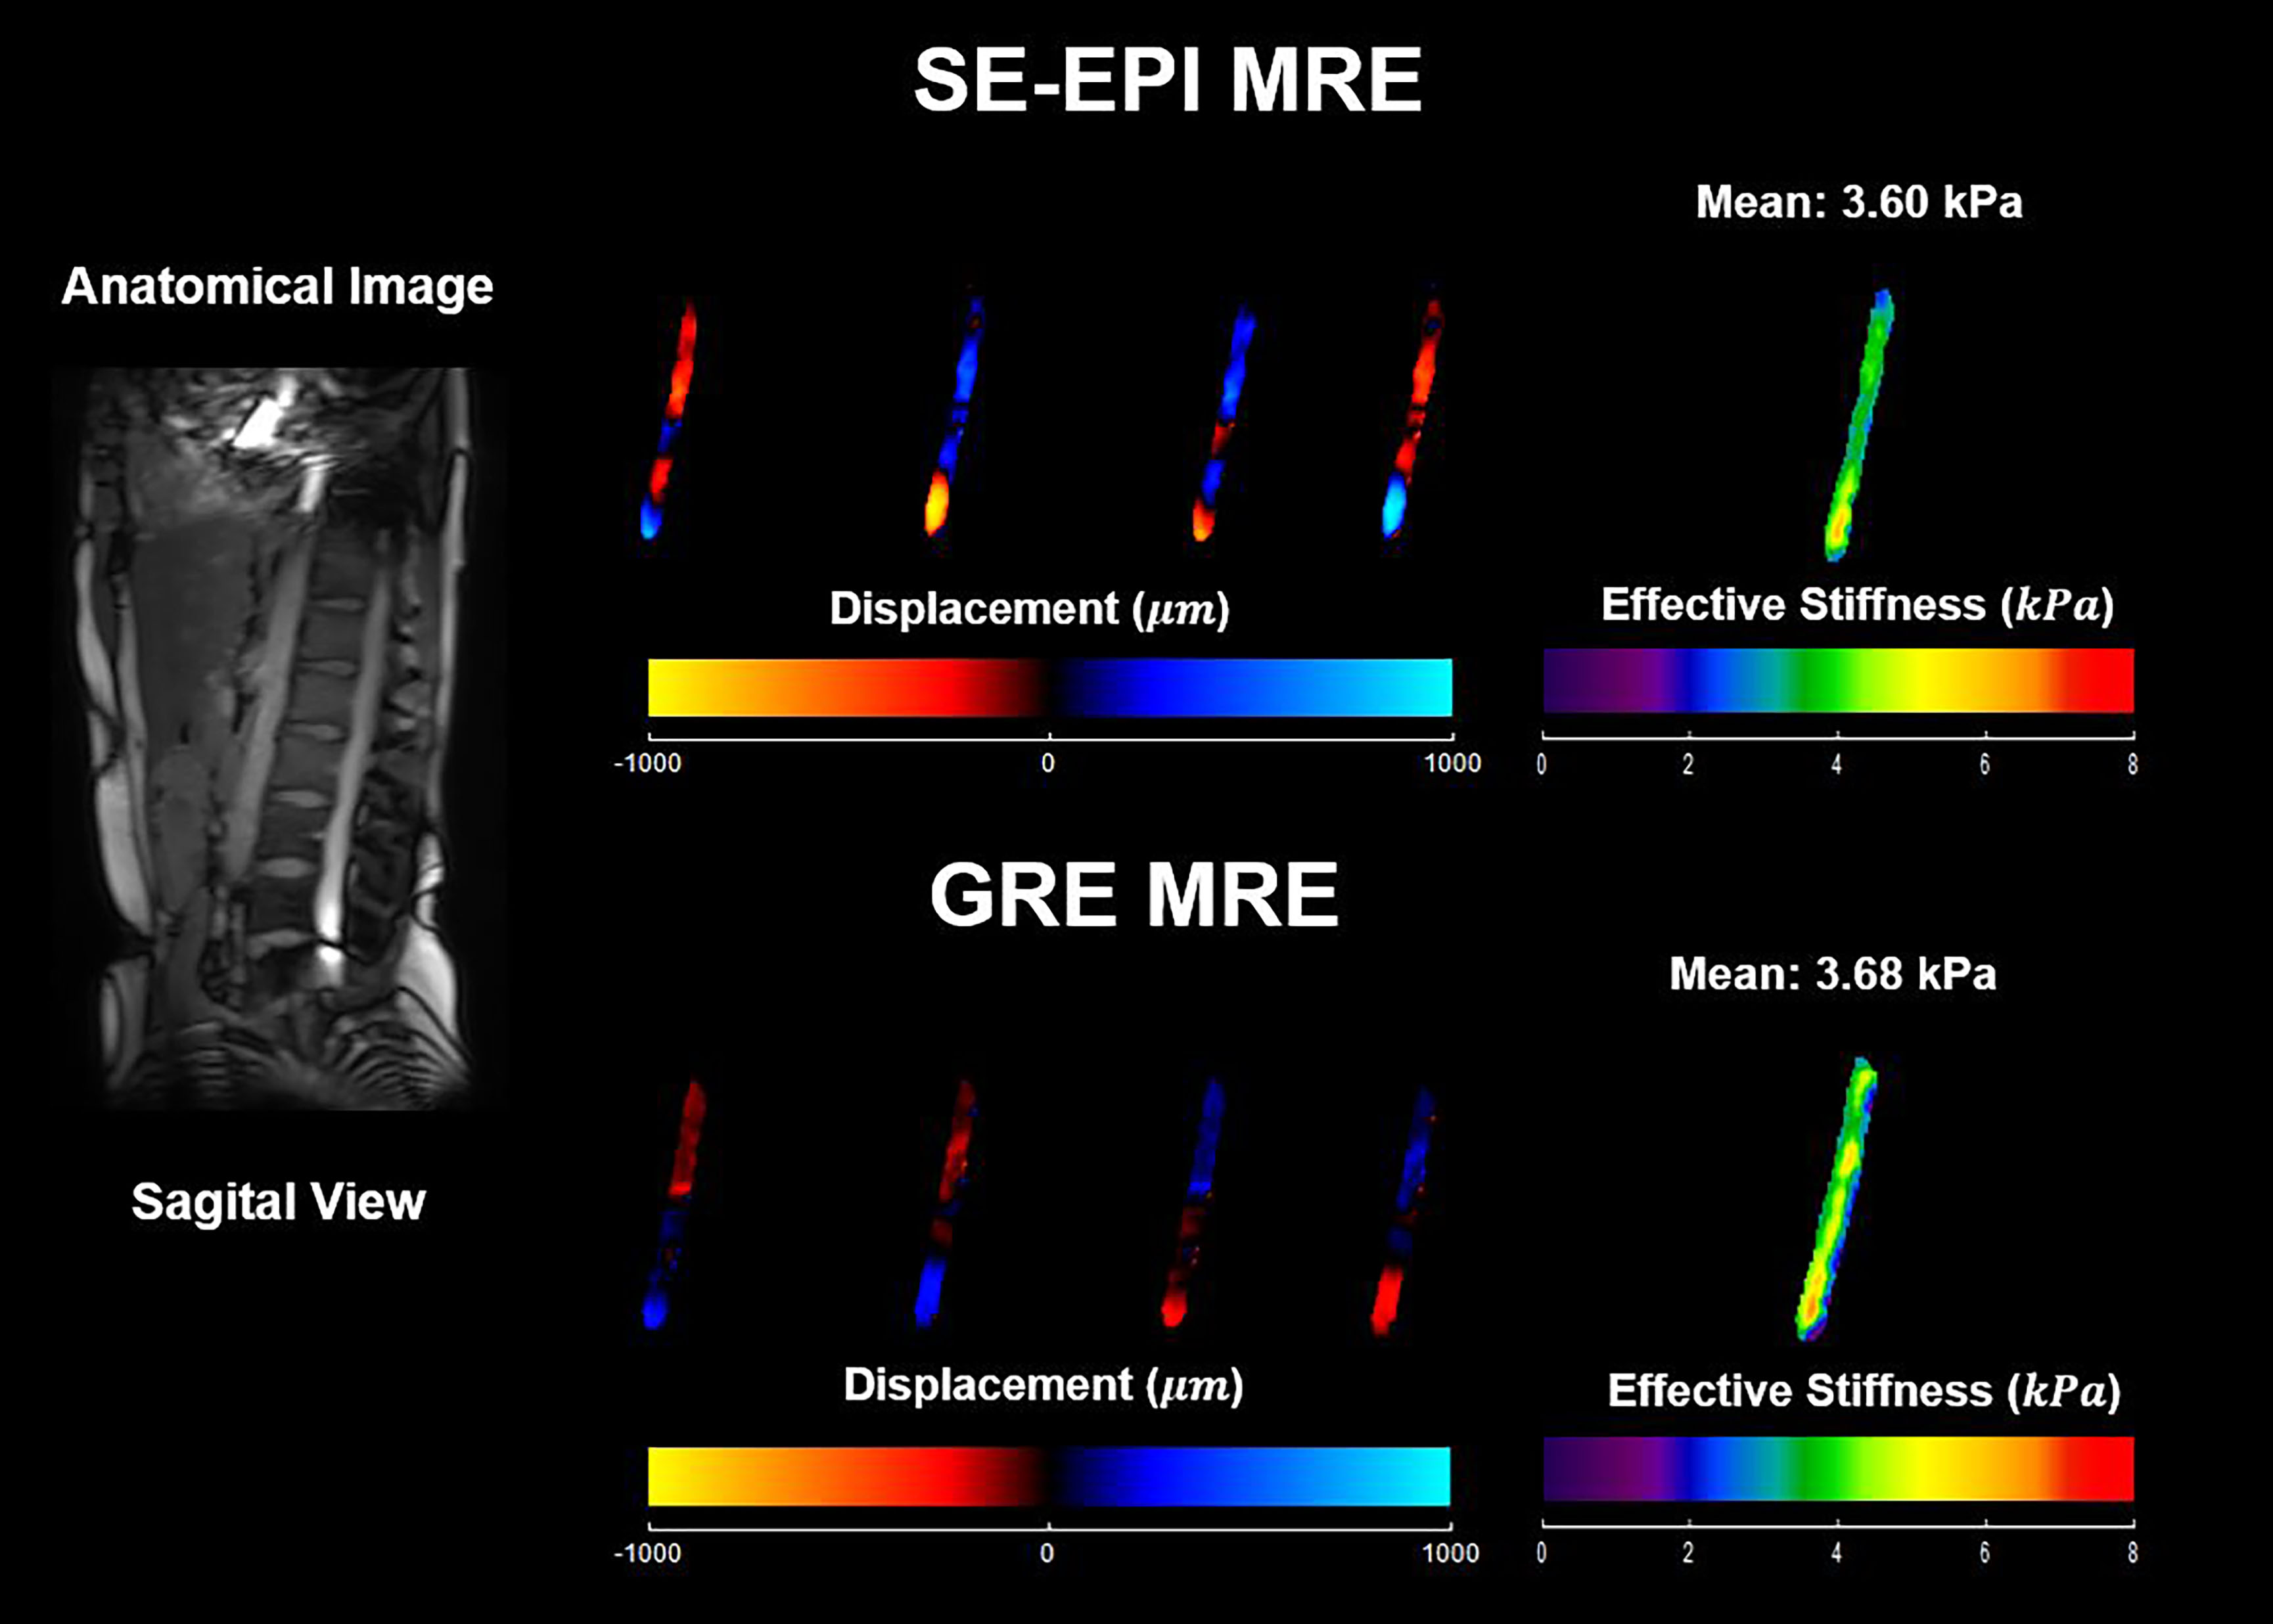
Figure 2 shows in-vivo aortic MRE measurements using SE-EPI and GRE MRE sequences in one healthy volunteer. Similar stiffness maps were observed. The mean stiffness was 3.60 and 3.68kPa for SE-EPI and GRE, respectively. The total scan time was about 50 and 150 seconds for SE-EPI and GRE to acquire 3 slices, respectively.
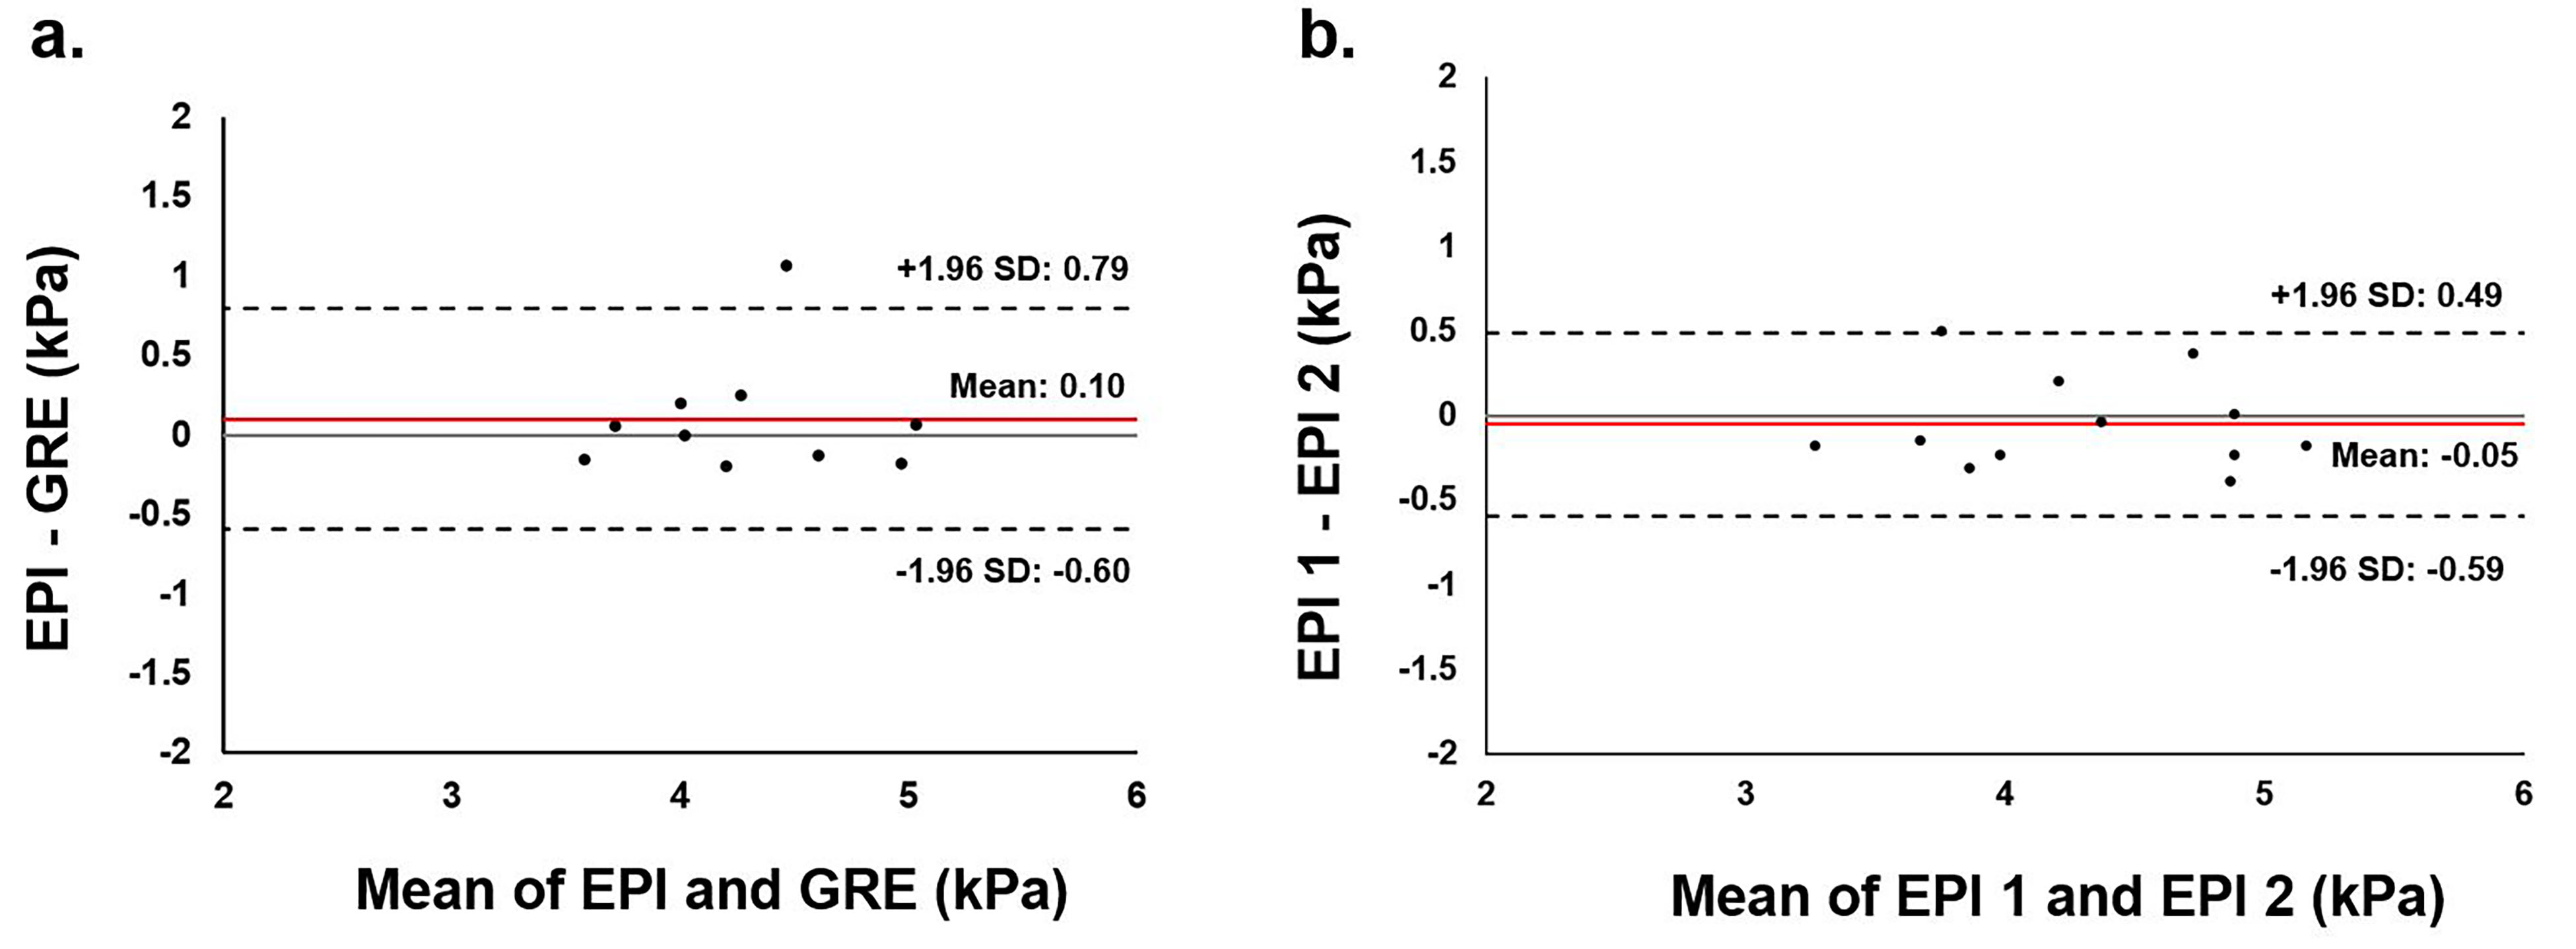
Figure 3 shows the Bland-Altman analyses of SE-EPI to GRE MRE sequence (Figure 3a), and the reproducibility of multi-slice SE-EPI aortic MRE (Figure 3b). Narrow confidence interval and low mean bias were observed in both cases, suggesting the feasibility and excellent reproducibility of multi-slice SE-EPI aortic MRE.
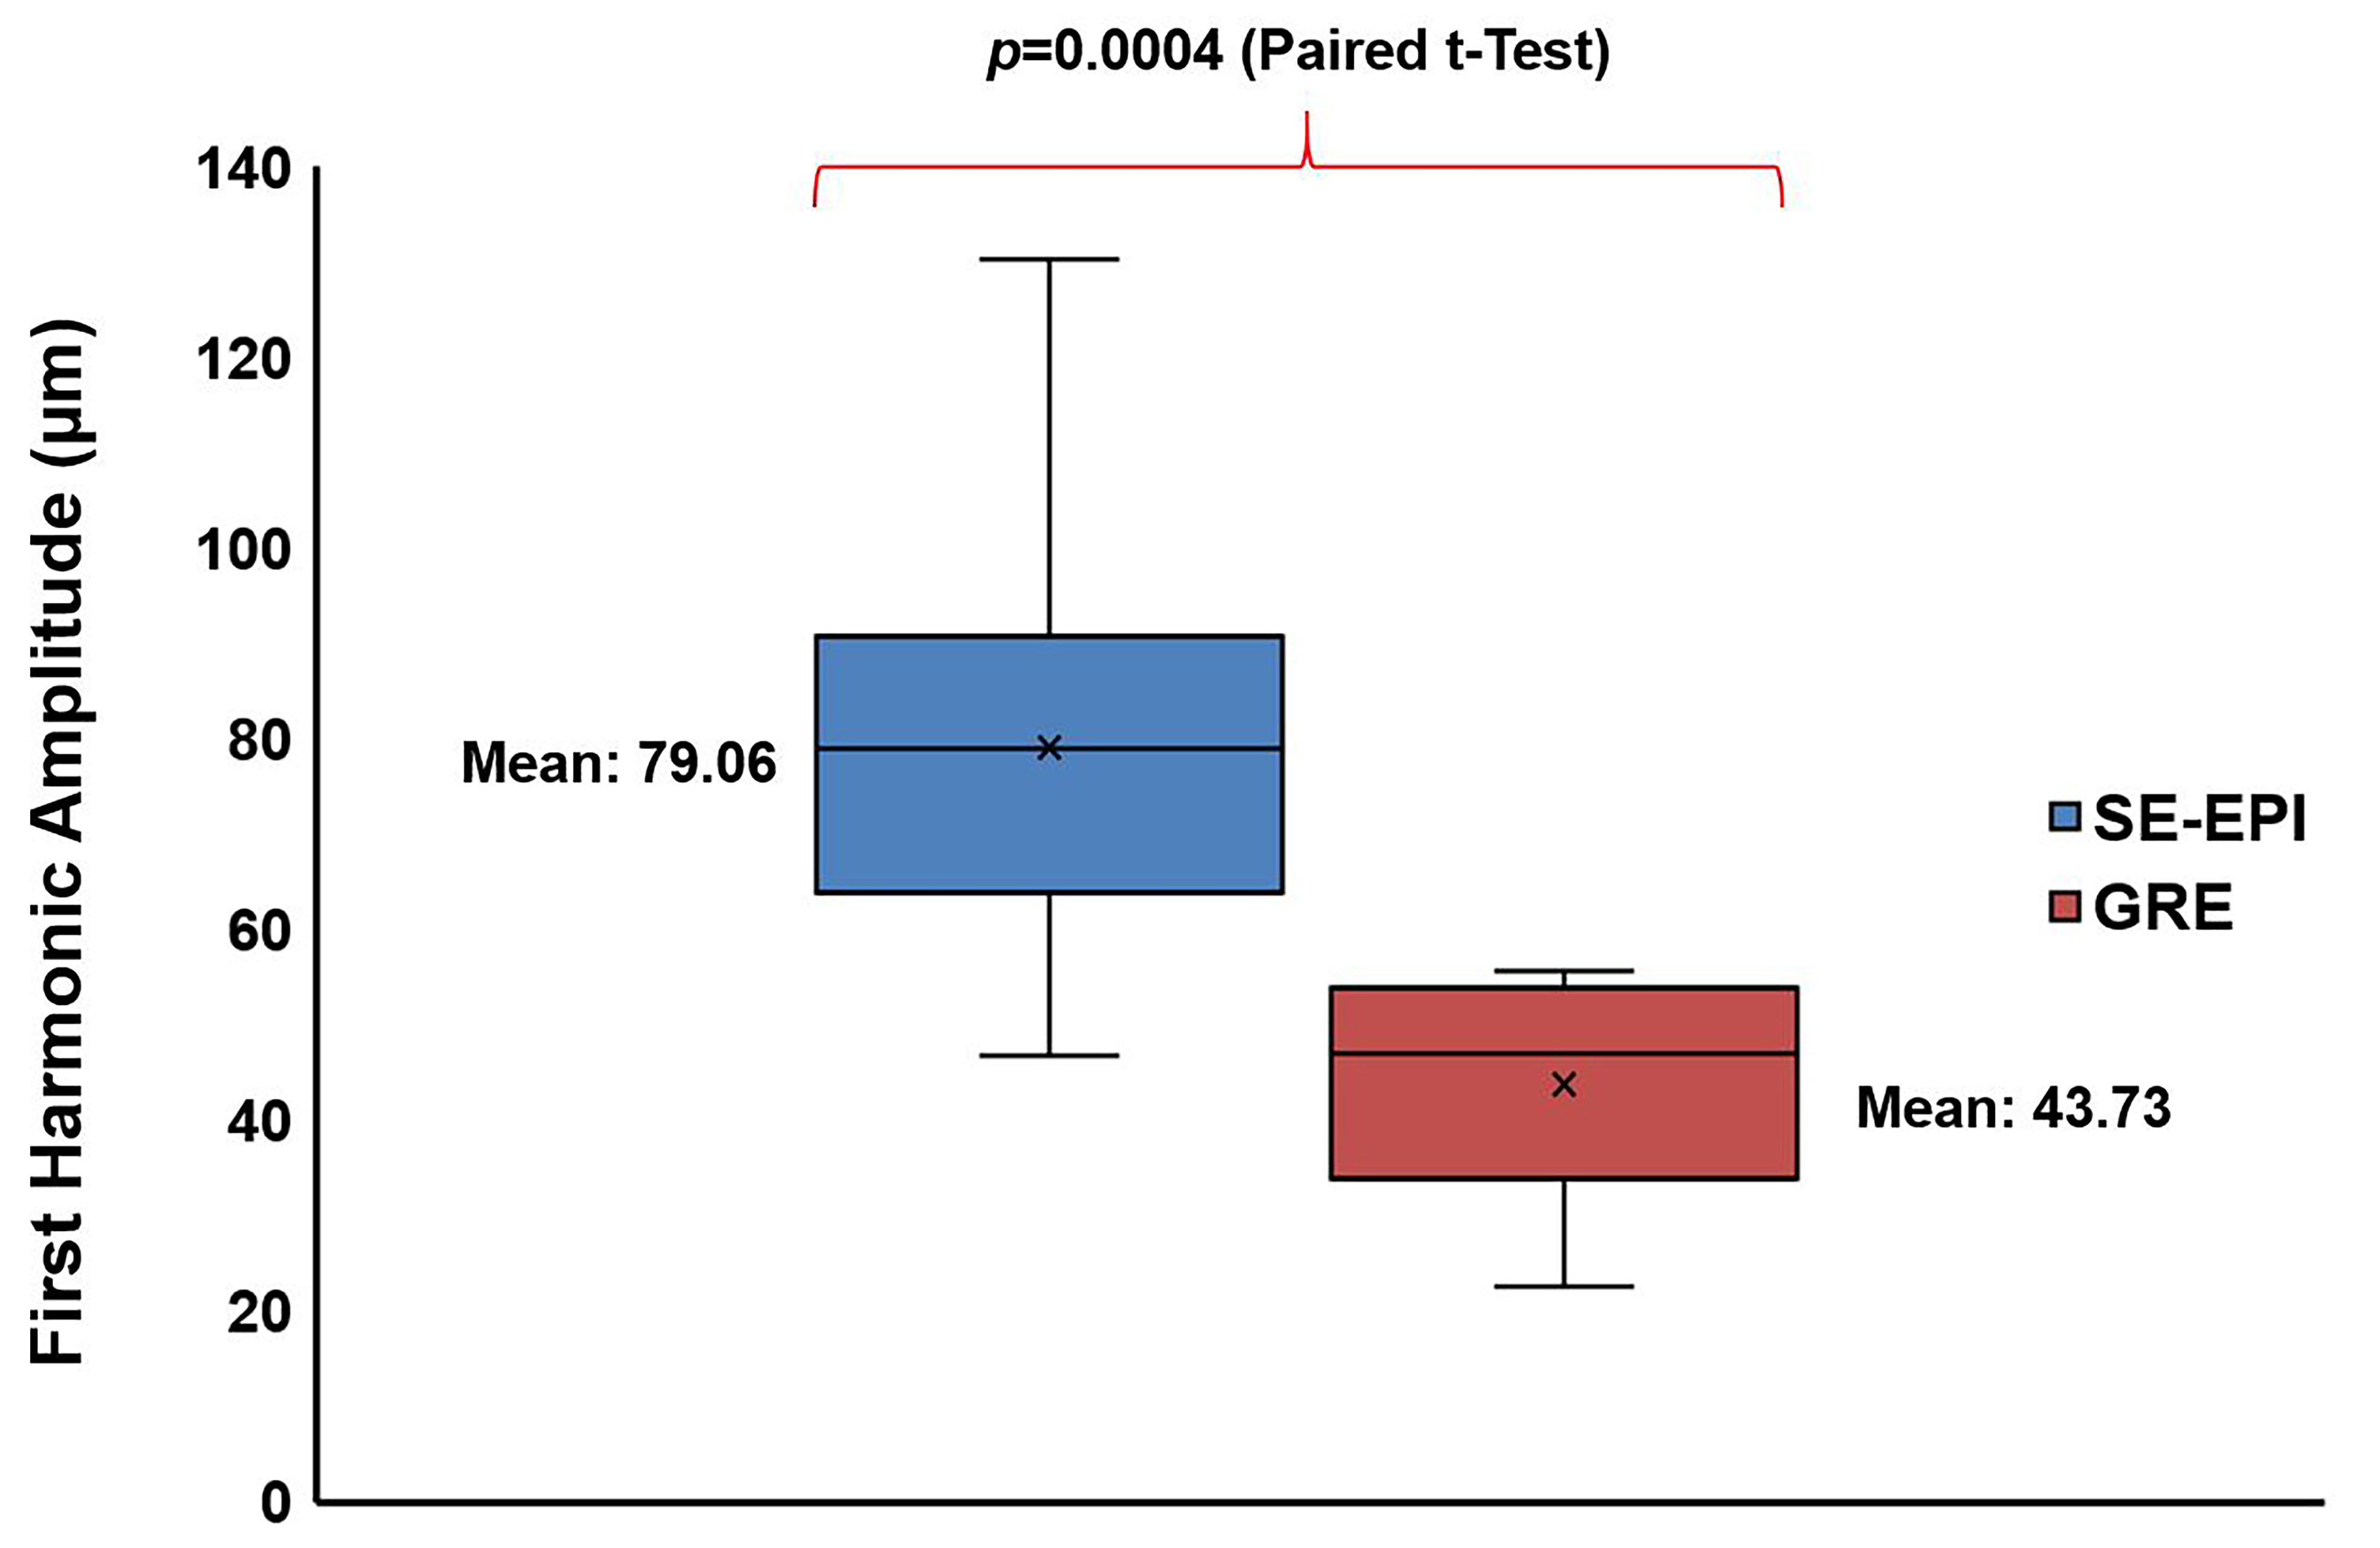
Figure 4 shows the box plot of the first-harmonic amplitude. SE-EPI MRE yielded significantly higher amplitude than GRE MRE (p=0.0004), demonstrating potential advantage in imaging patients with high body mass index using SE-EPI with higher spatial resolution than GRE. The mean first-harmonic amplitude was 79.06 and 43.73μm for SE-EPI and GRE MRE, respectively.
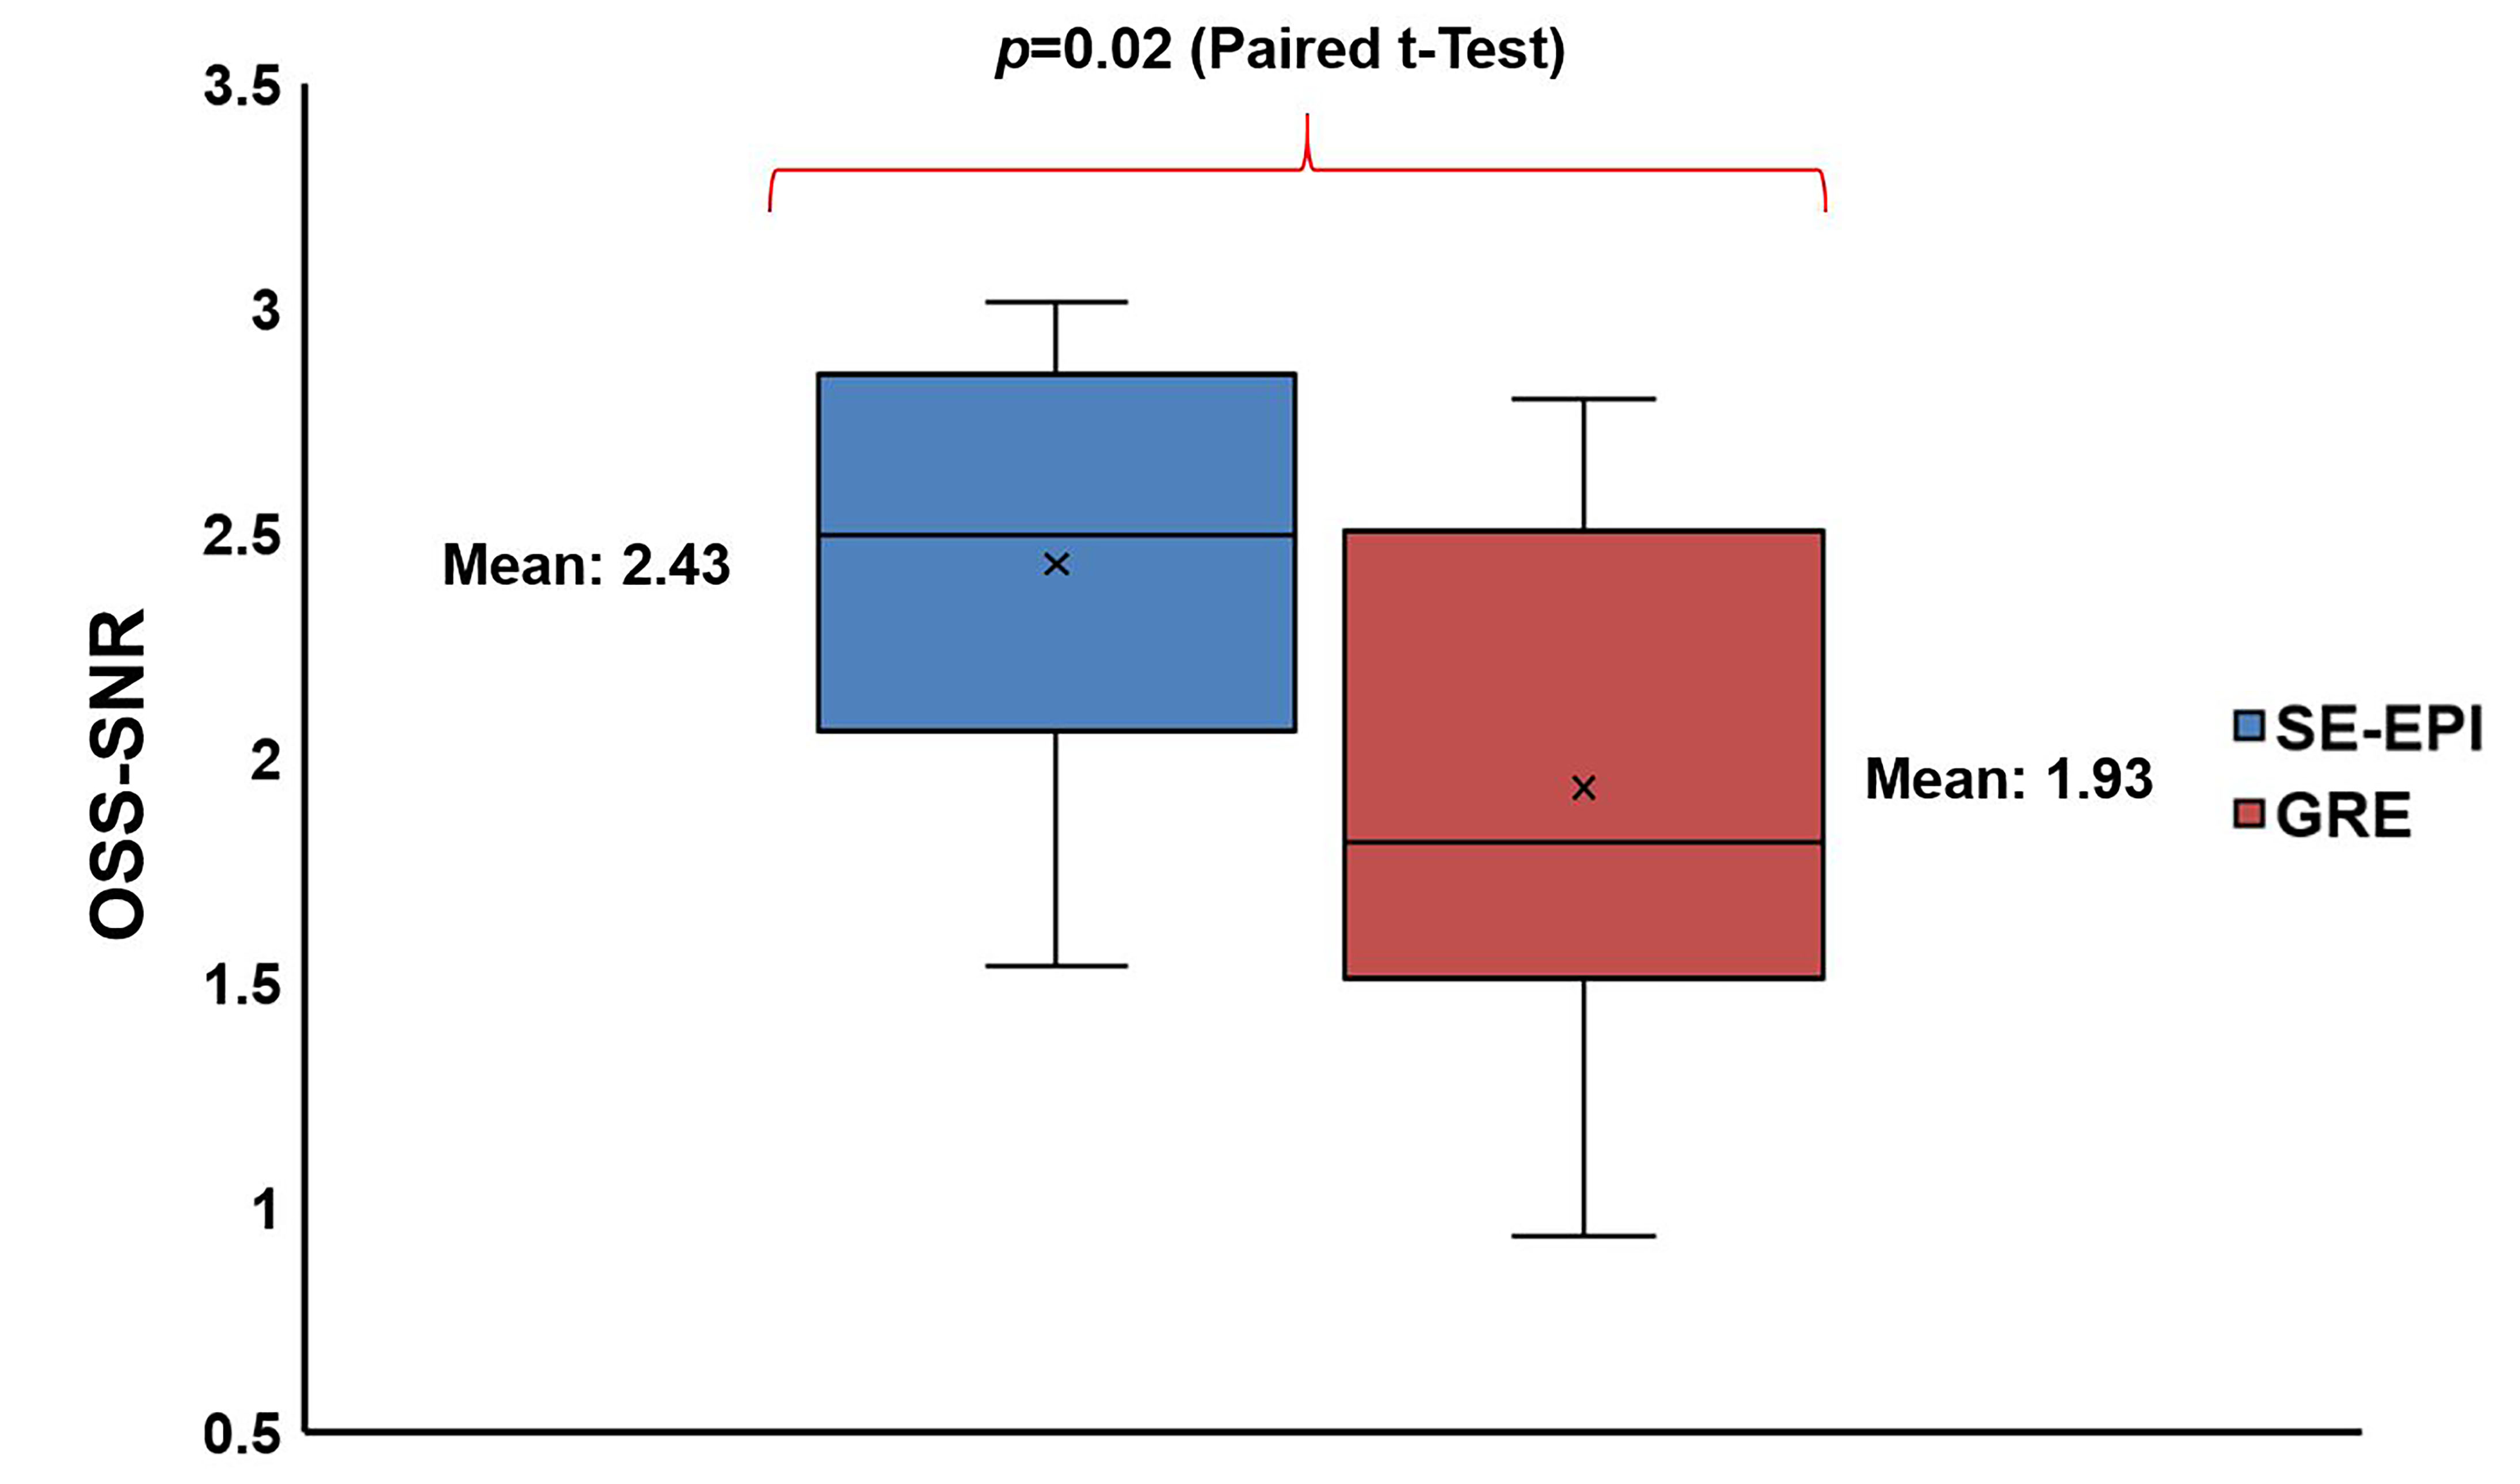
Figure 5 shows the OSS-SNR comparison between SE-EPI and GRE MRE sequences. SE-EPI yielded significantly higher OSS-SNR than GRE (p=0.02). The mean OSS-SNR was 2.43 and 1.93 for SE-EPI and GRE MRE sequence, respectively.
Conclusion
Multi-slice SE-EPI MRE to estimate aortic stiffness was determined to be feasible and reproducible. Moreover, SE-EPI demonstrated advantages over GRE in producing a higher first-harmonic amplitude and OSS-SNR which is critical in imaging patients with high body mass index. Finally, multi-slice SE-EPI acquisition considerably shortened acquisition time when compared to the conventional GRE MRE. Future work will develop a fast imaging technique to further accelerate SE-EPI aortic MRE to acquire all directions and slices within one breath-hold.Acknowledgements
The authors particularly acknowledge Brian Raterman, BSRT (MR), Department of Radiology, The Ohio State University Wexner Medical Center and funding support NIH-R01HL124096.References
[1] Kadoglou NP, Papadakis I, Moulakakis KG, Ikonomidis I, Alepaki M, Moustardas P, Lampropoulos S, Karakitsos P, Lekakis J, Liapis CD. Arterial stiffness and novel biomarkers in patients with abdominal aortic aneurysms. Regul Pept 2012;179(1-3):50-54.
[2] Payne RA, Wilkinson IB, Webb DJ. Arterial stiffness and hypertension: emerging concepts. Hypertension 2010;55(1):9-14.
[3] Lee HY, Oh BH. Aging and arterial stiffness. Circ J 2010;74(11):2257-2262.
[4] Shirwany NA, Zou MH. Arterial stiffness: a brief review. Acta Pharmacol Sin 2010;31(10):1267-1276.
[5] Laurent S, Boutouyrie P, Asmar R, Gautier I, Laloux B, Guize L, Ducimetiere P, Benetos A. Aortic stiffness is an independent predictor of all-cause and cardiovascular mortality in hypertensive patients. Hypertension 2001;37(5):1236-1241.
[6] Laurent S, Cockcroft J, Van Bortel L, Boutouyrie P, Giannattasio C, Hayoz D, Pannier B, Vlachopoulos C, Wilkinson I, Struijker-Boudier H. Expert consensus document on arterial stiffness: methodological issues and clinical applications. Eur Heart J 2006;27(21):2588-2605.
[7] Kenyhercz WE, Raterman B, Illapani VS, Dowell J, Mo X, White RD, Kolipaka A. Quantification of aortic stiffness using magnetic resonance elastography: Measurement reproducibility, pulse wave velocity comparison, changes over cardiac cycle, and relationship with age. Magn Reson Med 2016;75(5):1920-1926.
[8] Damughatla AR, Raterman B, Sharkey-Toppen T, Jin N, Simonetti OP, White RD, Kolipaka A. Quantification of Aortic Stiffness Using MR Elastography and Its Comparison to MRI-Based Pulse Wave Velocity. J Magn Reson Imag 2015;41(1):44-51.
[9] Kolipaka A, Illapani VS, Kenyhercz W, Dowell JD, Go MR, Starr JE, Vaccaro PS, White RD. Quantification of abdominal aortic aneurysm stiffness using magnetic resonance elastography and its comparison to aneurysm diameter. J Vasc Surg 2016.
[10] Dong H, Mazumder R, Illapani VSP, Mo X, White RD, Kolipaka A. In vivo quantification of aortic stiffness using MR elastography in hypertensive porcine model. Magn Reson Med 2017;78(6):2315-2321.
[11] Wagner M, Besa C, Bou Ayache J, Yasar TK, Bane O, Fung M. Ehman RL, Taouli B. Magnetic Resonance Elastography of the Liver: Qualitative and Quantitative Comparison of Gradient Echo and Spin Echo Echoplanar Imaging Sequences. Invest Radiol. 2016;51(9):575-81.
[12] Knutsson H, Westin CF, Granlund G. Local multiscale frequency and bandwidth estimation. Image Processing, 1994, IEEE International Conference 1994; Vol. 1:36-40.
Figures