3956
High-resolution one-dimensional shear wave MR elastography at 78 microns: initial results in skin imaging in vivo.1Department of Biomedical Engineering and Imaging Sciences, King's College London, London, United Kingdom, 2Department of Radiology and Nuclear Medicine, Amsterdam UMC, Amsterdam, Netherlands, 3Department of Chemical Engineering, IQS School of Engineering, Universitat Ramon Llull, Barcelona, Spain, 4Faculty of Health Sciences, University of Southampton, Southampton, United Kingdom, 5Philips Healthcare, Guildford, United Kingdom, 6King's College London, London, United Kingdom, 7Laboratory for Vascular Translational Science, INSERM, Paris, France
Synopsis
Imaging the biomechanical properties of thin structures with MR is challenging due to the generally low spatial resolution of MR elastography. In this study, we discuss a novel approach for imaging these structures using high-resolution motion sensitised pencil beam MRE at 78 microns to determine transient shear wave propagation. Initial results describe the application of this approach in phantom and skin imaging.
Introduction
Biomechanical properties of soft tissues vary immensely between different types, function and composition of tissue, as well as physiological and pathological conditions1,2. For imaging properties of thin structures such as skin, the largest groups of techniques consist of ultrasound elastography (UE) and optical coherence tomography/elastography (OCT/OCE)3. UE often is predominantly limited to a special resolution of hundreds of micrometers4–6 or limited to a small depth penetration when increasing resolution7 and therefore will have difficulties imaging individual layers in depth, as thinnest skin structures are under 100μm8. OCE provides very high spatial resolution, however struggles to achieve desirable tissue depths and development of quantitative images is still underway5. Magnetic resonance elastography (MRE) has been extensively researched for determining biomechanical properties of larger organs, however, current applications typically obtain spatial resolutions in ranges of 1–10mm, though microscopic MRE has been described9. In this study we discuss initial results of high resolution one-dimensional transient shear wave MRE for imaging tissue properties using a motion sensitised pencil beam to evaluate shear wave speed (SWS) propagation at 78 microns, with initial findings in phantoms and skin.Methods
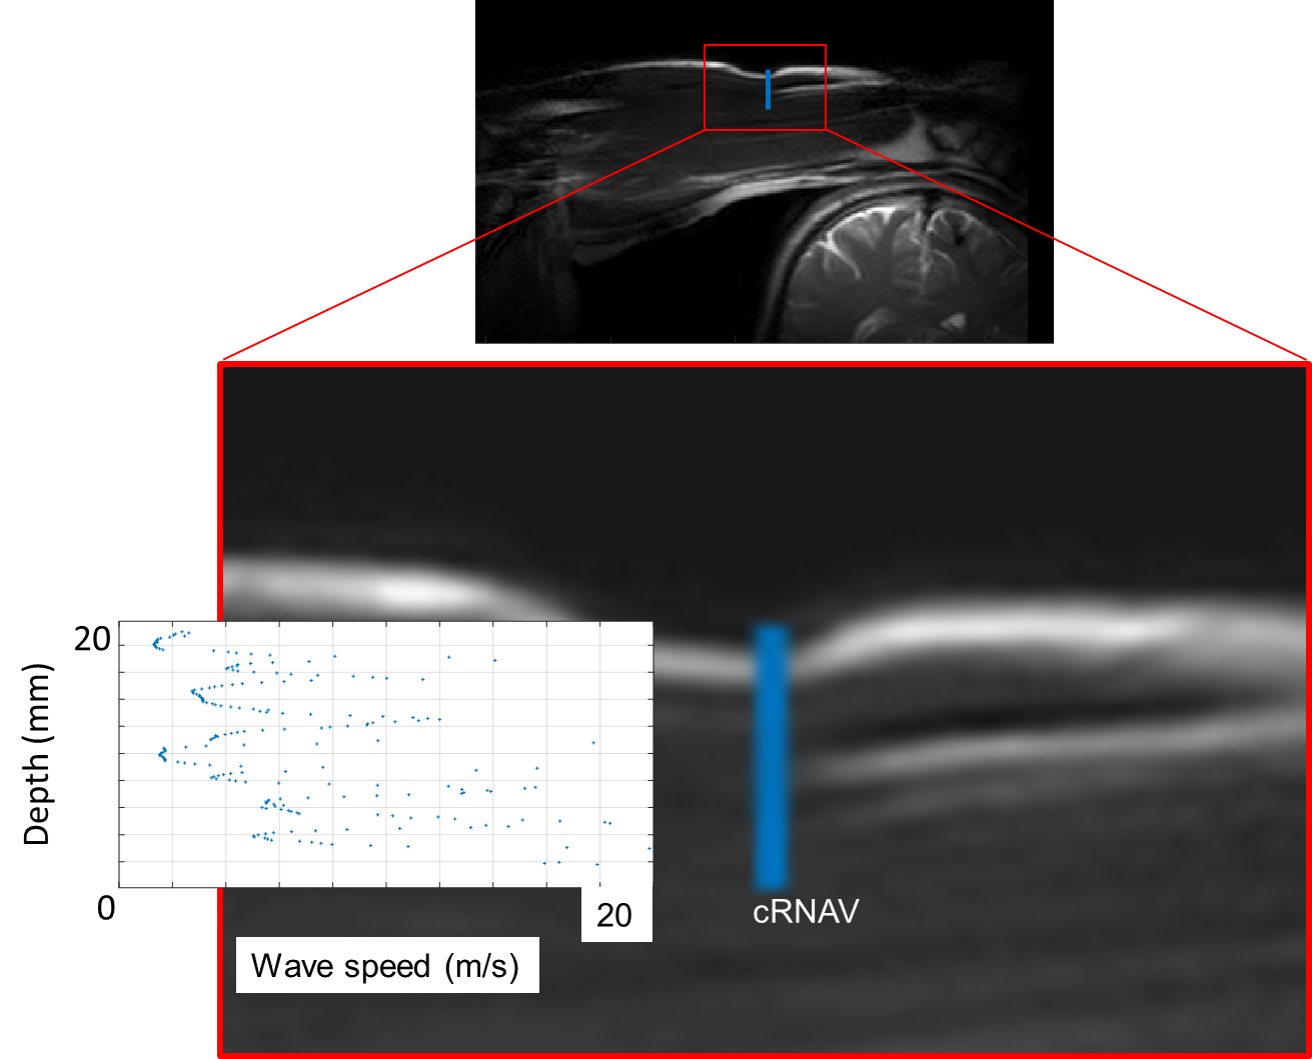
Scanning was performed on a Philips 3T MRI scanner. An adapted cardiac respiratory navigator (cRNAV) sequence was used to scan a 60kPa and 90kPa homogenous silicone phantom, a layered phantom with varying stiffnesses and an in vivo feasibility scan of the forearm. The cRNAV sequence consisted of repetitive ECG-gated FLASH sequences, modified to produce a motion-sensitised pencil beam by replacing the excitation pulse with a two-dimensional RF-pulse and adding motion encoding gradients before readout. Pencil beam dimensions were 30mm diameter, 20mm length and 23ms duration, resulting in a spatial resolution of 78μm along the pencil beam. Physiology simulation was used to simulate the ECG signal. 200 simulated R-R intervals were imaged, with 16 lines of images acquired per R-R interval, time-shifted relative to simulated QRS-complexes in consecutive R-R intervals to acquire the entire interval between R-waves. A TR of 23ms resulted in a temporal resolution of 0.12ms. Shear waves were generated at 200Hz using a custom electromagnetic transducer with a simple push rod system synchronised to the MRI scanner. The cRNAV was positioned parallel to wave propagation with orthogonal motion- sensitization direction (Fig.1). Total scan time was 6.5min. Reordering of all images in order of time in simulated cardiac cycle resulted in a single magnitude and phase image. Shear waves were visualised as a propagating perturbation in space and time within phase images. The trajectory of the shear wave in space over time was found by generating phase profiles looking at each point in space for a given time and determining the maximum derivative of the moving polynomial fit for 10 profiles. SWS was determined by calculating distance travelled by the shear wave divided by time (m/s), either by fitting a straight line to the data points or using a moving fit for layered data.Results
SWS for two homogenous silicone phantoms showed an increase in SWS with an increase in stiffness from 10.2m/s in the 60kPa phantom (Fig.Xa) to 29.1.6m/s in the 90kPa phantom (Fig.Xb). Both the layered phantom (Fig.X) and in vivo skin data (Fig.X) analysis shows clear variance in shear wave speed between layers that correlated well to anatomy.Discussion
This study shows that the proposed approach can be used to image shear wave propagation in vivo at 78 microns, providing a novel approach for imaging thin structures with MRE. Distinct variance in SWS in both the phantom and in vivo skin data shows that the different layers of the skin can be imaged at high-resolution and SWS determined for visible layers. Results in phantoms show a higher SWS than expected, potentially due to a combination of material properties and confounding compressional wave effects. Further evaluation of is required to establish causes of this effect. Further sequence development will attempt to increase the spatial resolution to 50 microns and improve scan time, currently restricted by SAR-limitations. More in vivo data is required to establish stability and reproducibility across various regions of interest and for determining further applications. Other applications for high resolution MRE may be in other tissues with thin walls or layers, such as vessel walls, where pulse effects may be used to image intrinsic shear wave propagation.Conclusion
High-resolution cRNAV pencil beam MRE provides a novel approach for imaging the biomechanical properties of thin structures in vivo. Initial results in skin data show promising results for determining SWS in various layers of the skin and further development will aim to examine broader clinical applications.Acknowledgements
No acknowledgement found.References
1. Meyers MA, Chen P-Y, Lin AY-M, Seki Y. Biological materials: Structure and mechanical properties. Prog Mater Sci. 2008;53(1):1-206. doi:10.1016/j.pmatsci.2007.05.002
2. Smalls LK, Randall Wickett R, Visscher MO. Effect of dermal thickness, tissue composition, and body site on skin biomechanical properties. Ski Res Technol. 2006;12(1):43-49. doi:10.1111/j.0909-725X.2006.00135.x
3. Saavedra AC, Arroyo J, Zvietcovich F, Lavarello RJ, Castaneda B. In vivo estimation of the Young ’ s modulus in normal human dermis. 2018 40th Annu Int Conf IEEE Eng Med Biol Soc. 2018:3456-3459.
4. Righetti R, Ophir J, Ktonas P. Axial resolution in elastography. Ultrasound Med Biol. 2002;28(1):101-113. doi:10.1016/S0301-5629(01)00495-1
5. Wang S, Larin K V. Optical coherence elastography for tissue characterization: A review. J Biophotonics. 2015;8(4):279-302. doi:10.1002/jbio.201400108
6. Gennisson J-L, Baldeweck T, Tanter M, et al. Assessment of elastic parameters of human skin using dynamic elastography. IEEE Trans Ultrason Ferroelectr Freq Control. 2004;51(8):980-989. doi:10.1109/TUFFC.2004.1324402
7. Zheng YP, Bridal SL, Shi J, et al. High resolution ultrasound elastomicroscopy imaging of soft tissues: System development and feasibility. Phys Med Biol. 2004;49(17):3925-3938. doi:10.1088/0031-9155/49/17/007
8. Wei JCJ, Edwards GA, Martin DJ, Huang H, Crichton ML, Kendall MAF. Allometric scaling of skin thickness, elasticity, viscoelasticity to mass for micro-medical device translation: From mice, rats, rabbits, pigs to humans. Sci Rep. 2017;7(1):1-17. doi:10.1038/s41598-017-15830-7
9. Othman SF, Xu H, Royston TJ, Magin RL. Microscopic magnetic resonance elastography (μMRE). Magn Reson Med. 2005;54(3):605-615. doi:10.1002/mrm.20584
Figures
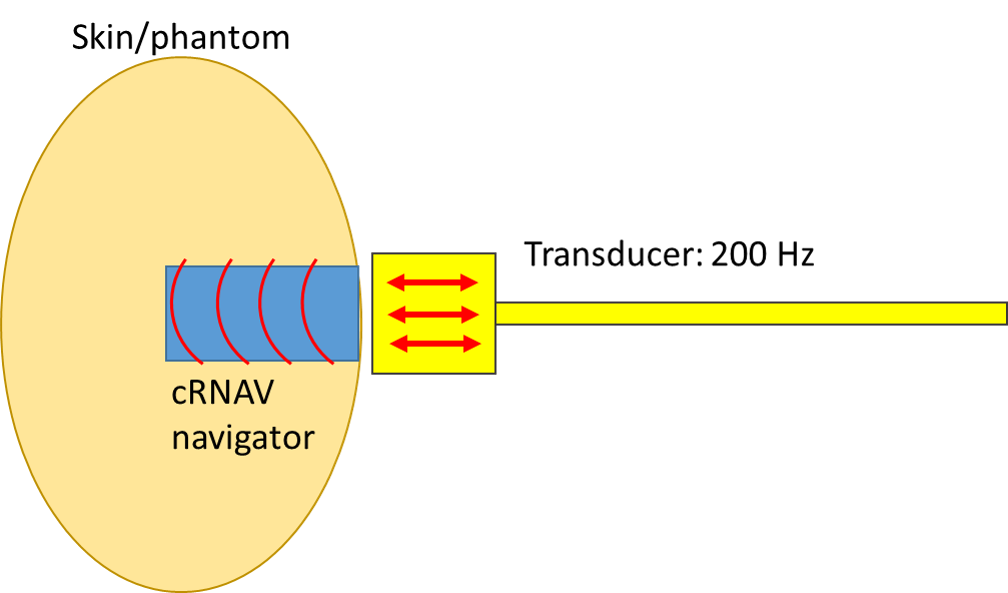
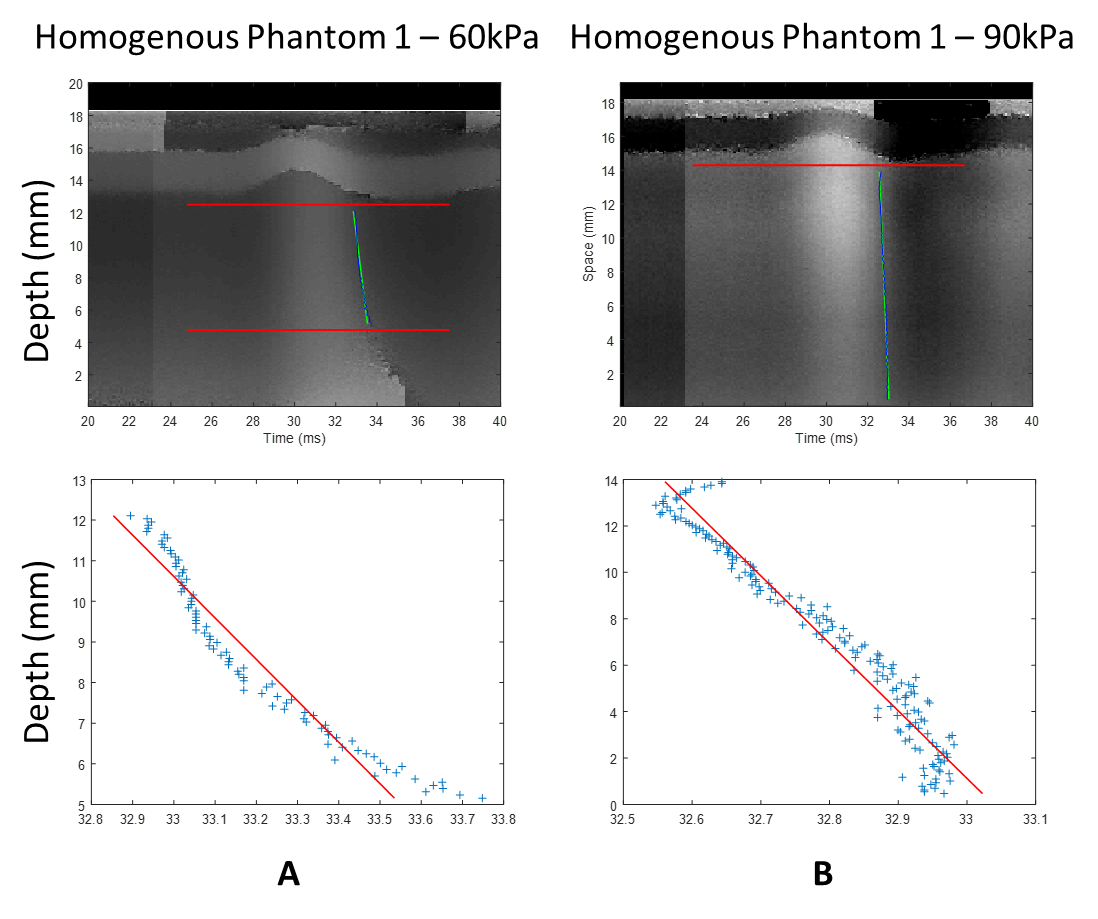
Figure 2. Homogenous silicone phantom number 1 (A) with a stiffness of 60 kPa and 2 (B) with a stiffness of 90 kPa. Top images show phase image of each phantom, fit with a straight line along edge of shear wave. Bottom images show plotted data points of time travelled over distance with straight line fit.
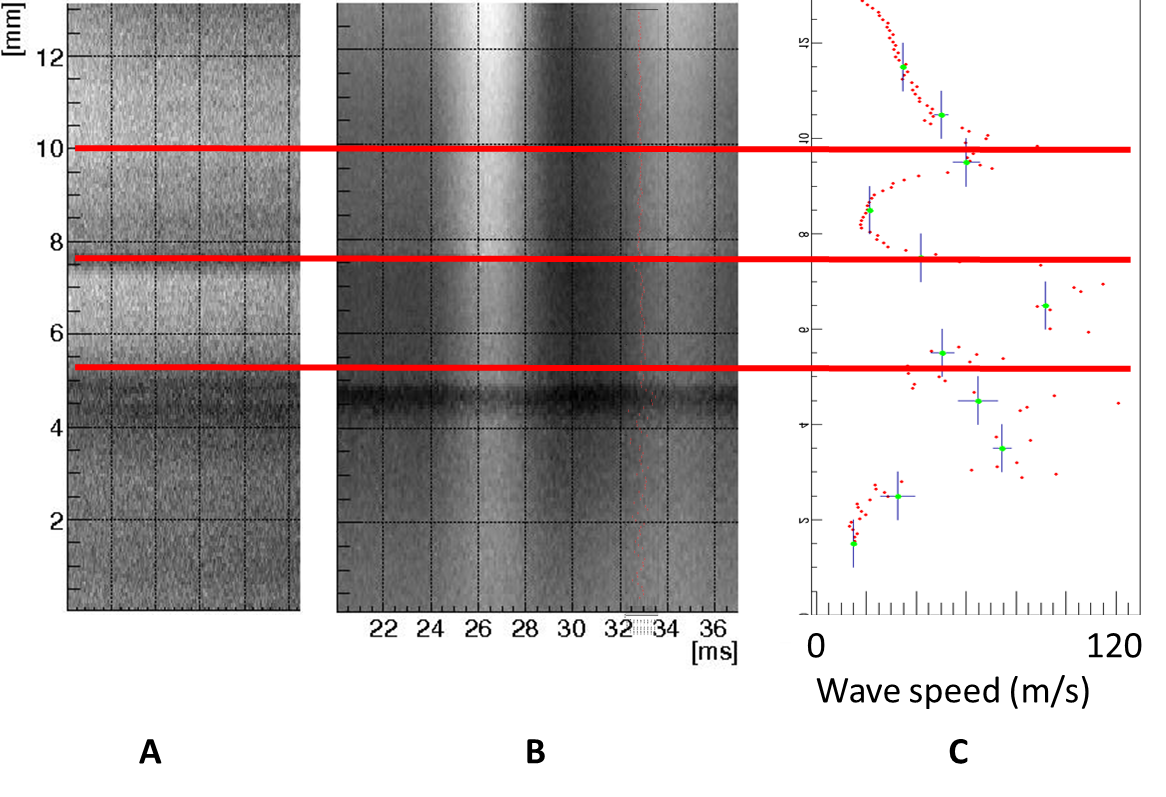
Figure 3. Layed phantom
A. Magnitude image of layered phantom, with red lines depicting layers.
B. Phase image with shear wave clearly shown by change in contrast.
C. Shear wave speeds of different layers within the phantom. Transition to different layer produces an altered wave speed.