3954
Denoising in task fMRI1Radiology, UZ Brussel, Brussels, Belgium
Synopsis
To improve the outcome of task fMRI analyses, we compared the result maps obtained following a modulated analysis pipeline with despiking and CompCor added as denoising steps, with those obtained following the standard analysis pipeline. The data was taken from 5 studies. We focused on the overlap between the obtained individual findings, between the individual and group results and between the findings of 2 fMRI sessions. Our results revealed a reduction in false results in the ventricles, but failed to show an increased repeatability of fMRI results after the denoising. In conclusion, denoising prior to the statistical analysis seems advisable.
Introduction
Last decade, concerns were raised about the reliability of task fMRI findings due to the low repeatability of the reported findings1. The repeatability of findings is of importance, since it is supposed that real results are more repeatable than false results.
The main cause of the elevated occurrence of type I and II errors is the high temporal data noise inherent to fMRI scans. The temporal data noise in fMRI contains signal variations due to motion, breathing, blood pulsations and hardware imperfections2,3. Currently, in task fMRI, these nuisance signals are mostly controlled by adding the realignment parameters as regressors to the design matrix, band-pass filtering of the time series and detrending. However, in resting state fMRI (RS fMRI), additional, denoising techniques were introduced adding despiking and CompCor4 to the denoising step. In CompCor, noise components are first derived from the temporal signals from areas unlikely to show neural activity (e.g. the ventricles) using PCA. Afterwards, in each voxel, the signal variations explained by the noise components and realignment parameters, as determined by a GLM analysis, are subtracted from the signal time series.
In the current study, we tested the effect of denoising the fMRI data, using the RS fMRI denoising techniques, on the outcome and repeatability of the obtained individual and group results.
Methods
From the openfmri.com database we selected 8 fMRI studies (1 Flanker, 1 stop-signal, 1 Simon, 1 attention, 1 motor and 3 language tasks), all scanned on healthy subjects and with the fMRI experiment done twice.
After realignment, slice time correction, normalization and smoothing, the individual fMRI scans were first processed according to the standard analysis pipeline (SA) in SPM: denoising using detrending and band-pass filtering and a GLM analysis with the realignment parameters added as regressors to the design matrix. Secondly the individual fMRI scans were processed according to a modified analysis pipeline (MA): denoising using detrending, band-pass filtering and CompCor and a GLM analysis without the realignment parameters added as regressors to the design matrix. Save for the language studies, 6 simple contrasts per study were defined. Per language study, only 2 contrasts were defined. Afterwards, group analyses were performed per contrast and per scan session for both processing pipelines. All individual and group activation maps were thresholded at p<0.001.
The obtained results were evaluated based on a visual inspection of the result maps, size of the found effects (Cohen’s d-maps) and the overlap between the individual result maps (RoInd-maps) and between the individual and group result maps (Rogr-maps). Additionally, the repeatability of the results was determined based on the overlap between the result maps of both sessions (Ros).
Results
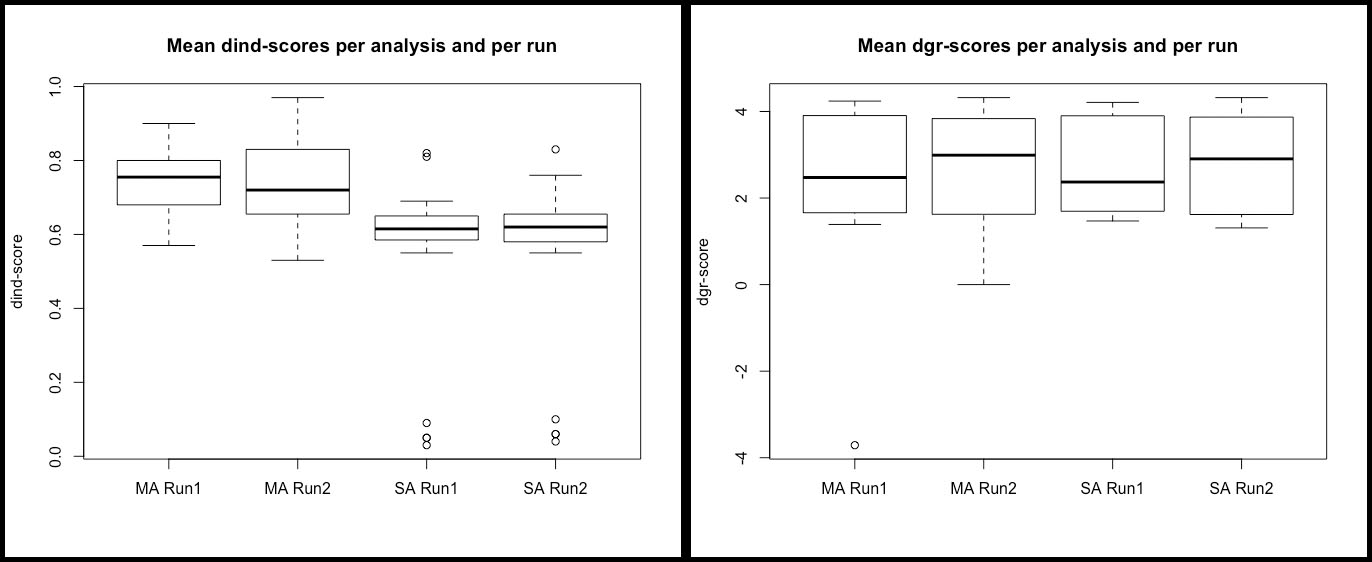
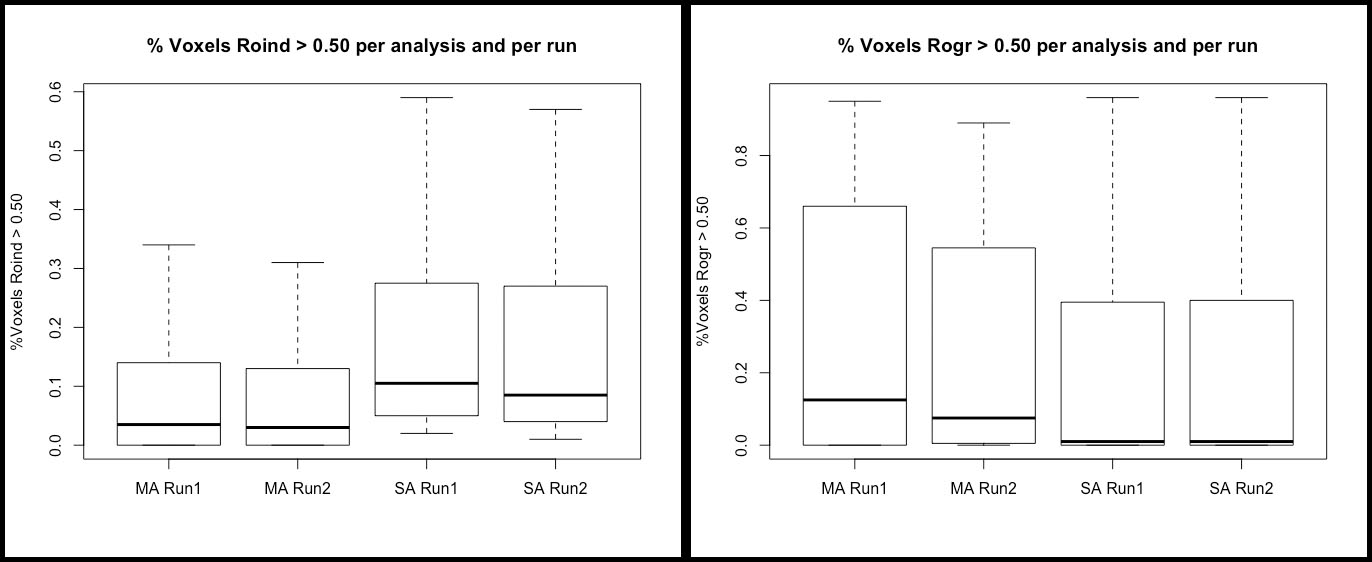
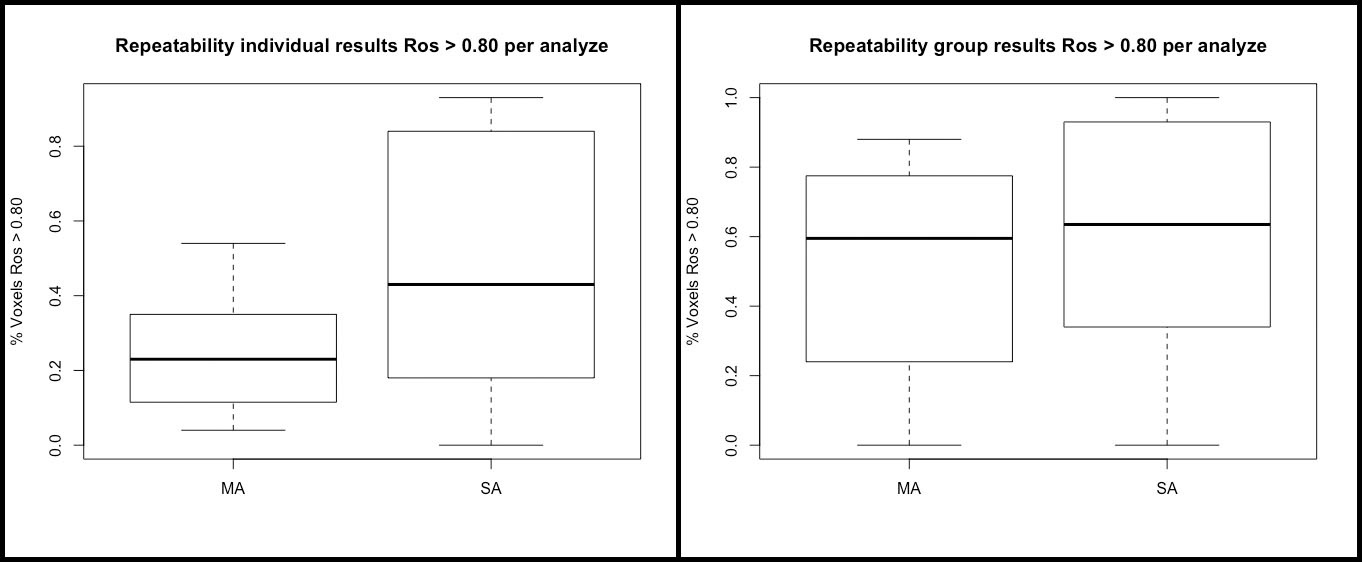
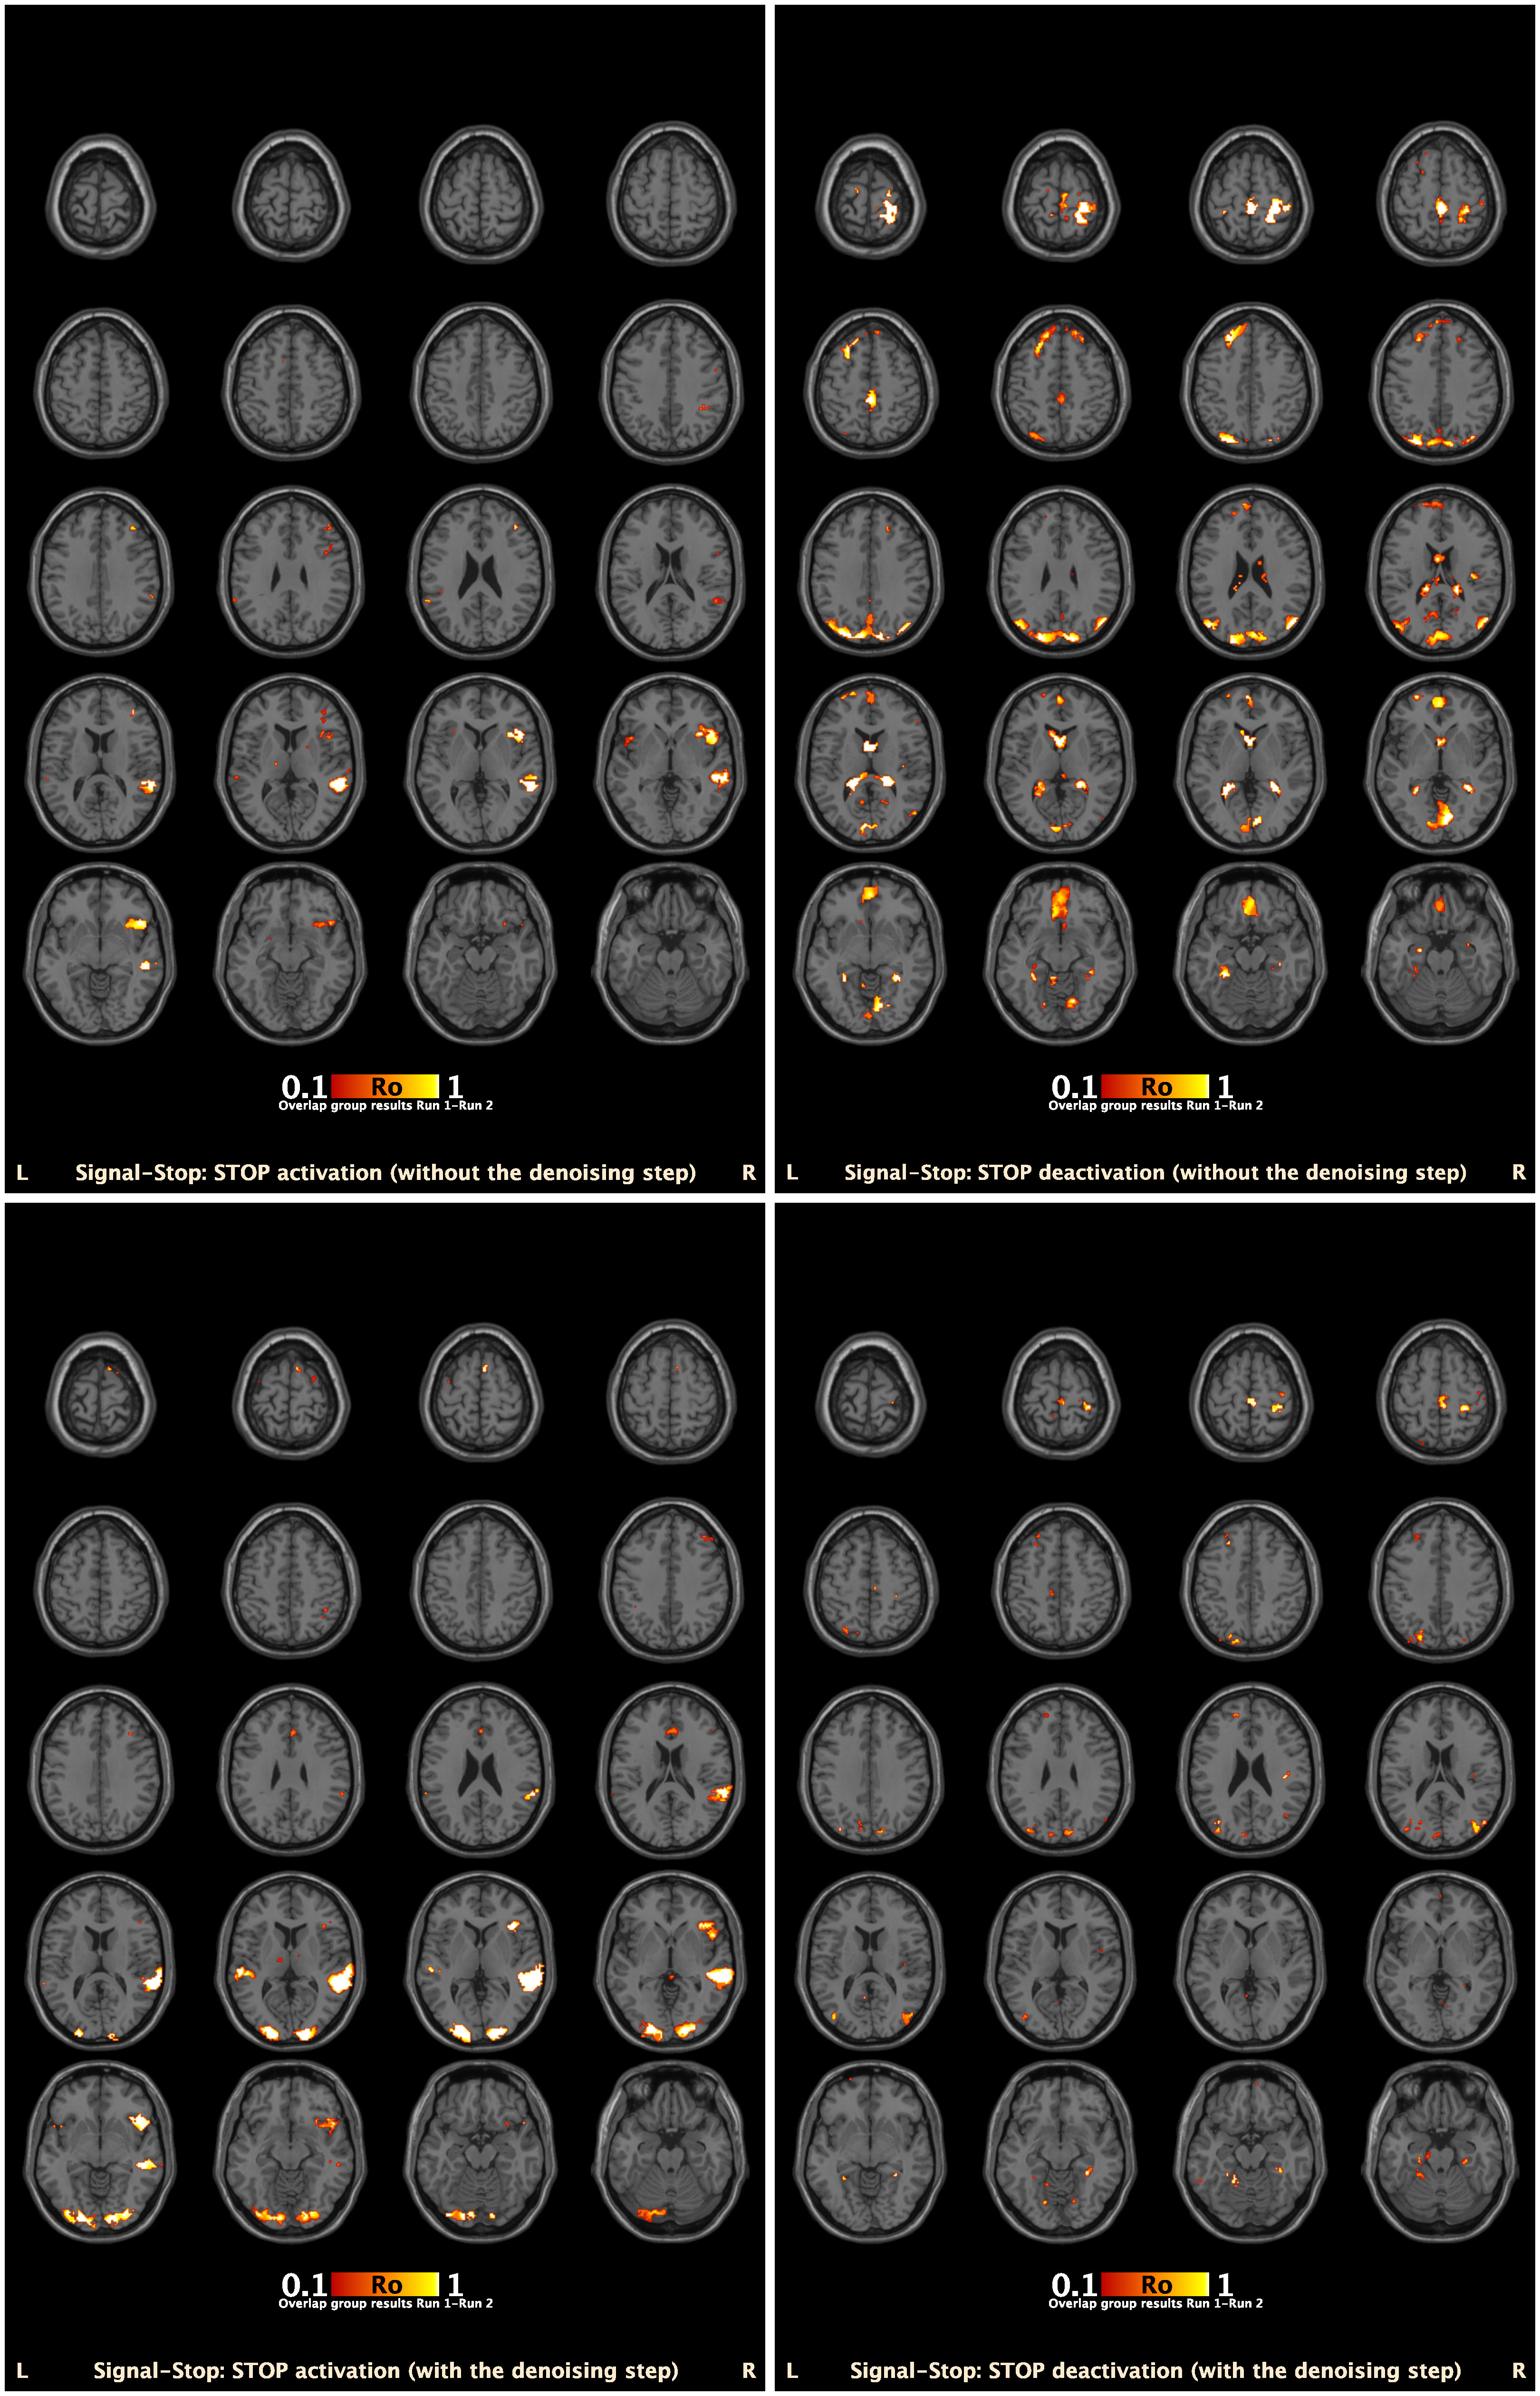
Comparative statistics revealed higher dind-scores in MA (MA-SA: t=0.17, p<0.001) but not higher dgr-scores (MA-SA: t=0.10, p=0.355) (fig. 1). The percentage of voxels with Roind>0.50 was found to be higher in SA (SA-MA: t=0.11, p<0.001), while the percentage of voxels with Rogr>0.50 was found to be higher in MA (SA-MA: t=0.06, p=0.001) (fig. 2). The percentage of voxels with Ros>0.80 was found to be higher in SA (individual results: SA-MA: t=5.22, p<0.001; group results: SA-DA: t=2.07, p=0.046) (fig. 3). However, a visual inspection of the overlap maps, revealed for most contrasts, overlapping results in the ventricles in SA besides those in the brain, which were absent in MA (fig. 1). Moreover, the result maps of MA revealed activations that were expected based on the literature, but were not found in SA.Discussion
Both analysis pipelines seem to give similar activation maps. However, the addition of the extra denoising steps seems to reduce the chance for false results due to blood pulsations, breathing and motion, such as those seen in the ventricles in SA, successfully. Moreover, MA seems to be more sensitive to detect activations in line with the literature. Given this, the result maps of MA give the impression to be more reliable. However, this last statement should first be validated in a similar study using simulated task fMRI data. Moreover, the extra denoising step did not result in higher repeatability scores, suggestive for the lasting occurrence of false findings.Conclusions
An optimal denoising of the fMRI time series prior to the final statistical tests, helps to reduce the chance for false positive results due to motion, breathing and blood pulsations. Given this, it seems worthwhile to add this step to the standard preprocessing protocol of task fMRI data.Acknowledgements
No acknowledgement found.References
- Bennett C.M., Miller M.B. How reliable are the results from functional magnetic resonance imaging? Ann. N.Y. Acad. Sci. 2010, 1191:133-1552.
- Caballero-Gauder et al. Methods for cleaning the BOLD fMRI signal. NeuroImage 2017, 154:128-1493.
- Parkes et al. An evaluation of the efficacy, reliability and sensitivity of motion correction strategies for resting-state functional MRI. NeuroImage 2018, 171:415-4364.
- Behzadi et al. A component based noise correction method (CompCor) for BOLD and perfusion based fMRI. NeuroImage 2007, 37(1):90-101
Figures