3953
On the Reproducibility of In-vivo Temporal Signal-to-Noise Ratio as a Quality Assurance Measure of fMRI Data1SNS Lab, University of Zurich, Zurich, Switzerland, 2Budapest University of Technology and Economics, Budapest, Hungary, 3Brain Imaging Centre, Research Centre for Natural Sciences, Hungarian Academy of Sciences, Budapest, Hungary
Synopsis
Temporal signal-to-noise ratio (tSNR) is commonly used as a quality assurance measure of fMRI data. The aim of this study was to investigate how reproducibly tSNR maps could be collected in-vivo. We collected 16 fMRI time series in several sessions on two different days and calculated tSNR maps for each. The variability was evaluated over all runs, runs within the same session, runs between sessions and runs between days. Reproducibility turned out to be very poor, which precludes using tSNR as an outcome measure for testing variables that are expected to provide modest but otherwise important improvements to data quality.
Introduction
A long-standing tradition advocates temporal signal-to-noise ratio (tSNR) as a quality assurance measure of fMRI data, the pulse sequence or the scanner (1). Often tSNR is measured with a gel or water phantom, but in-vivo measurements are inevitably used to investigate, for example, physiological noise (2) or acquisition and image processing methods (3). In the spirit of the progressively increased attention paid to reproducibility in research in general (4) and specifically in fMRI (5,6) the aim of this study was to investigate the voxel-wise reproducibility of tSNR across scans, sessions and days.Methods
DataSet_1: fMRI time-series data were collected with a 3T Philips Achieva scanner and the vendor’s 8-channel head coil from 19 female volunteers with ethical permission and signed informed consent. Each individual was scanned 16 times – four times per session, two separate sessions per day and on two separate days – with a task-based experiment (3 mm isotropic voxels and TE/TR = 30/2375ms). Each session included a Bo field map and one session also included an anatomical image.
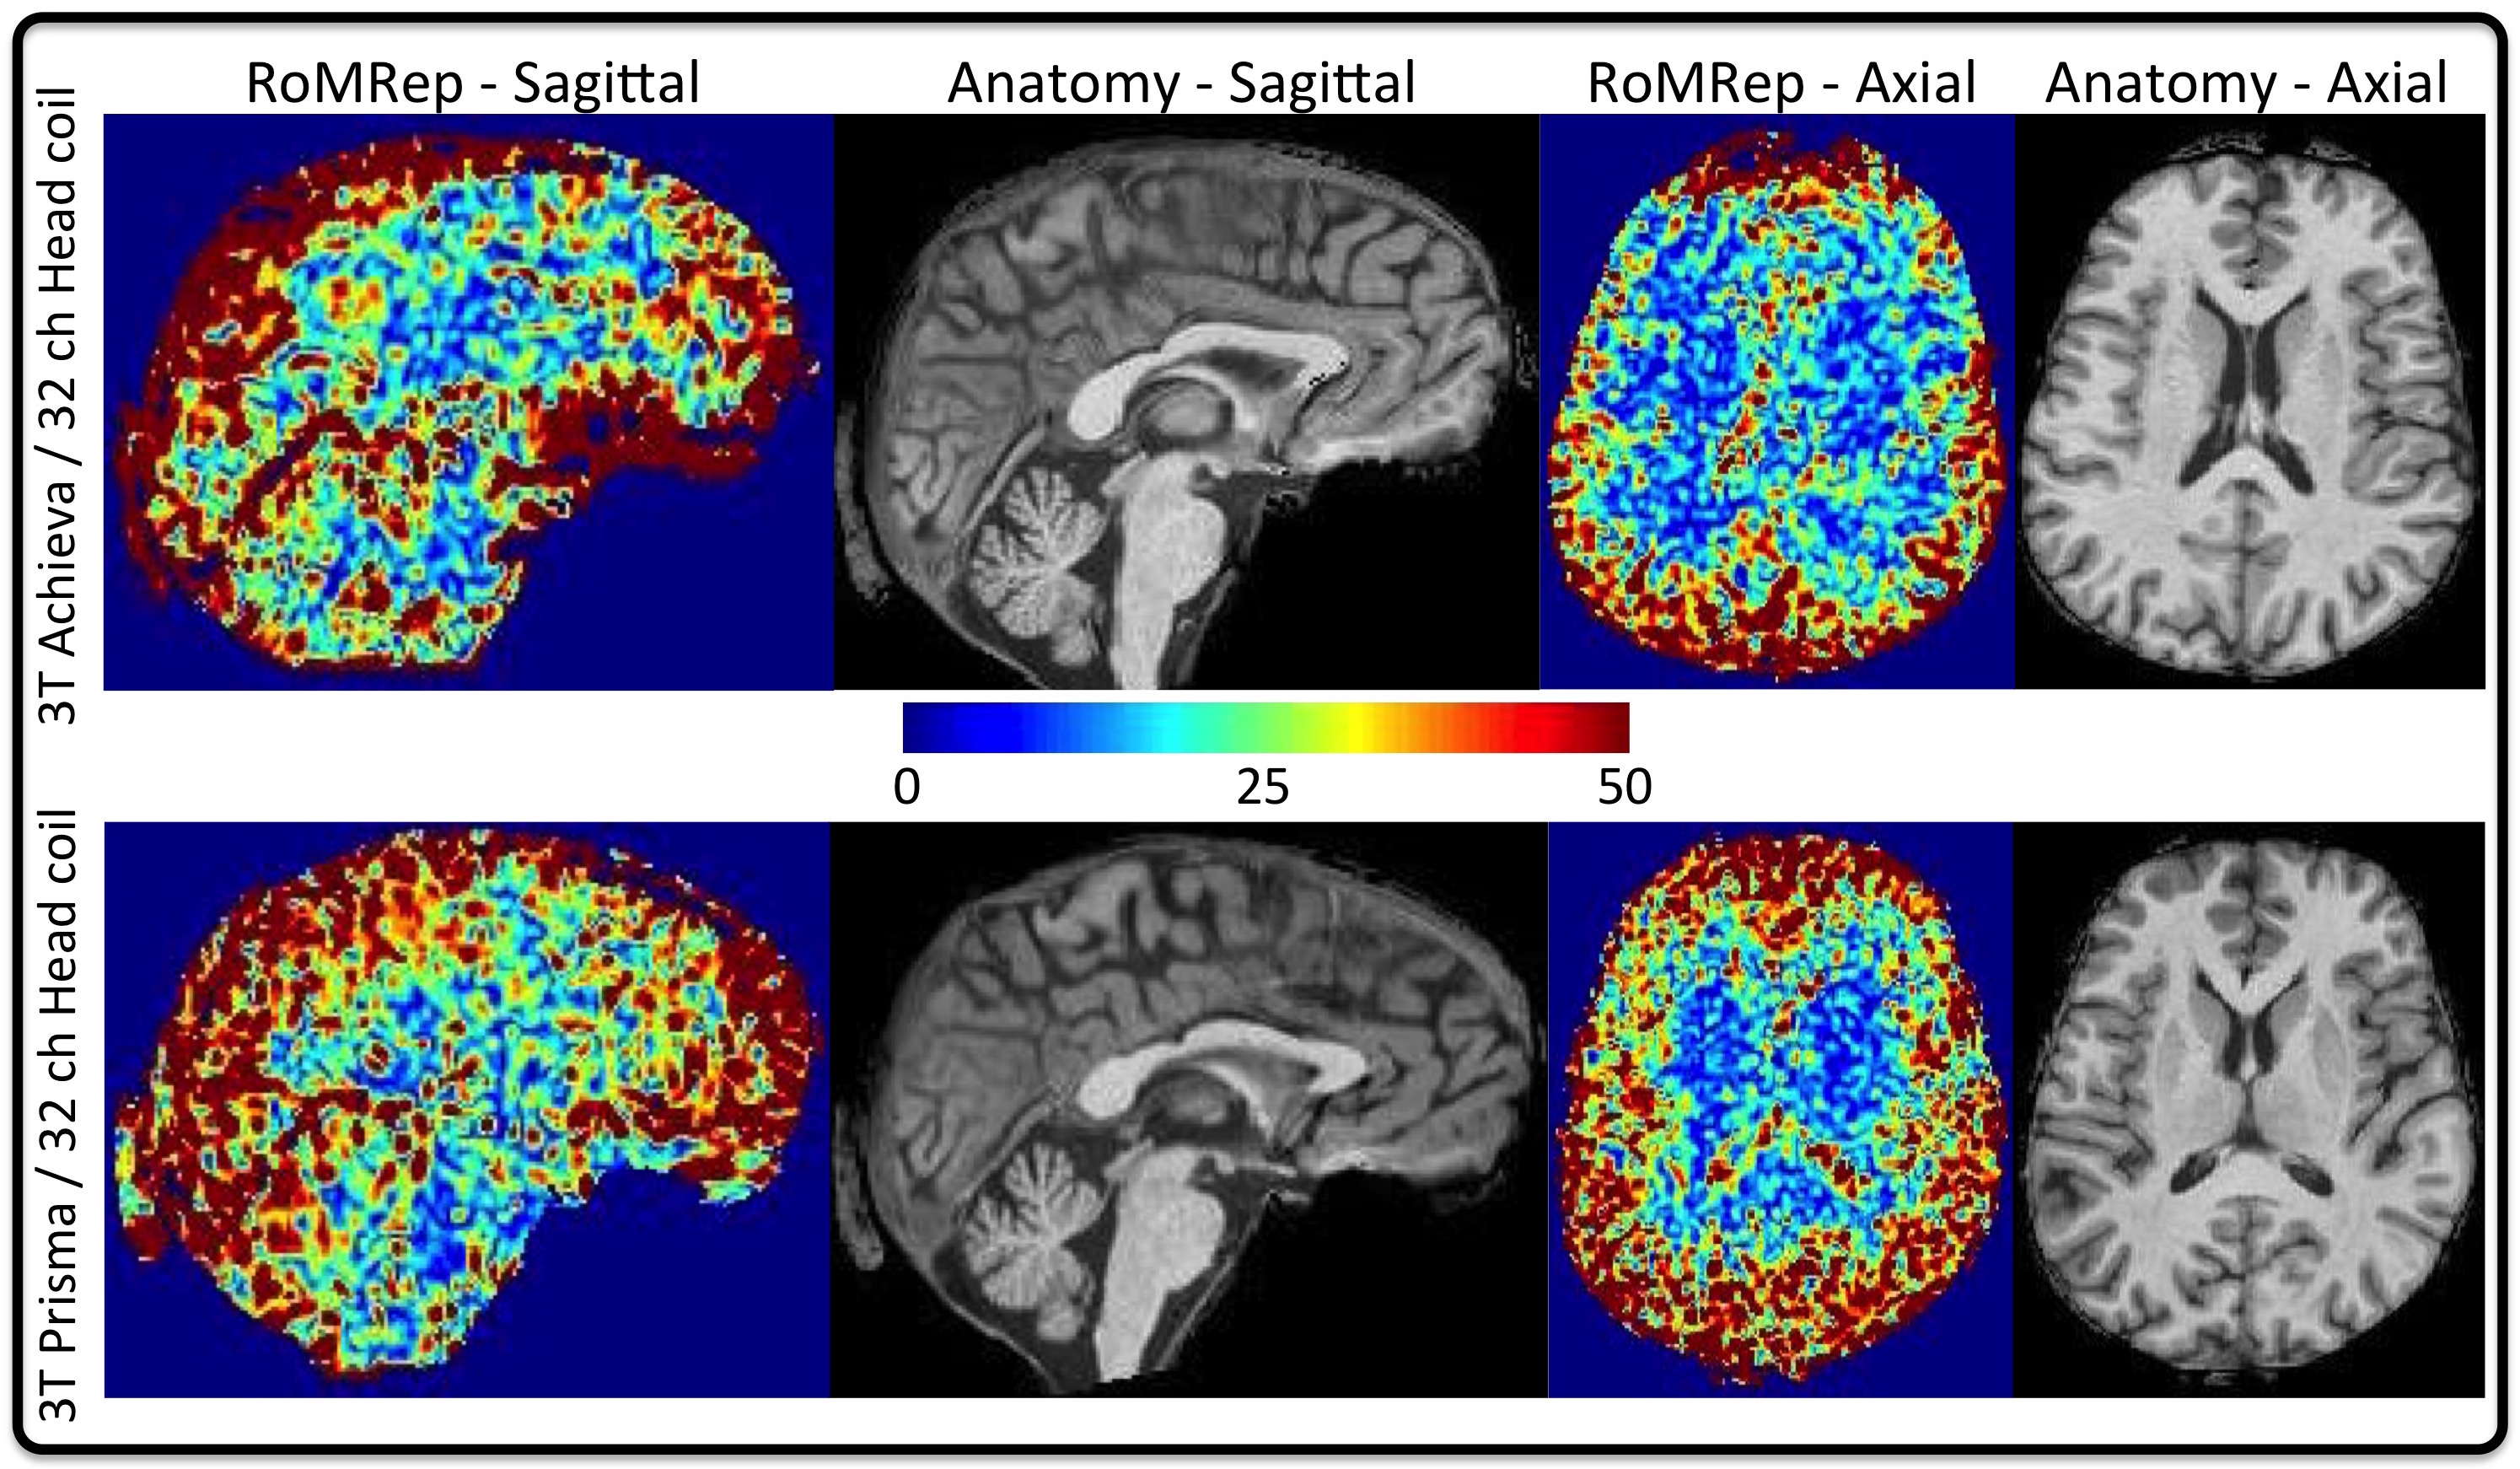
DataSet_2: A male volunteer was scanned 4 times in a single session with a similar protocol on the above Philips scanner and a 3T Siemens Prisma using the vendor’s 32-channel coil.
Image processing: Each fMRI time-series was treated independently in both DataSets_1&2. Using SPM 12 (7) each dataset was realigned and corrected for susceptibility-induced distortions. The voxel-wise tSNR was calculated after detrending to remove slow drifts. Using the temporal mean image the tSNR volume was aligned to the anatomical image.
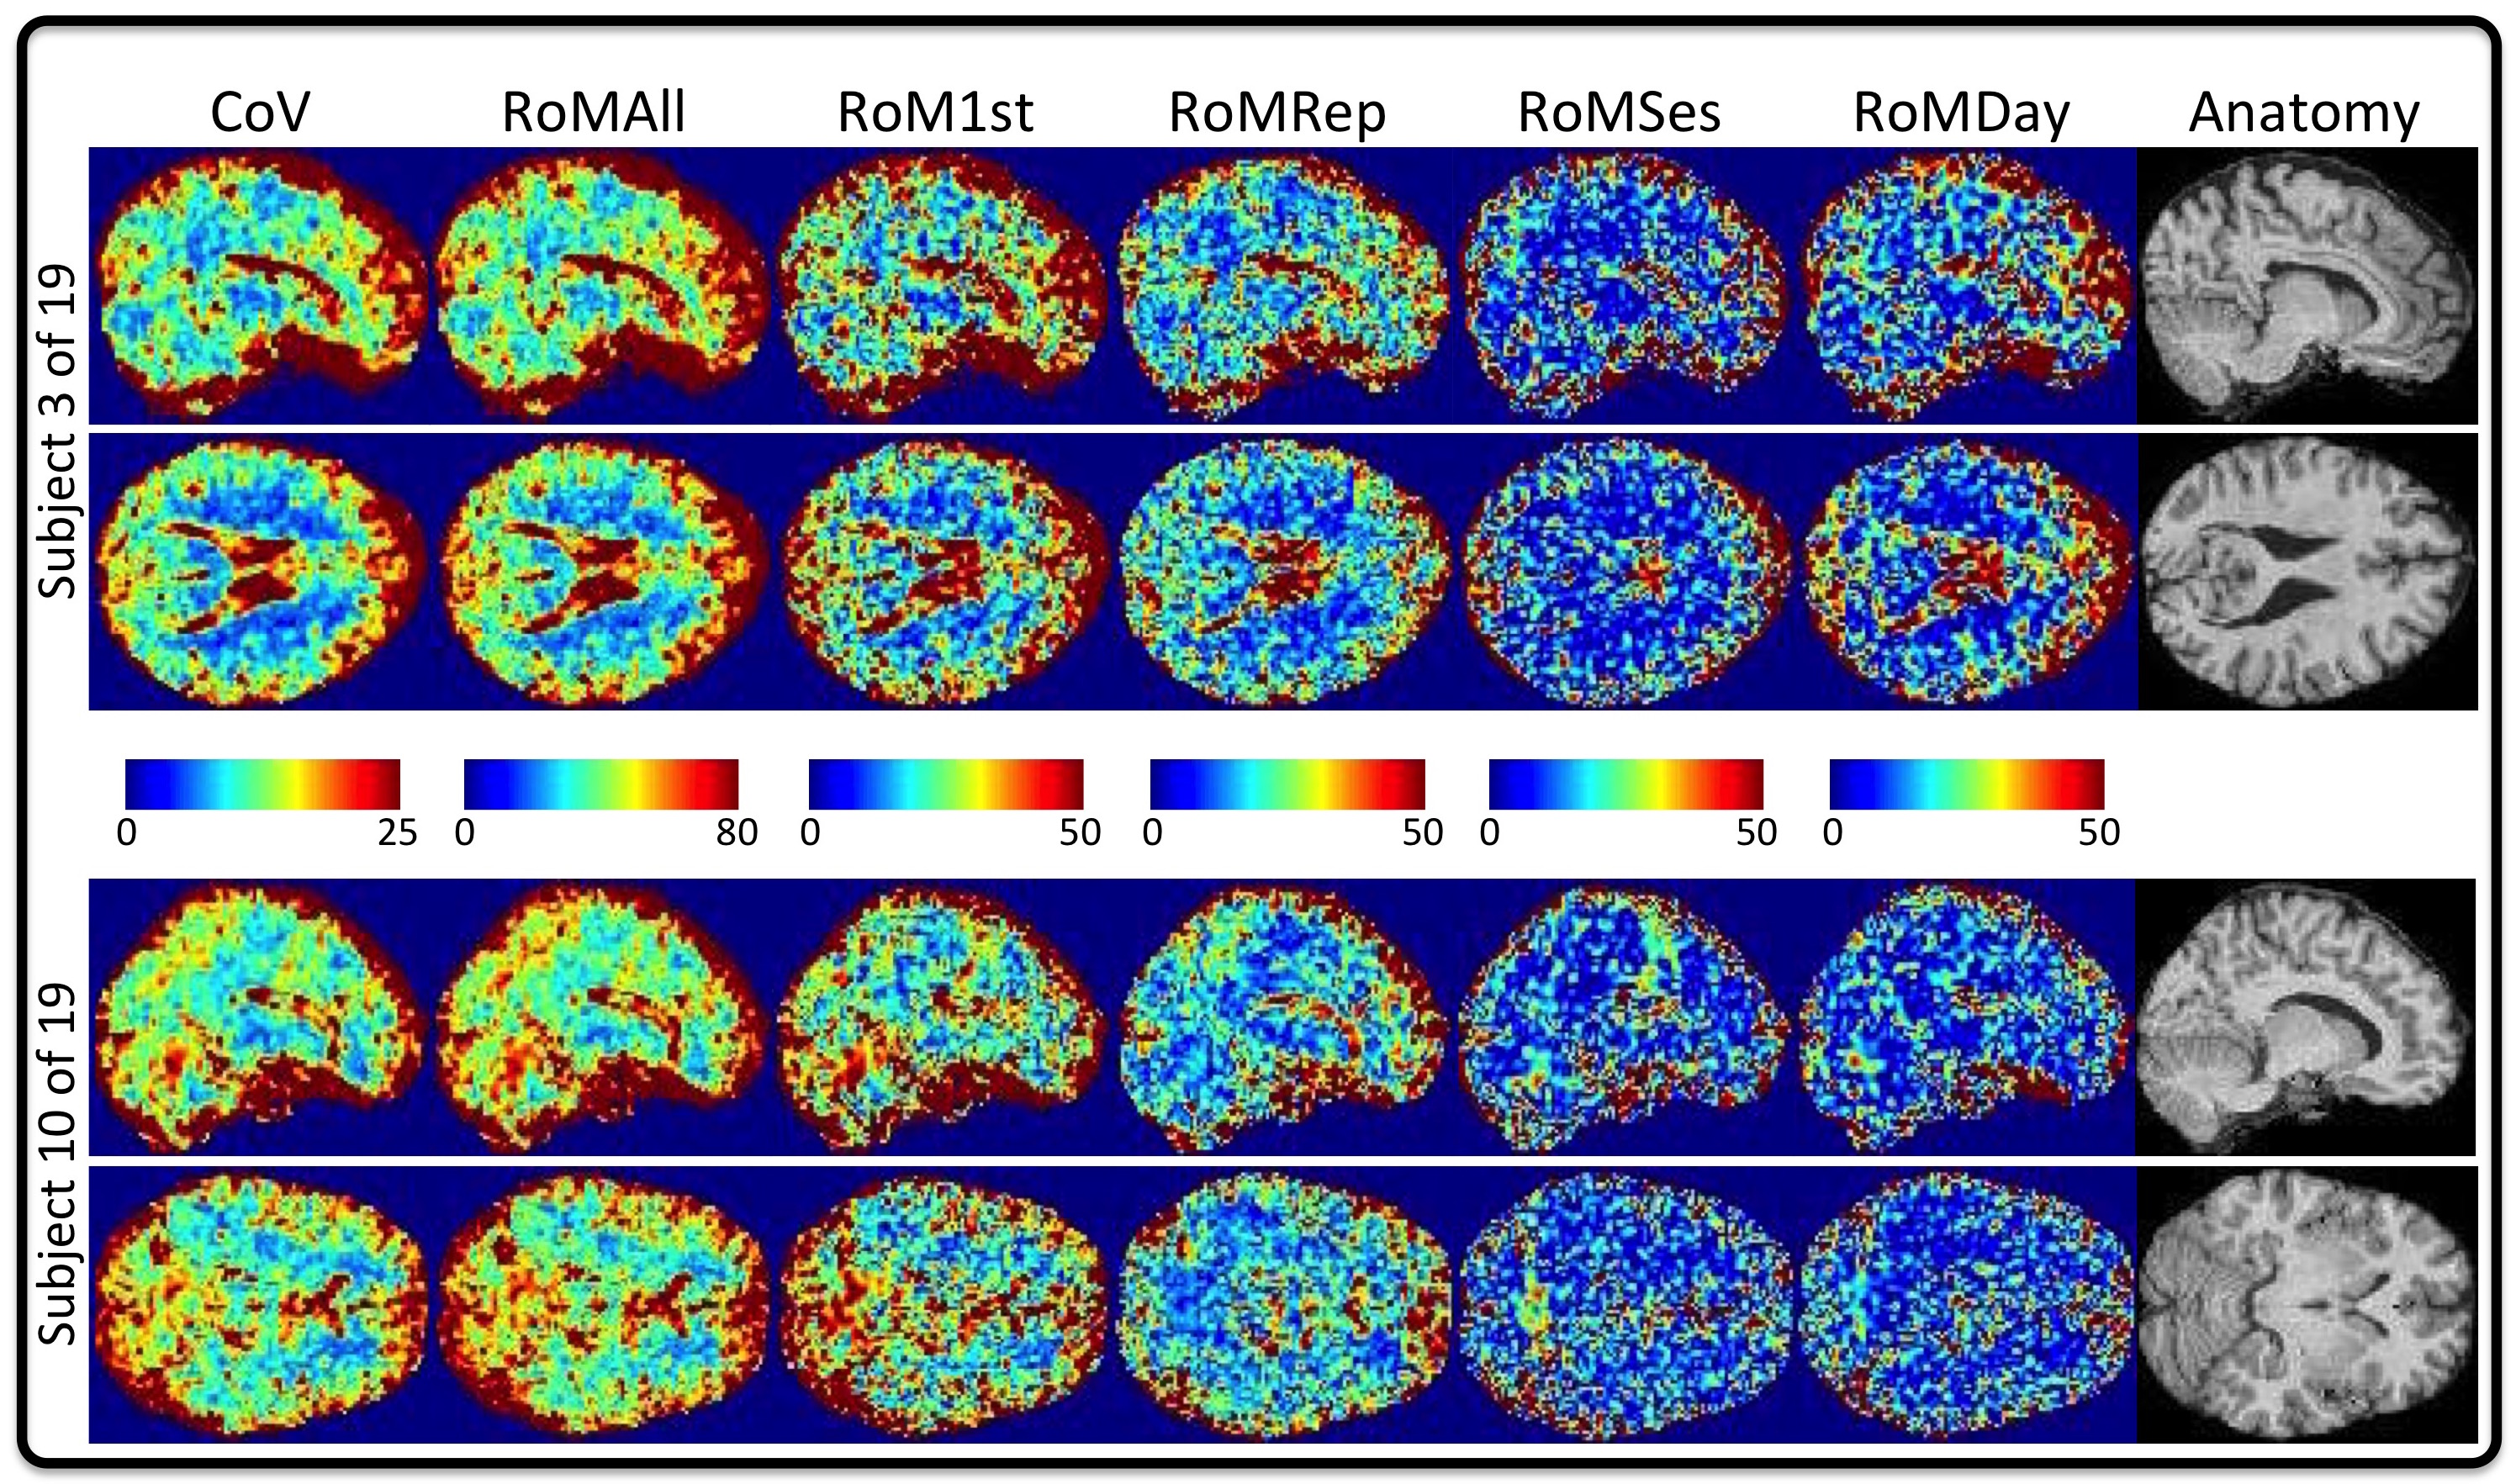
Statistical analysis: To measure reproducibility, for DataSet_1 we calculated the voxel-wise
a) coefficient of variance (CoV) across all 16 repeats
b) range over mean (RoM) for the
- 4 repeats in each session (RoMRep)
- first repeat of each session across the 2 sessions on each day (RoMSes)
- first repeat of the first session on two different days (RoMDay)
- 16 repeats (RoMAll) and the first scan of each session (RoM1st) for comparison
For DataSet_2, which had a single session, RoMRep was calculated.
Results
Fig_1 displays the CoV and the five different RoM measures for 2 of the 19 subjects in DataSet_1. Because we treated each session as an independent measurement, the time between the Bo field map and the fMRI data is a confound. This may be one cause for the higher variability in RoMRep. For this reason we also calculated RoM1st, which measures the variability of the 1st fMRI time-series in each of the 4 sessions, which is closest in time to the Bo field map.
The RoMRep is displayed for both scanners of DataSet2 in Fig_2. Note that this experiment involved a motivated and well-behaved subject with minimal movement. Therefore, the confounding effect of time between acquiring the Bo field map and the fMRI data should be minimized. Nevertheless, the variability was again unexpectedly high.
Discussion
We found that the reproducibility of the voxel-wise tSNR measure was surprisingly poor. It is important to point out that such variability was not specific to one particular scanner model, scanner installation or head coil. It is likely that this large variability is a combined effect of
- inconsistency in the scanning procedure (e.g. positioning of subject etc.)
- scanner instability across repeats, sessions and days (e.g. gradient heating, RF transmit variations, etc.)
- physiological noise (e.g. cardiac, subject movement, etc.)
- image processing (e.g. imperfect modeling of movement by Bo interactions, realignment etc.)
Our decision to treat each of the four repeats in a given session identical may be remedied by first aligning all fMRI data before correcting for the effects of the Bo field inhomogeneity.
The poor reproducibility of voxel-wise tSNR necessitates the investigation of its importance. It may be that detecting the BOLD activity in a given subject is robust against the observed unreliability of tSNR – which would motivate dropping tSNR as a quality assurance measure. On the other hand, if the sensitivity of our experiment is predictable by tSNR, we should spend the necessary effort on identifying and eliminating the sources of variance. This may be as simple as taking more care in positioning the subjects in multi-channel coil arrays whose SNR profile is highly variable.
Our current and future work is focused on investigating the relationship between tSNR and the sensitivity of detecting a BOLD activation. If the expected relation exists, we will endeavor to disentangle the possible variance sources and devise methods to eliminate them.
Acknowledgements
No acknowledgement found.References
1. Friedman L, Glover GH. Report on a multicenter fMRI quality assurance protocol. J Magn Reson Imaging2006;23(6):827-839.
2. Triantafyllou C, Polimeni JR, Wald LL. Physiological noise and signal-to-noise ratio in fMRI with multi-channel array coils. Neuroimage2011;55(2):597-606.
3. Molloy EK, Meyerand ME, Birn RM. The influence of spatial resolution and smoothing on the detectability of resting-state and task fMRI. Neuroimage2014;86:221-230.
4. Baker M. Is There A Reproducibility Crisis? Nature2016;533:452-454.
5. Editorial. Fostering reproducible fMRI research., in Nat Neurosci 2017;20(3):298
6. Poldrack RA, Baker CI, Durnez J, Gorgolewski KJ, Matthews PM, Munafò MR, Nichols TE, Poline JB, Vul E, Yarkoni T. Scanning the horizon: towards transparent and reproducible neuroimaging research. Nat Rev Neurosci2017;18(2):115-126.
7. Friston KJ, Ashburner JT, Kiebel SJ, Nichols TE & Penny WD, et al. (2007) Statistical Parametric Mapping: The analysis of functional brain images. London; ELSEVIER.
Figures