3950
Evaluation of simultaneous multi-slice EPI acquisition with an 8-channel coil for resting state functional MRI1Department of Radiology, University of Washington, Seattle, WA, United States, 2Department of Anatomy and Medical Imaging & Centre for Brain Research, University of Auckland, Auckland, New Zealand, 3Department of Radiology, Stanford University, Stanford, CA, United States
Synopsis
Simultaneous multi-slice (SMS) imaging has shown to be a promising tool for improving the efficiency of resting state fMRI (rs-fMRI). As the multi-slice acceleration factor in SMS increases, so does the temporal resolution, allowing increased sensitivity of rs-fMRI measurements. However, to achieve high multi-slice acceleration factors, SMS typically uses higher channel (>=32) receiver coils that may not be available in many research and clinical settings. In this study, we explored the efficacy of using SMS with a typical 8-channel receiver coil for rs-fMRI. Upon employing the slice orientation that maximizes the coil sensitivity variation along the slice direction, we were able to acquire high temporal resolution (TR=400 ms) rs-fMRI data. Compared with the conventional-EPI acquisition (TR=2000 ms), the proposed SMS-EPI acquisition provided superior sensitivity and test-retest reliability for rs-fMRI.
Introduction
Recent advancements in simultaneous multi-slice (SMS) imaging have enabled whole-brain resting-state fMRI (rs-fMRI) scanning at sub-second temporal resolution thus increasing the statistical power and sensitivity of the rs-fMRI measurements1,2. To achieve acceleration in SMS, multi-channel receiver coil arrays are required to provide adequate sensitivity variation across the slice direction. For acceleration factors of >4, typically 32 (or greater) multi-channel receiver coils are employed. However, such receiver coils are not available in many research and clinical settings. In this study, we explored the possibility of using SMS together with a typical 8-channel receiver coil for rs-fMRI. A slice orientation was chosen to provide the maximum coil sensitivity variation along the slice direction. The results were compared with conventional unaccelerated rs-fMRI in terms of signal-noise separation (SNS)2,3 and test-retest reliability.Methods
9 healthy volunteers (36±15 yrs) were scanned on a 3.0T scanner (GE MR750) using an 8-channel
head coil (GE Signa MRI Brain Array Coil). Each subject was scanned in two
different sessions, 4-14 days apart. In each session, rs-fMRI data were
acquired using two methods: 1) SMS-EPI1 with an acceleration factor of
5, CAIPI shift of FOV /3, TR/TE= 400/30 ms, scan duration = 5 min, voxel size = 3.14 x 3.14
x 4 mm. SMS-EPI data was collected using both axial and sagittal slice orientations, 2) Conventional
2D EPI with TR/TE = 2000/30 ms, axial slice orientation, with the
same voxel size and scan duration as SMS-EPI. Images were preprocessed
(movement correction, regression of the global signal, white matter, gray matter and movement
parameters) and normalized to the MNI space. For conventional-EPI data, a low-pass filter
with a cutoff frequency of 0.1Hz was applied to the data. For SMS-EPI data, two
band-stop filters ([0.25 – 0.35] Hz and [0.8 - 1.1] Hz) corresponding to
the respiratory and cardiac frequency components were applied (Figure 1.a and b).
For each method, data was decomposed
into 30 independent components using MELODIC ICA4 . Fourteen components
corresponding to functional connectivity networks5 were defined for each subject
using a template matching procedure followed by manual inspection (Figure
1.e). To assess the sensitivity of each method
in identifying functional connectivity networks, their SNS were compared.1,2. Here, signal was defined as the percentage of the
signal variance explained by 14 functional connectivity ICA components2. Noise was defined as the percentage of variance not explained by functional
connectivity ICA components. In most cases, noise components were clearly driven
by vascular pulsation, residual movement, and artifacts originating from
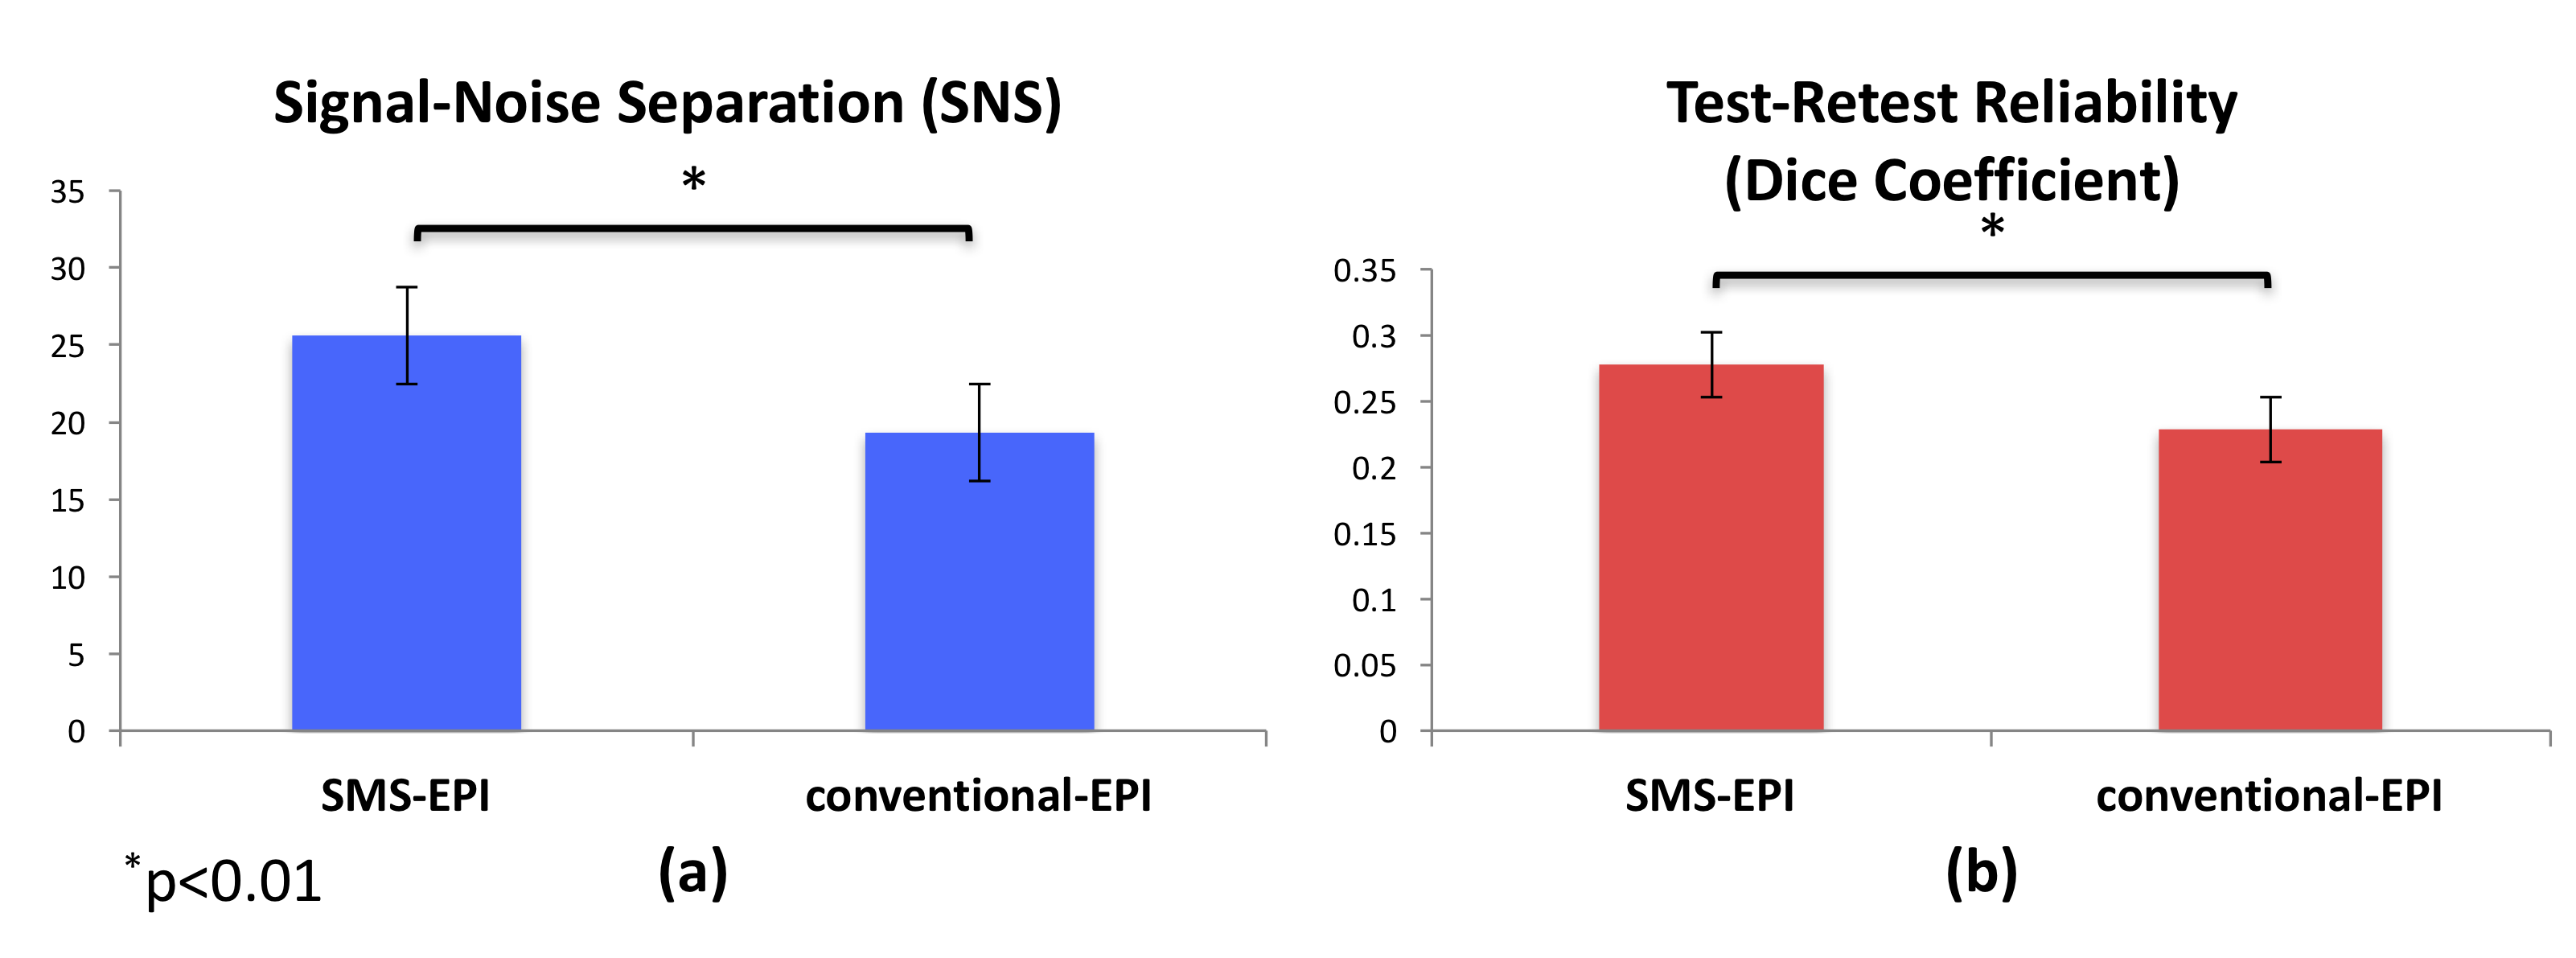
non-neuronal sources (see Figure 1.d for examples of the nuisance components). Using a two-sample t-test, the signal and noise were compared, and the resulting t-score was used as an estimate of SNS. Test-retest reliability of each method was
estimated using the Dice coefficient2, which measures the percentage of a
functional connectivity network that is significant during the test
scan and remains significant during the retest scan. Results
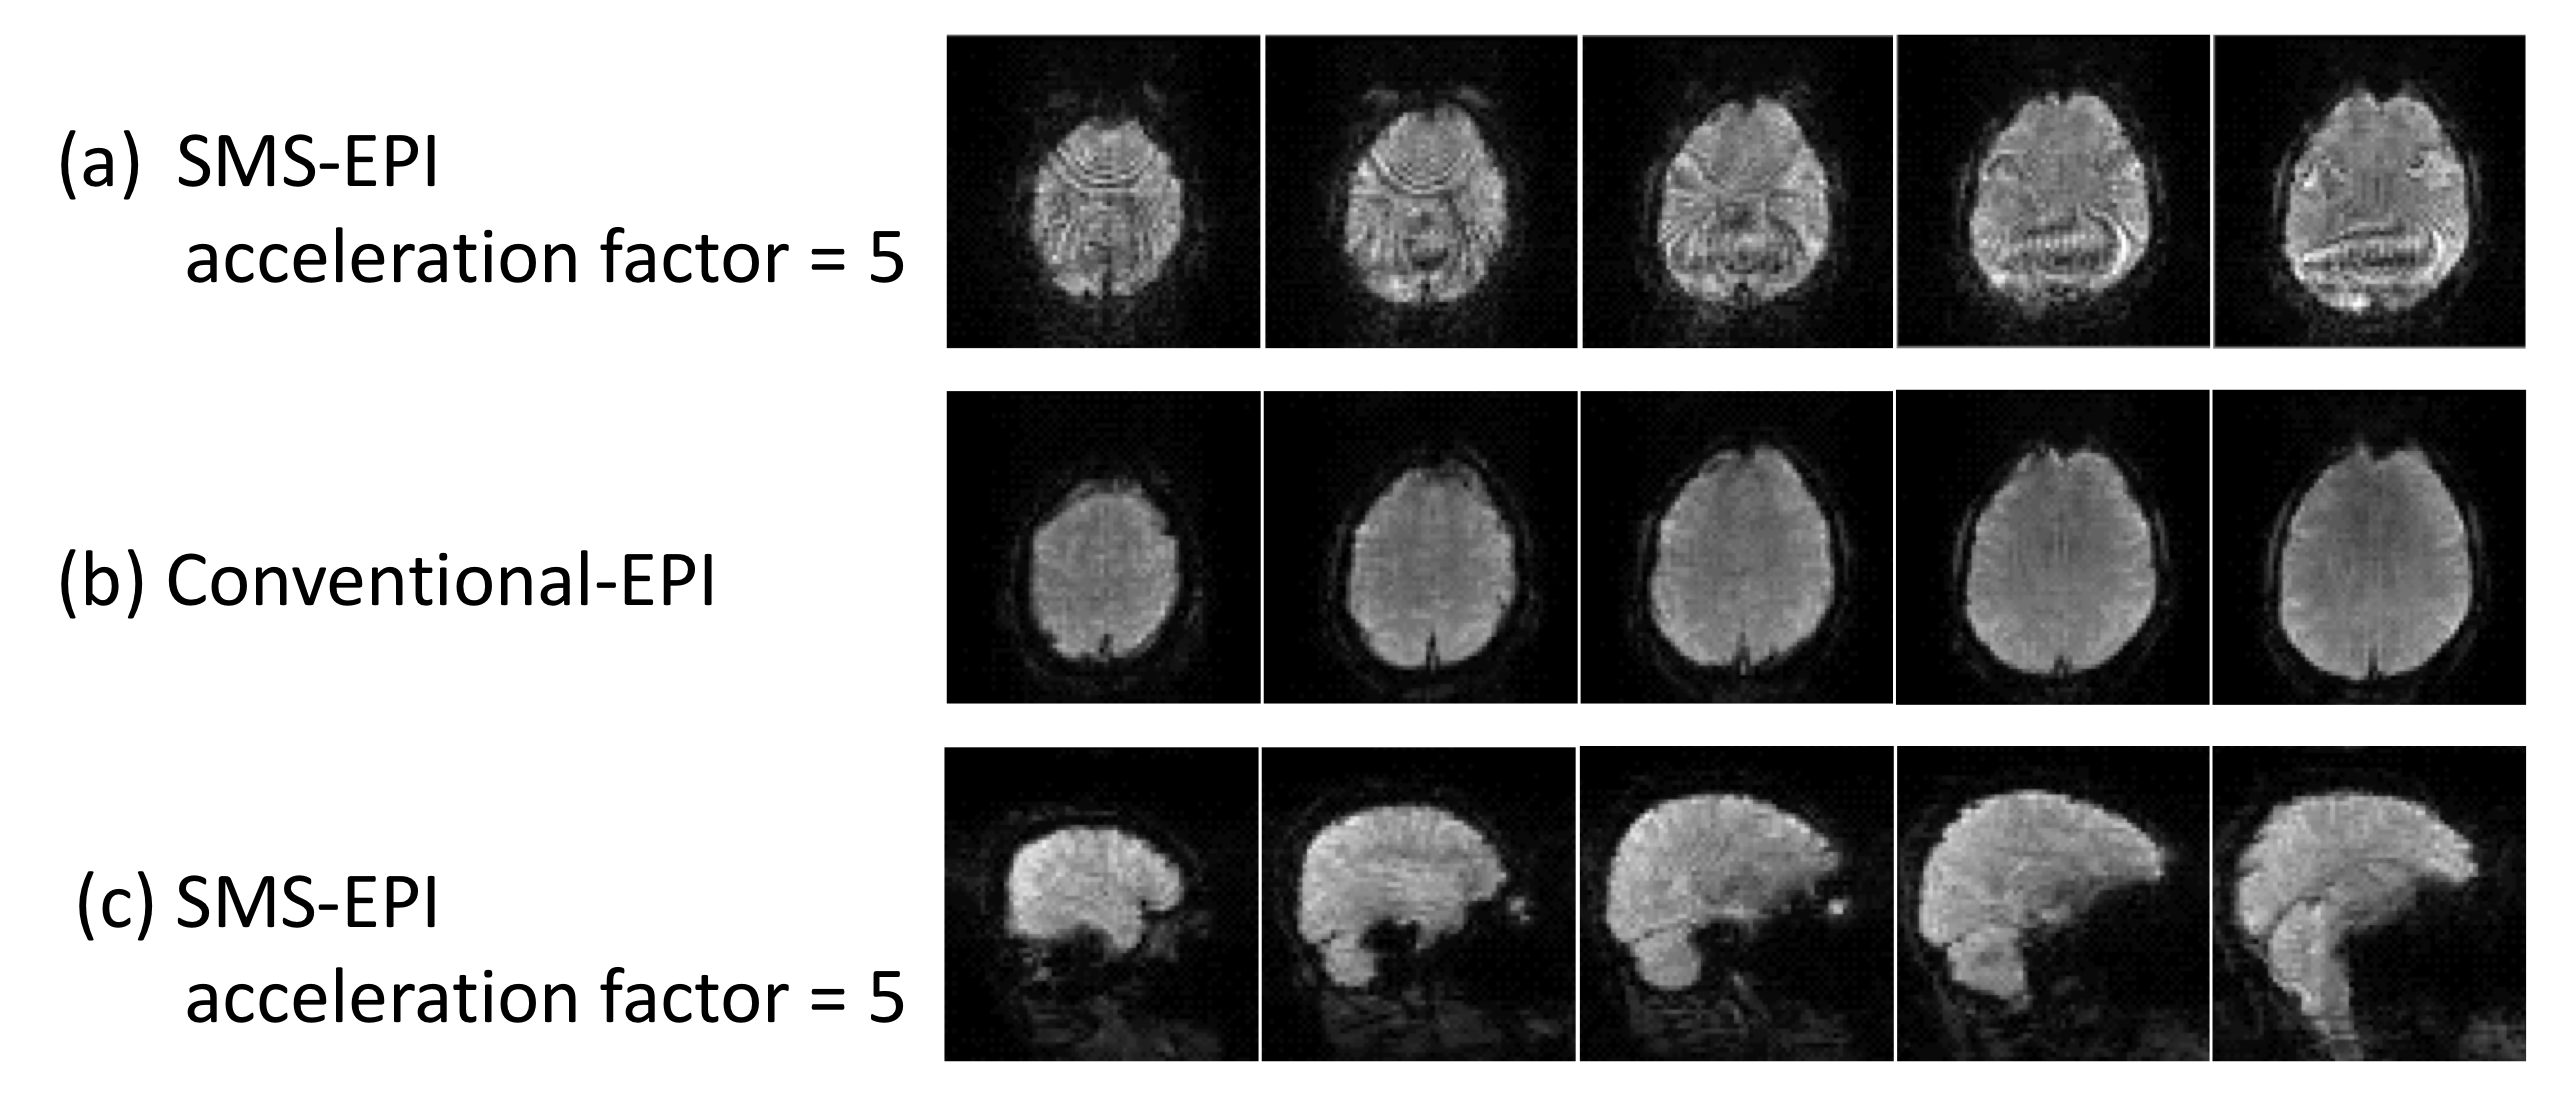
We observed that the axial SMS-EPI acquisition generated large amounts of aliasing and g-factor noise artifacts in all subjects (e.g. Figure 2.a). However, the artifacts presented in sagittal SMS-EPI data were negligible. (Fig 2.c). Therefore, axial SMS-EPI data was excluded from further analyses. As can be seen in Figure 3, the sagittal SMS-EPI acquisition provided significantly superior SNS and TRT (p<0.01) compared with conventional-EPI. An example of functional connectivity maps obtained using each method is presented in Figure 4.Discussion
As expected, the 8-channel coil used in this study did not provide enough sensitivity variation along the axial direction, leading to high g-factor noise in the reconstructed slices. Conversely, the improved the sensitivity-encoding power in the sagittal plane resulted in a reduction in noise and other artifacts in the reconstructed images (Figure 2). SMS-EPI (acquired in the sagittal plane) came with some notable advantages over unaccelerated conventional-EPI. While one volume of SMS-EPI data had a lower SNR compared with one volume of conventional-EPI, the boost in temporal resolution (TR=400ms) in SMS-EPI provided an overall boost in temporal SNR. Additionally, since the TR was short enough to allow the BOLD signal to be sampled above the Nyquist frequency of the cardiac and respiratory cycles, these confounding components could be effectively removed using temporal filtration. As such, the improved temporal SNR and improved noise removal strategy enabled by the SMS-EPI acquisition, provided a more sensitive and reliable measurement of functional connectivity networks compared with conventional-EPI.Conclusions
We have shown that by changing the slice encoding direction, and improving the sensitivity encoding power along the slice axis, it is possible to use SMS-EPI effectively with a limited number of receiver coils. This approach leads to improved temporal resolution, statistical power, sensitivity, and reliability of functional connectivity measurements compared with the conventional-EPI acquisition.Acknowledgements
This work is supported by NIH grants 1R01NS066506, 2R01NS047607, R01 DK092241.References
[1] Setsompop, K., Gagoski, B.A., Polimeni, J.R., Witzel, T., Wedeen, V.J., Wald, L.L., 2012. Blipped-controlled aliasing in parallel imaging for simultaneous multislice echo planar imaging with reduced g-factor penalty. Magn. Reson. Med. 67, 1210–1224.
[2] Jahanian, H., Holdsworth, S., Christen, T., Wu, H., Zhu, K., Kerr, A.B., Middione, M.J., Dougherty, R.F., Moseley, M., Zaharchuk, G., 2018. Advantages of short repetition time resting-state functional MRI enabled by simultaneous multi-slice imaging. J Neurosci Methods 311, 122-132.
[3] Shirer, W.R., Jiang, H., Price, C.M., Ng, B., Greicius, M.D., 2015. Optimization of rs-fMRI Pre-processing for Enhanced Signal-Noise Separation, Test-Retest Reliability, and Group Discrimination. Neuroimage 117, 67-79.
[4] Beckmann, C.F., Smith, S.M., 2004. Probabilistic independent component analysis for functional magnetic resonance imaging. IEEE Trans. Med. Imaging 23, 137–152.
[5] Shirer, W.R., Ryali, S., Rykhlevskaia, E., Menon, V., Greicius, M.D., 2012. Decoding subject-driven cognitive states with whole-brain connectivity patterns. Cereb Cortex 22, 158-165.
Figures