3944
Silent fMRI with visual and auditory stimulation using 3D radial T2*-weighted ZTE-BURST sequence1IMT School for Advanced Studies, Lucca, Italy, 2IMAGO7 Foundation, Pisa, Italy, 3IRCCS Stella Maris, Pisa, Italy, 4Italian National Institute of Nuclear Physics, Pisa, Italy, 5GE Healthcare, Munich, Germany
Synopsis
Besides being a major cause of patient discomfort, acoustic scanner noise (ASN) represents one of the main confounding factors in fMRI with auditory stimulation and in resting state conditions. The recent development of silent T2*-weighted MR sequences may open up new possibilities in the study of brain function in a quieter environment offering novel tools of acquisition, alternative to EPI. In this feasibility study we aim to produce and evaluate BOLD activity maps at 7T using a novel 3D radial T2* sequence (ZTE-BURST).
Introduction
The detrimental effect of acoustic scanner noise (ASN)1 has been reported in several experimental conditions, such as fMRI experiments that involve auditory stimulation2,3, resting state scans4 and sleep studies5. Some of the challenges related to ASN include stimulus masking, undesired additional cognitive effort for the subject and interference during stimulus processing, which can contaminate the results. To overcome this limitation, we adopted a novel 3D radial sequence with T2*-contrast capability (ZTE-BURST), which has been shown to exhibit minimal ASN in structural MRI acquisition (76 dBA)6. The sequence parameters have been tailored for fMRI experiments, and we used auditory and visual stimulation to assess whether ZTE-BURST is a suitable technique to enable BOLD-fMRI experiments in a silent environment.Methods
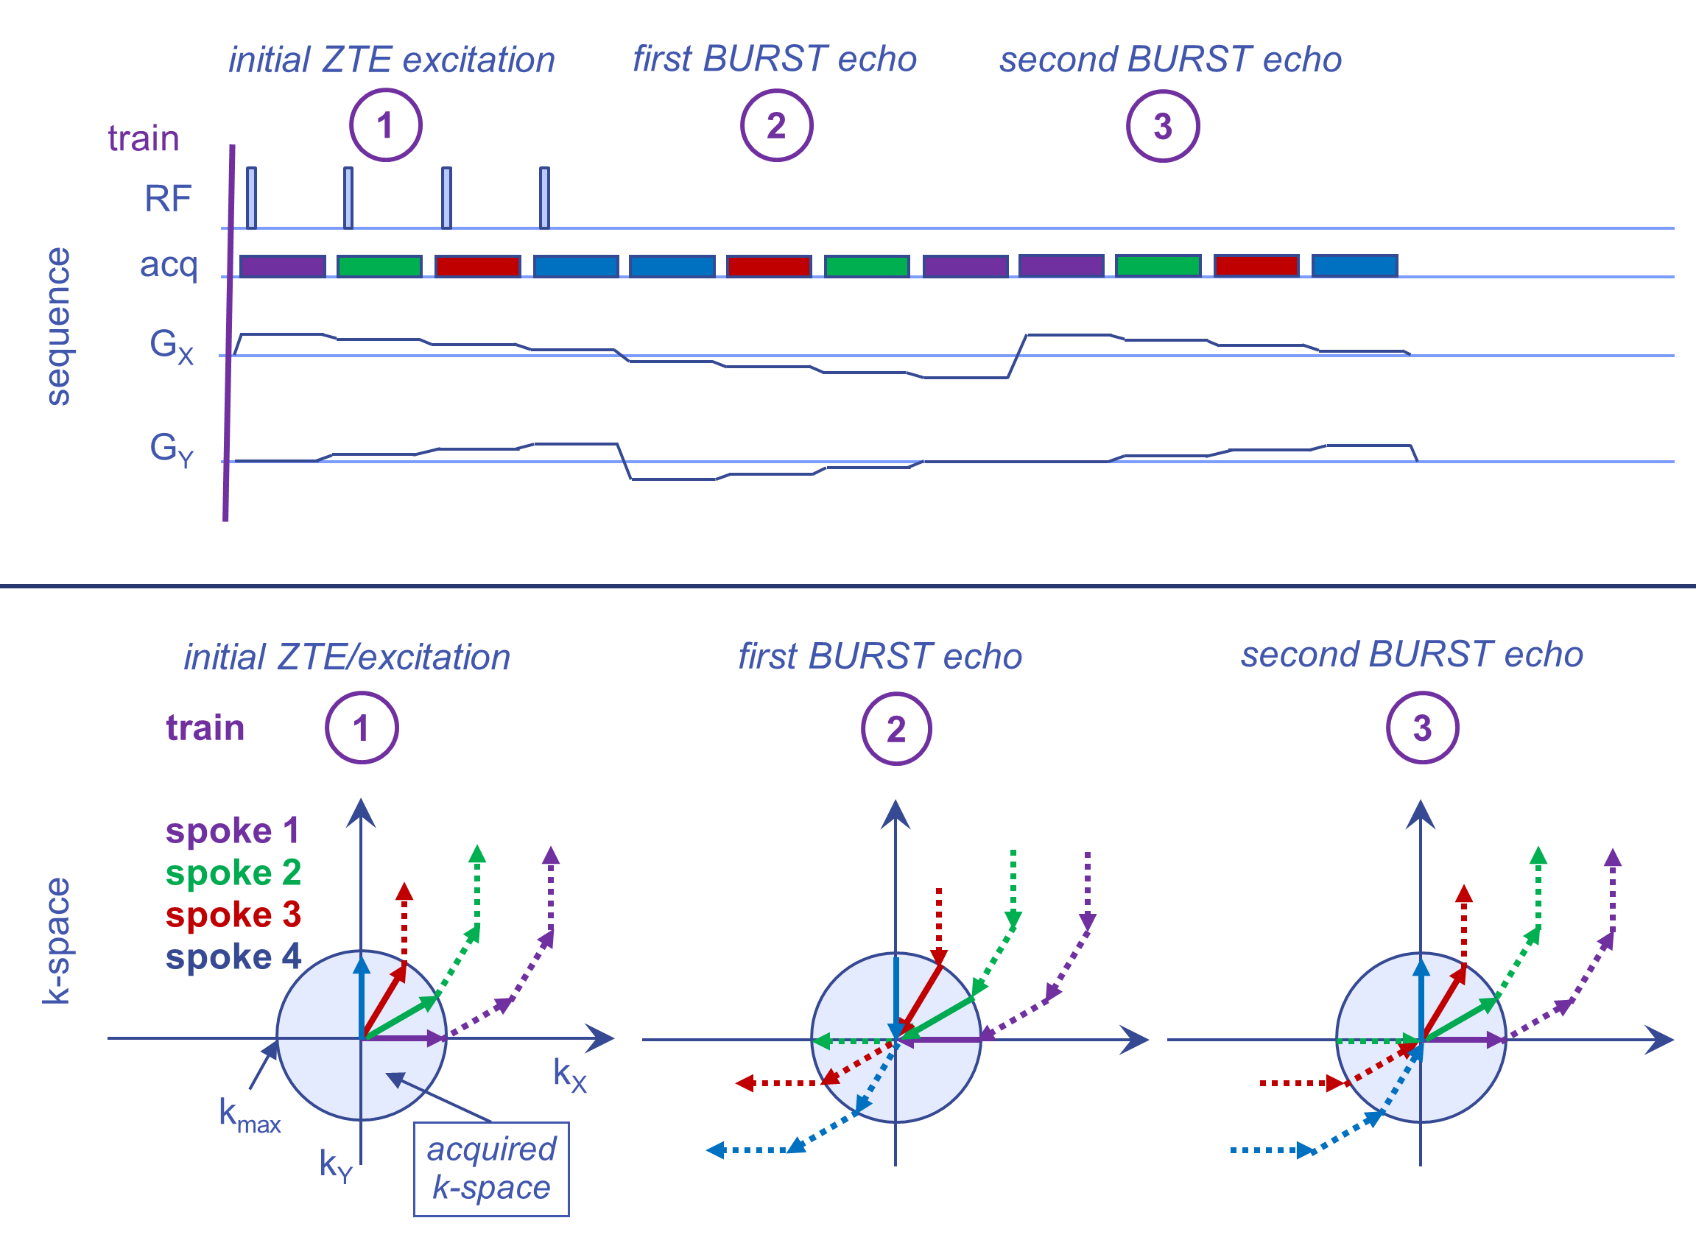
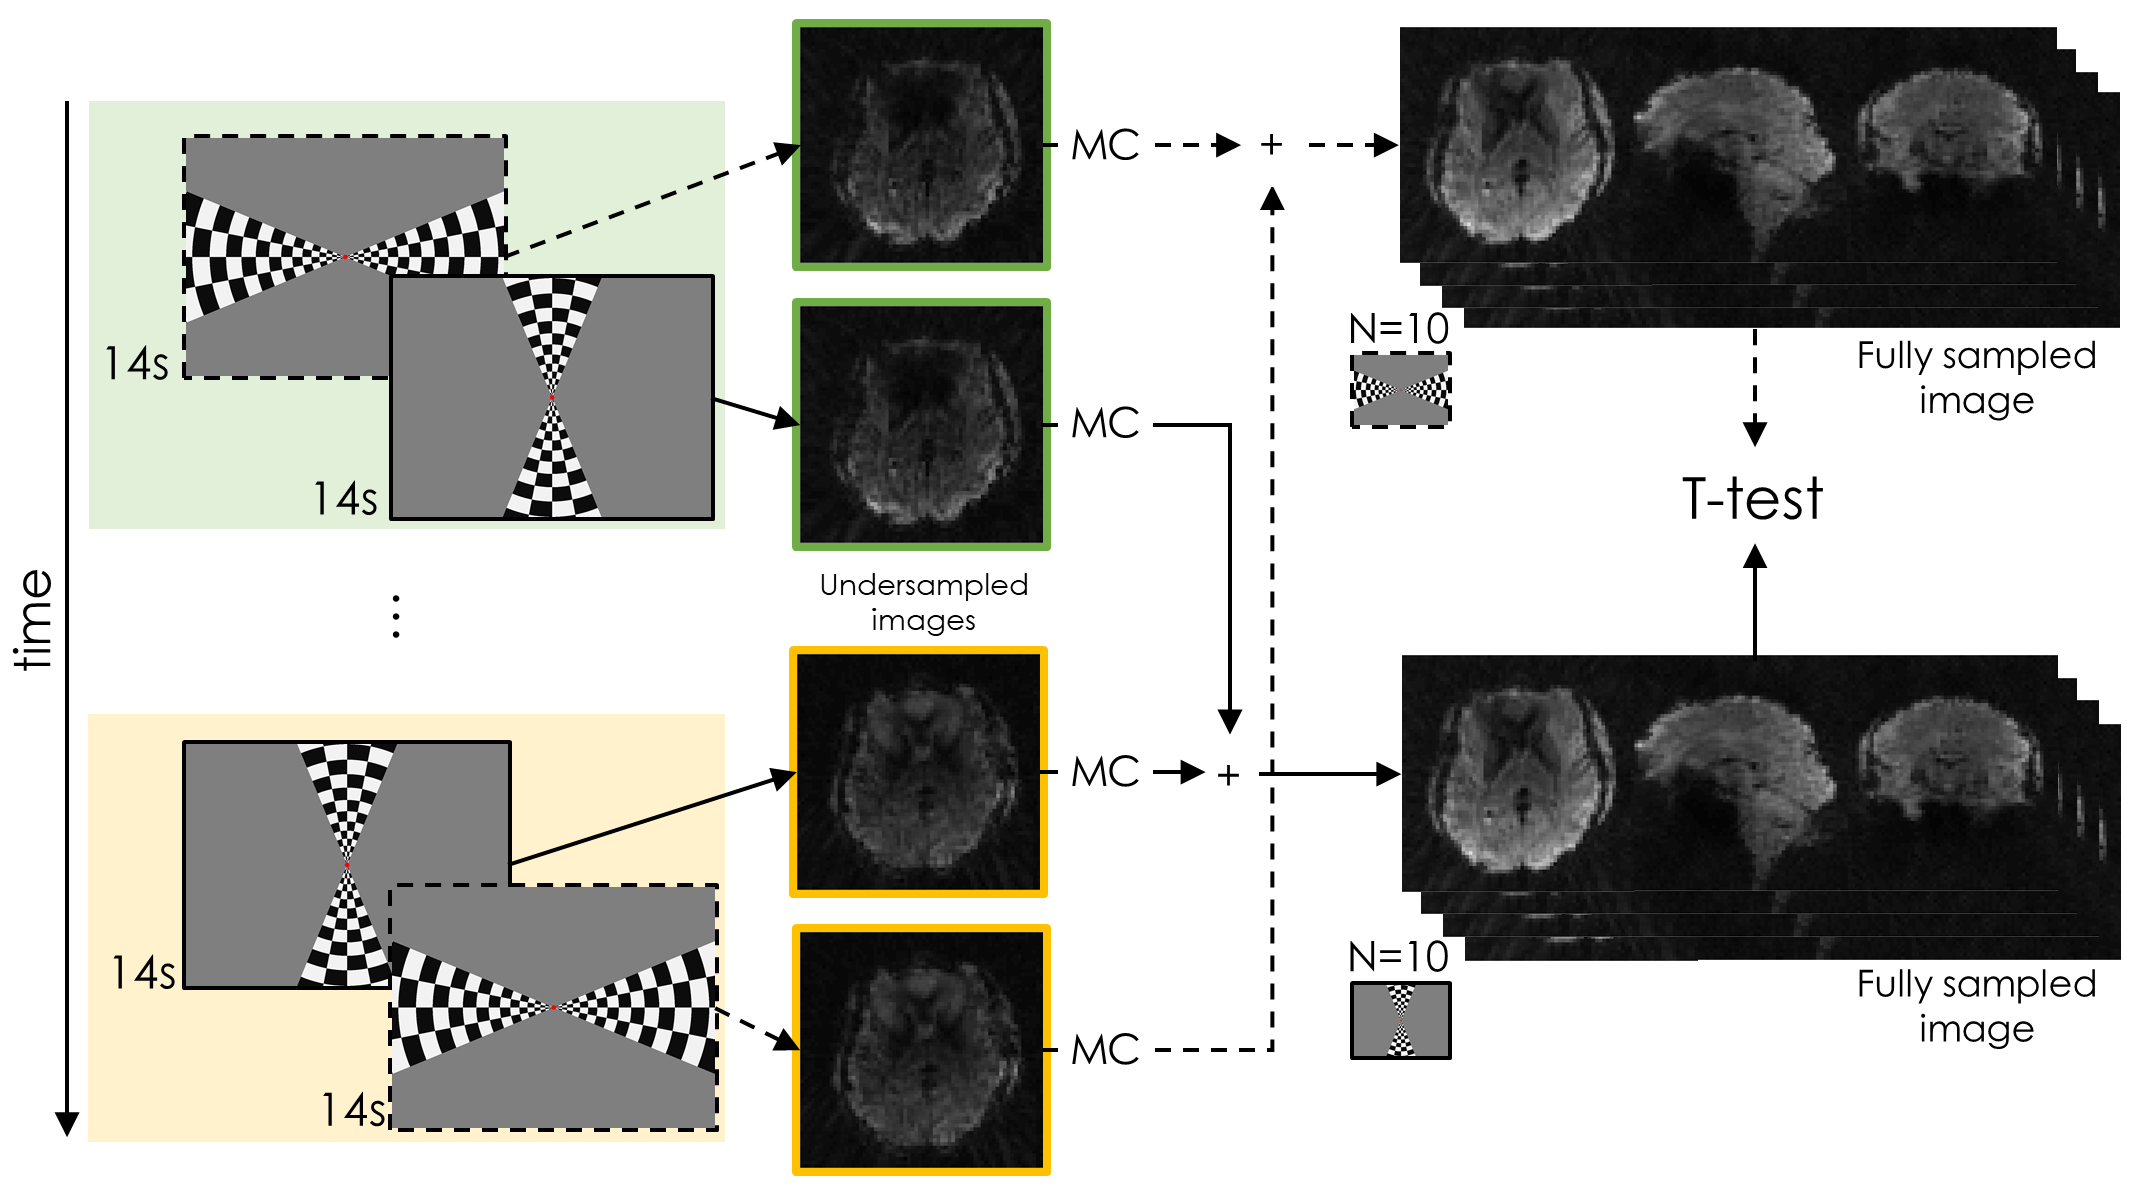
ZTE-BURST6 starts with a block of standard ZTE7 encoding multiple 3D radial k-space spokes followed by blocks with reversed direction and no RF excitation. The gradient trajectories of the first block are then repeated without RF excitation to collect the echo signal (Figure 1). Two healthy subjects with normal sight and hearing (a 30 years-old male for the visual experiment and a 36 years-old female for the auditory experiment) underwent an MRI session on a whole-body 7T MRI scanner (MR950, GE Healthcare) including a T1-weighted anatomical sequence and a train of 20 ZTE-BURST scans, each acquiring a volume with full-head coverage in 28s, with isotropic voxel size of 3mm, FA=3° and TE=0,11.1,22.2ms. fMRI analysis was performed on the third TE. Acquisitions during both visual and auditory stimulations were tested. Visual stimulation was conveyed via MR-compatible goggle set and consisted of black and white checkerboard patterns on a grey background, positioned either along the horizontal or vertical meridian. The two meridians appeared alternately for 14s each, in a pseudo-random order so that the vertical meridian was presented during the first half of the k-space sampling in half of the volumes and in the second half in the other volumes, and viceversa for the horizontal ones (Figure 2). Auditory stimulation followed a similar paradigm: the two alternating stimuli were jittered pure tones (75ms each) sampled from either a low-frequency band (125-355Hz) or a high-frequency band (2000-5680Hz), alternating in 14s blocks. Both for the auditory and visual stimulation experiment, two halves of the raw data of two volumes acquired with different stimulus order were reconstructed separately, obtaining undersampled images. These images were motion-corrected by applying the transformation matrix computed on the fully-sampled images and finally recombined via a complex sum in a single fully-sampled image with consistent stimulation (Figure 2). Contrast maps (i.e., Vertical-Horizontal meridian and Low-High frequencies) were obtained by computing a voxelwise paired t-test between the two groups of images (10 volumes per stimulus condition) and transformed into the MNI152 space. The same visual and acoustic stimulation paradigms, organized in alternating blocks of 14s, were delivered also during a conventional EPI acquisition (TR=2s, TE=22.2ms, voxel size=2mm iso, 147 volumes). These datasets underwent standard preprocessing and GLM analysis in AFNI8. Statistical maps for the auditory and visual contrasts of interest were obtained and transformed into the MNI152 space. To compare the two acquisition schemes we masked the obtained results using the anatomical definition9 of Heschl's gyrus and V1 for the auditory and visual experiment respectively. Moreover, for each experiment we quantified the similarity between the two sequences by correlating the pattern of activity obtained from the EPI-based and ZTE-BURST fMRI.Results
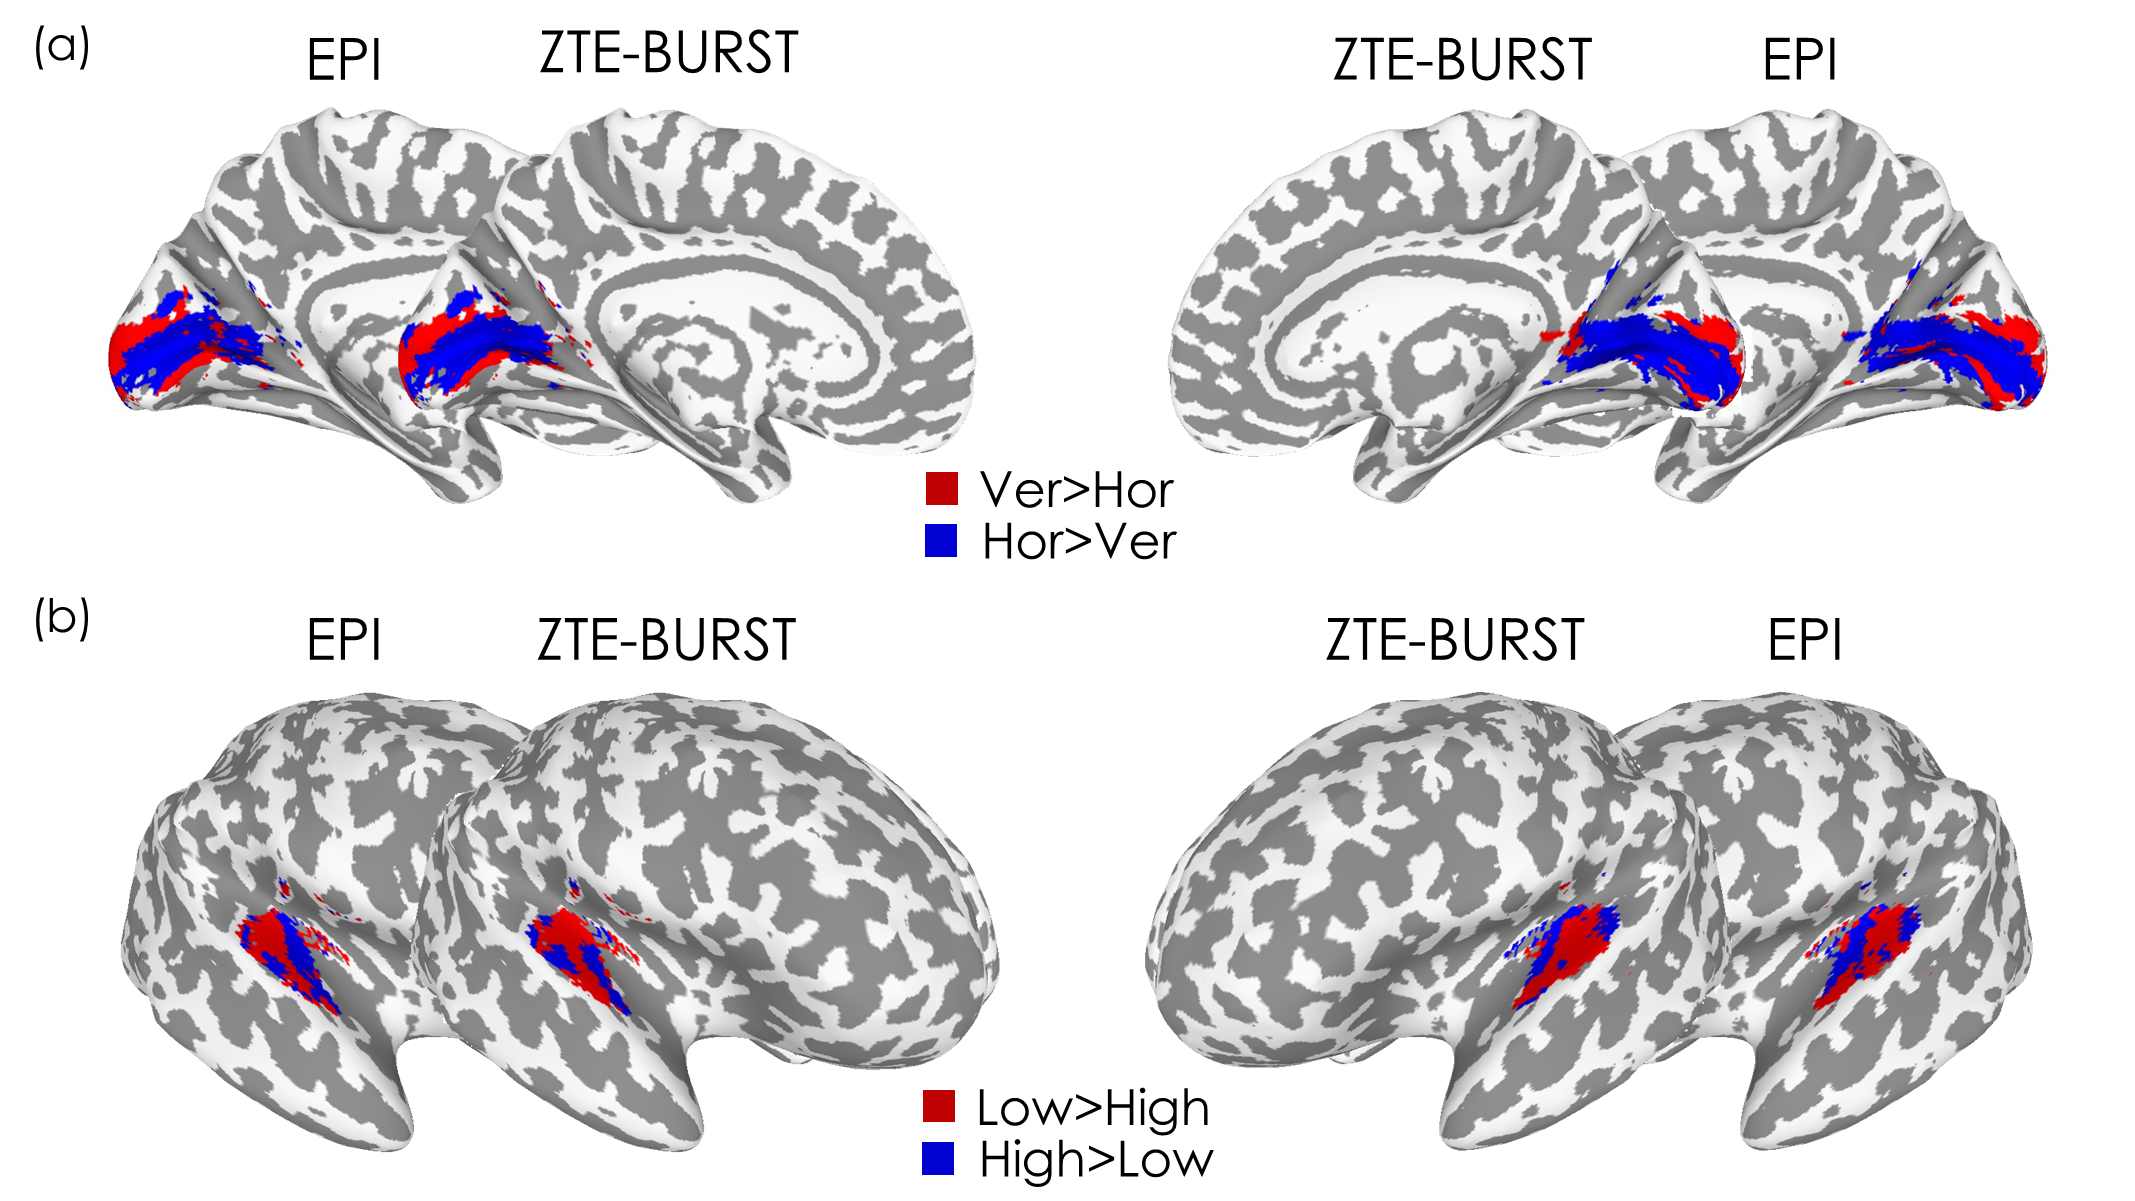
For both the visual and auditory experiments the ZTE-BURST activation maps closely resemble the ones obtained from the EPI acquisition (Figure 3). Specifically, for both sequences activations related to the vertical meridian are located in pericalcarine grey matter, whereas the horizontal meridian is mapped at the fundus of the calcarine sulcus (Figure 3a). Similarly, also the activation map obtained for acoustic stimulation shows the expected pattern of response (rostrocaudal high-low-high organization) in the Heschl's gyrus (Figure 3b). This high similarity is also testified by significant correlation between response patterns both in visual (r=0.73, p<0.001) and auditory (r=0.46, p<0.001) experiments.Discussion and conclusion
The ZTE-BURST acquisition sequence allowed the computation of activation maps compatible to those obtained via conventional EPI protocols, both with visual and acoustic stimulation. Compared to 2D EPI acquisition, ZTE-BURST appears more robust to geometrical distortion artifacts and achieves substantial reduction of ASN. The current main limitation is related to temporal resolution, which could be improved by future work optimizing sequence parameters for fMRI. Our preliminary results demonstrate that ZTE-BURST can be used for silent fMRI.Acknowledgements
No acknowledgement found.References
1. Moelker A, Pattynama PMT. Acoustic noise concerns in functional magnetic resonance imaging. Hum Brain Mapp. 2003;20(3):123-141.
2. Gaab N, Gabrieli JDE, Glover GH. Assessing the influence of scanner background noise on auditory processing. I. An fMRI study comparing three experimental designs with varying degrees of scanner noise. Hum Brain Mapp. 2007;28(8):703-720.
3. Gaab N, Gabrieli JDE, Glover GH. Assessing the influence of scanner background noise on auditory processing. II. An fMRI study comparing auditory processing in the absence and presence of recorded scanner noise using a sparse design. Hum Brain Mapp. 2007;28(8):721-732.
4. Andoh J, Ferreira M, Leppert IR, Matsushita R, Pike B, Zatorre RJ. How restful is it with all that noise? Comparison of Interleaved silent steady state (ISSS) and conventional imaging in resting-state fMRI. Neuroimage. 2017;147:726-735.
5. Czisch M, Wehrle R, Kaufmann C, Wetter TC, Holsboer F, Pollmacher T, Auer DP. Functional MRI during sleep: BOLD signal decreases and their electrophysiological correlates. Eur J Neurosci. 2004;20(2):566-574.
6. Schulte RF, Buonincontri G, Costagli M, Menini A, Wiesinger F, Solana AB. Silent T2* and T2 encoding using ZTE combined with BURST. Magn Reson Med. November 2018.
7. Grodzki DM, Jakob PM, Heismann B. Ultrashort echo time imaging using pointwise encoding time reduction with radial acquisition (PETRA). Magn Reson Med. 2012;67(2):510-518.
8. Cox RW. AFNI: Software for Analysis and Visualization of Functional Magnetic Resonance Neuroimages. Comput Biomed Res. 1996;29(3):162-173.
9. Eickhoff SB, Stephan KE, Mohlberg H, Grefkes C, Fink GR, Amunts K, Zilles K. A new SPM toolbox for combining probabilistic cytoarchitectonic maps and functional imaging data. 2005.
Figures