3943
EPI based MR thermometry and real-time monitoring for parallel RF transmission at 7TGuoxiang Liu1, Adnan Shah1, Takashi Ueguchi1, R. Allen Waggoner1,2, Shubham Gupta1,2, and Keiji Tanaka2
1NICT, Suita-shi,Osaka, Japan, 2RIKEN Center for Brain Science, Wako, Japan
Synopsis
A novel method for MR thermometery and real-time temperature monitoring is developed. Using the change in phase for fat between first and third navigator lines of EPI, the proposed method allows estimating the change in phase for water caused by the change in base frequency at echo time of EPI. Scanning a fat bag placed beside a phantom in different slices allow image reconstruction from the calculated phase difference. The proposed method does not require separate scans for fat and water allowing an effective monitoring of in vivo SAR for ensuring the safety of experimental subjects especially in parallel-transmit systems.
Introduction:
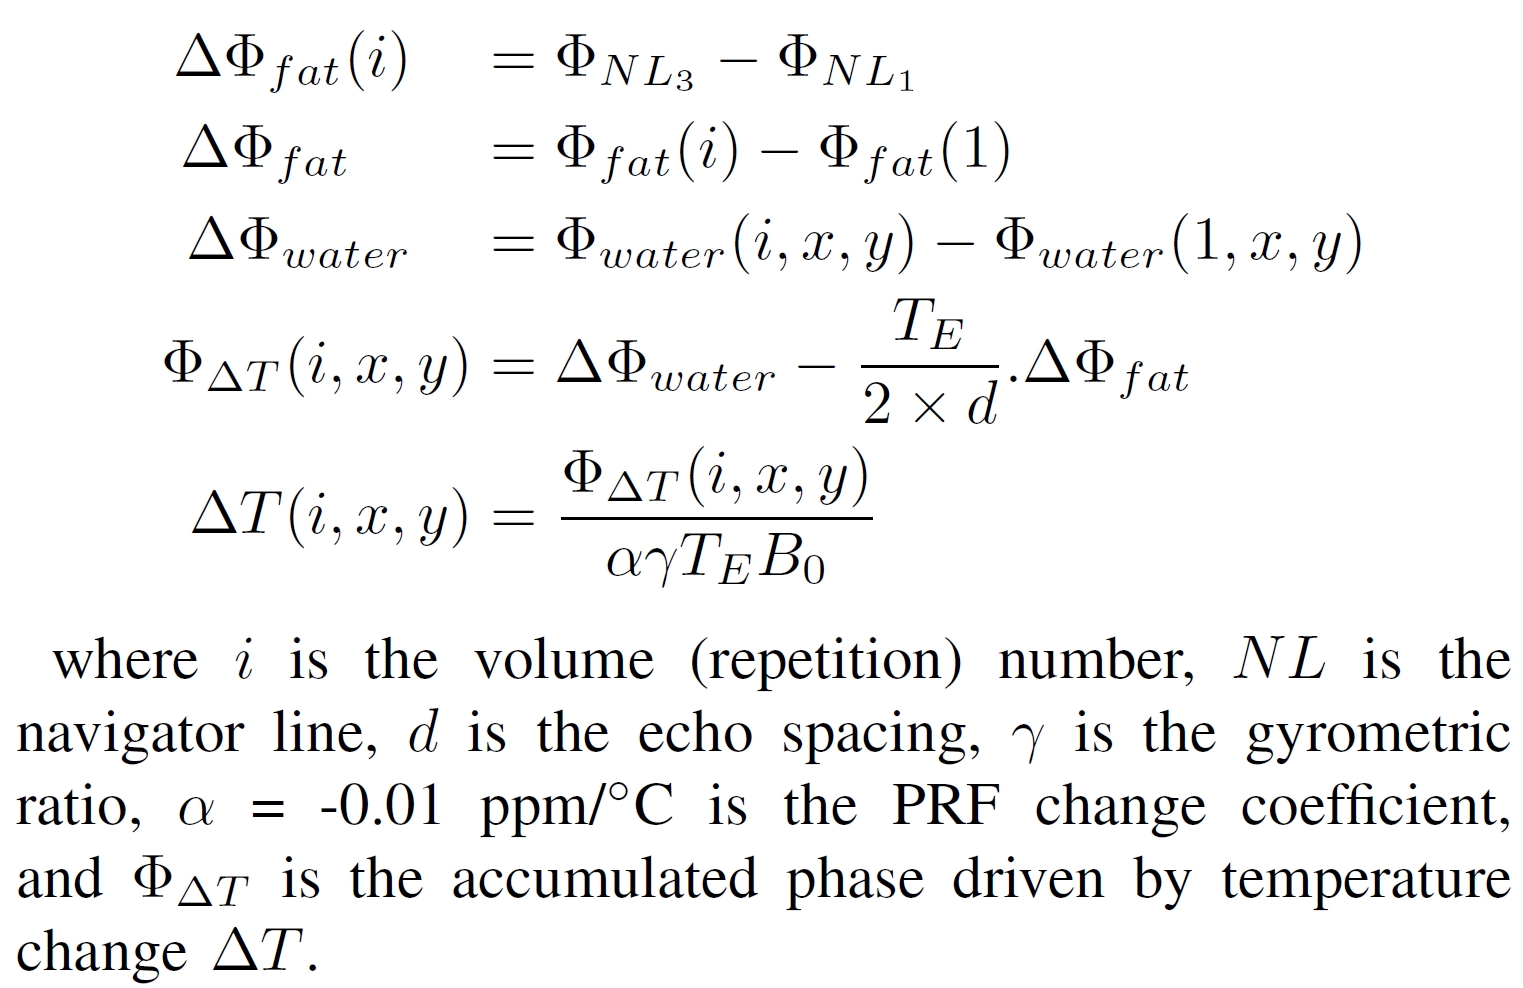
A novel method for MR thermometry [1, 2] has been developed allowing simultaneous acquisition of the fat and water phase images. Using the change in phase for fat between the first and third navigator lines of EPI, the proposed method allows estimating the change in phase for water caused by a temperature dependent chemical shift change. Scanning a fat bag placed beside the phantom in different slices allows image reconstruction from the calculated phase difference. The fat phase difference is caused by proton resonance frequency (PRF) shift, including the machine instability but not related to the change in temperature inside a phantom or brain. The proposed method allows monitoring the temperature change in real-time as well as generating temperature maps offline. The proposed method does not require separate scans for fat and water allowing an effective monitoring of in vivo specific absorption rate (SAR) for ensuring the safety of experimental subjects especially in parallel-transmit (pTx) systems.Materials & Methods:
A customized phantom fitting an 8-Tx/8-Rx channel head-array RF coil (RAPID Biomedical, Rimpar, Germany) compatible with Siemens MAGNETOM 7T MRI scanner was used. The phantom was built from three identical small cylinders placed off-centre symmetrically inside a large circular cylinder with aligned axis of rotation. The large cylinder was filled with an agar gel (44.8 mM NaCl; 4.76 mM NiSO4) surrounding the small cylinders which were filled with pure animal fat purchased from nearby local food shop. In addition, a fat bag was prepared for placement at out of the normal slice position for scanning. The phantom was cooled down in the refrigerator to approximately 5 oC and the experiment was performed after ~6 hours when the phantom was still adjusting to MRI room temperature (23 oC). Three MRI safe fiber optic temperature sensors were placed in the agar gel at different locations for monitoring the temperature rise in real-time during scanning. These sensors measured 19.3 oC, 15.95 oC, and 16.85 oC at the start of MRI scan. For image-based validation, phase changes in voxels near the tips of the sensors were taken relative to the average of the fat slices scanned from the fat bag placed alongside as a reference. We obtained 2D multi-shot EPI data (# shots = 4, TR = 3000 ms, TE = 11.2 ms, FATSAT = ON, FA = 20o ) composed of 200 volumes at a spatial resolution of 3x3x3 mm3. Phase change in fat (obtained from the fat bag) and agar gel measurements were smoothed with a moving average window of size = 10 time-points prior to calculating the change in temperature (ΔT). By using the navigator lines of normal EPI, it is possible to measure the phase-change in fat and agar gel (representing brain tissue) simultaneously. We used the phase difference between first and third EPI navigator lines in the fat only slices to estimate the phase-change in water caused by base frequency changing at the EPI echo time. The proposed sequence does not require scanning water and fat separately in-vivo as a fat bag can easily be placed outside the desired slice positions.Results and Discussion:
Figure 1 (top) shows MR temperature maps in phantom slices based on proposed EPI sequence with Fat-Sat pulse turned ON where the pure fat in the small cylinders are not visible as one would expect in a normal fMRI experiment. Though we observe that the fat is suppressed in EPI, we still have enough fat-phase information from the scanned fat slices to calculate ΔT. Moreover, the fat inside the small cylinders are visible in the image slices based on gradient echo (GRE) sequence with resolution 0.4x0.4x3 mm3, where the temperature sensors are also clearly seen at three different locations. Figure 2 shows the temperature change detected at the tip of sensors inserted in the phantom at these locations. Figure 3 shows the corresponding image-based calculation of temperature change. The proposed method offers a novel way of monitoring temperature change in real-time in-vivo allowing a pTx system to stop the scan when local temperature change is too high. The phase change in water relative to fat is detrimental for measuring change in temperature, however, the requirement of separate scans for measuring each of these parameters is a limiting factor in real-time monitoring, a safety requirement for pTx system. The proposed method excludes the need for imaging fat separately by utilizing navigator lines of normal EPI to detect the changes in fat-phase. The proposed method can be an effective tool for pTx MRI forcing the system to stop the scan when local temperature change exceeds safety threshold.Acknowledgements
This study was supported in part by Japan Society for the Promotion of Science (JSPS) Grants-in-Aid for Scientific Research “KAKENHI” (Grant Numbers JP26282223 and JP26350471) and by AMED under Grant Number JP18dm0207001 and by JSPS KAKENHI Grant Number JP16H06564.References
[1] Ishihara Y, Calderon A, Watanabe H, et al. A precise and fast temperature mapping using water proton chemical shift. Magn Reson Med. 1995 Dec;34(6):814-23. [2] Streicher MN, Schäfer A, Ivanov D, et al. Fast accurate MR thermometry using phase referenced asymmetric spin-echo EPI at high field. Magn Reson Med. 2014 Feb;71(2):524-33.Figures
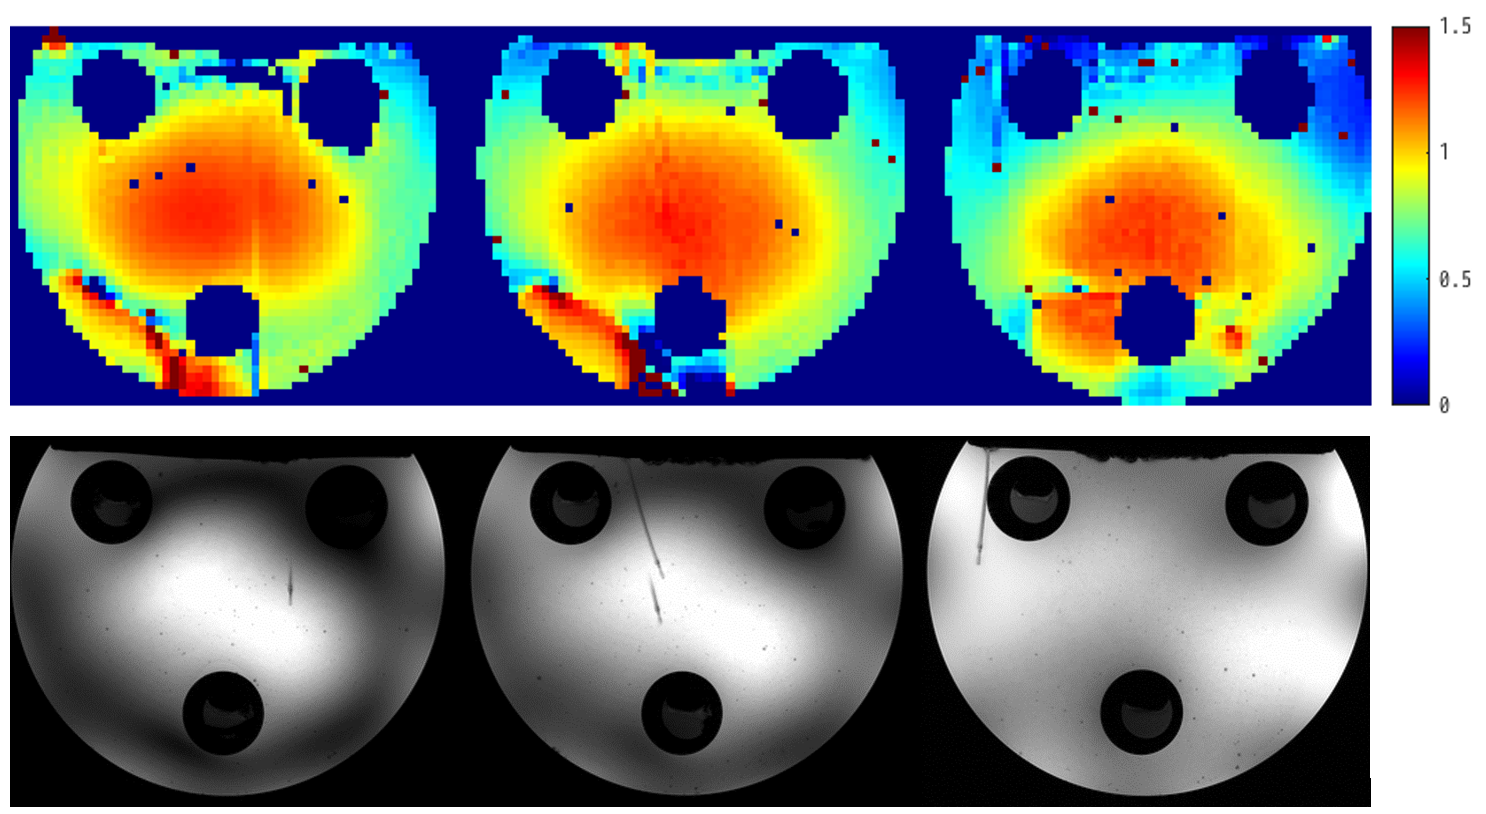
Top row shows MR temperature maps in phantom-slices
based on EPI with Fat-Sat pulse ON. Bottom row shows corresponding image slices
based on GRE sequence with Fat-Sat pulse OFF. Temperature sensors placed in agar gel at different locations
are visible in these images at the bottom.
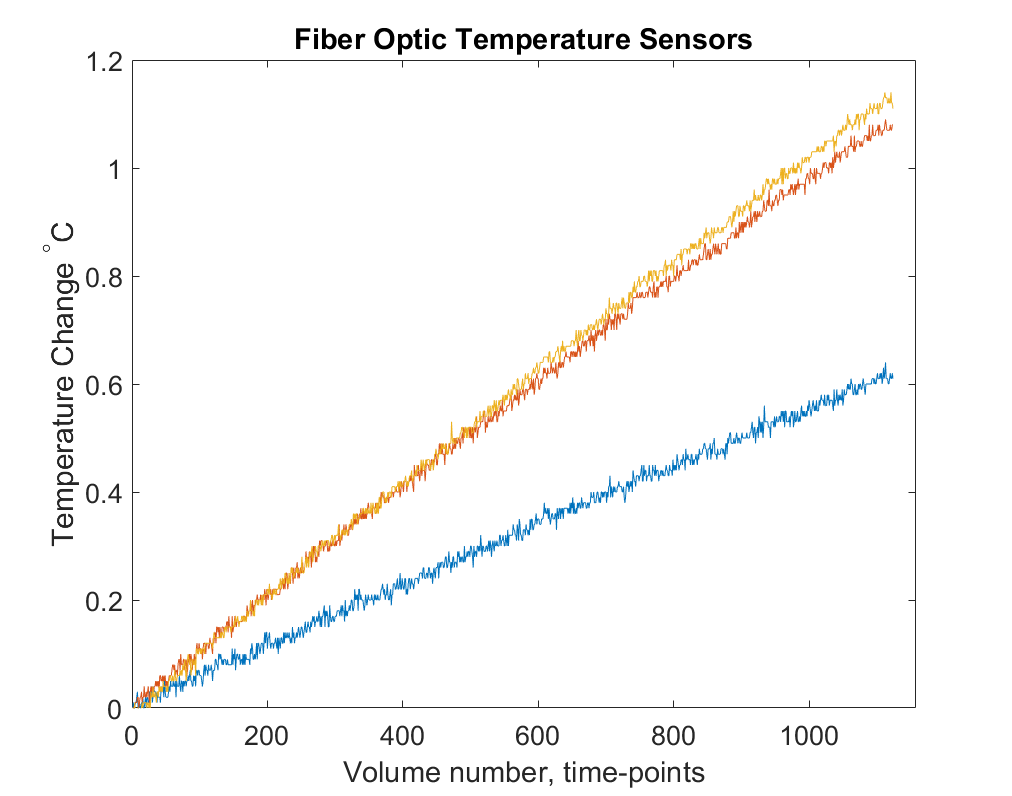
Temperature
rise detected at the tip of fiber optic sensors visible in images acquired with GRE sequence shown above.
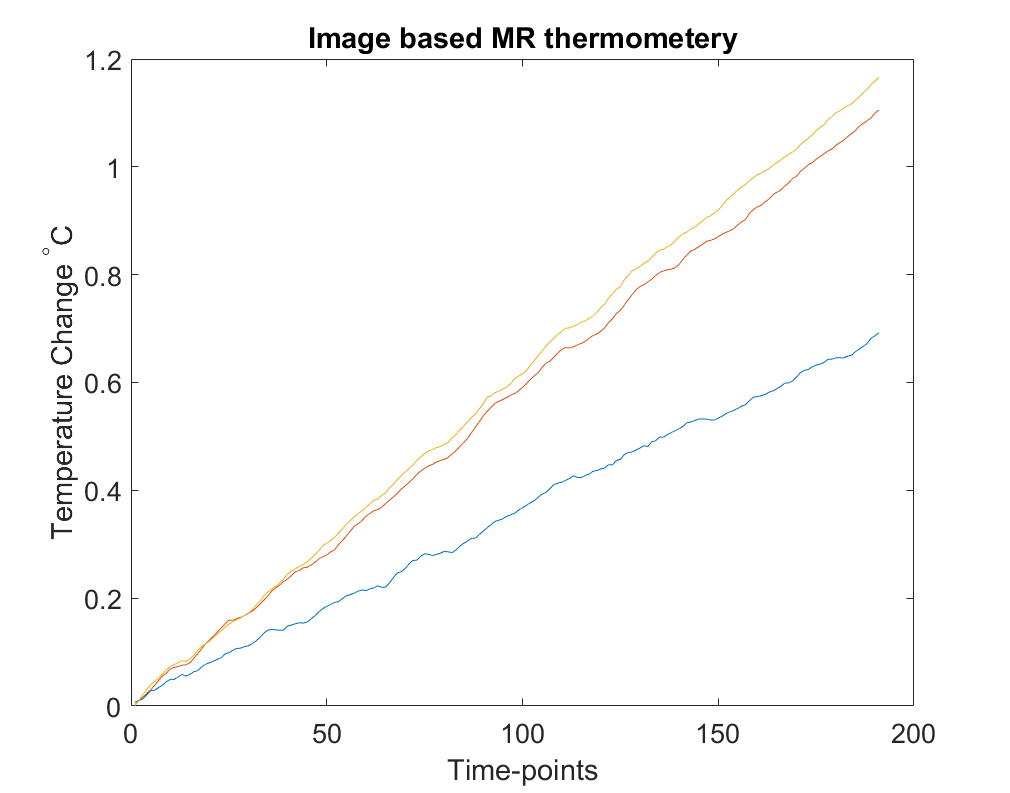
Temperature change calculated from voxels nearest to temperature sensors
placed at different locations in the phantom shown above in the slice images
obtained with GRE sequence.
Procedure