3942
Which multiband factor should you choose for your resting-state fMRI study?1Biostatistics and Bioinformatics, Emory University Rollins School of Public Health, Atlanta, GA, United States, 2Radiology and Imaging Sciences, Emory University School of Medicine, Atlanta, GA, United States, 3Joint Department of Biomedical Engineering, Emory University and Georgia Institute of Technology, Atlanta, GA, United States
Synopsis
Multiband / simultaneous multislice increases the temporal resolution in resting-state fMRI but at the cost of noise amplification, which may result in erroneous estimates of correlation-coefficient based functional connectivity. We examined functional connectivity in resting-state scans from ten subjects with multiband factors ranging from two to twelve. The standard deviation of voxel time series varies across space, which is in part due to noise amplification. Multiband acceleration tends to decrease estimates of functional connectivity, particularly for correlations involving subcortical regions. Consequently, it may be challenging to disentangle low neural activity from high noise amplification.
Introduction
Thalamic and subcortical functional connectivity have been found to be useful biomarkers in many neurological diseases.1,2 Multiband (MB) / simultaneous multislice (SMS) is typically used to improve temporal resolution in resting-state fMRI (rs-fMRI), with an MB factor of 8 being a popular choice.3 MB can however cause noise amplification, such that the benefits of decreased TR may be reduced by an increase in measurement error. The trade-off between more measurements and higher noise per measurement is highly spatially variable as determined by the g-factor. In task fMRI, MB 4 to 8 was recommended for most studies while MB 2 for studies on anterior midline regions.4 Subcortical regions such as the thalamus might suffer from markedly larger noise amplification compared to the cortical regions. However, the effects of MB factor on functional connectivity, particularly in subcortical regions, have not been systematically studied.
In this work, we examine the impacts of MB on functional connectivity with a focus on subcortical regions. Let xt and yt denote two nodes at time t. Then corr(xt,yt) = cov(xt,yt)/(sd(xt)sd(yt)). In noise-amplification dominated nodes, we hypothesize that cov(xt,yt) is constant or decreasing while sd(xt)sd(yt) is increasing; consequently, correlation decreases.
Non-uniform decreases in correlation are of interest because 1) the magnitudes of correlations are interpreted as the strength of functional connectivity, and spatially varying impacts may lead to mischaracterizations of brain activity; and 2) smaller correlations can decrease statistical power unless sufficiently offset by increases in precision due to the larger number of time points (accounting for serial correlation).
Methods
MR scans were performed on a Siemens Prisma 3T scanner using a 32-channel head coil. Nine resting-state fMRIs, each lasting for 6 minutes, were collected on ten healthy subjects (5 females) ages 19-29 using either a standard EPI sequence or a multiband EPI sequence from CMRR: 1) standard 3.3 mm isotropic (TR = 3 s); 2) 2 mm isotropic single-band (SB) (TR = 5.7 s); 3) 2 mm isotropic with MB factors of 2, 3, 4, 6, 8, 9, and 12. TE was set to 32 ms for all scans, with TR the minimal TR allowed for the respective MB factors and flip angle set to the respective Ernst angle. All images were rigid-body aligned to the single-band reference image, distortion corrected using FSL’s topup with a PA acquisition, slice time corrected, non-linear registration to MNI space with the T1 image, 2 mm FWHM smoothing, no temporal filtering, linear+quadratic detrending, nuisance regression using global, CSF, and white matter signals and 6 parameters from motion correction.
264 nodes were created using 10 mm spheres centered at the MNI coordinates from the Power atlas.5 Voxel-wise time courses were averaged for each ROI and then correlations between regions were calculated. We also averaged correlations for edges belonging to subcortical, sensory/motor, and default mode communities.5
Results
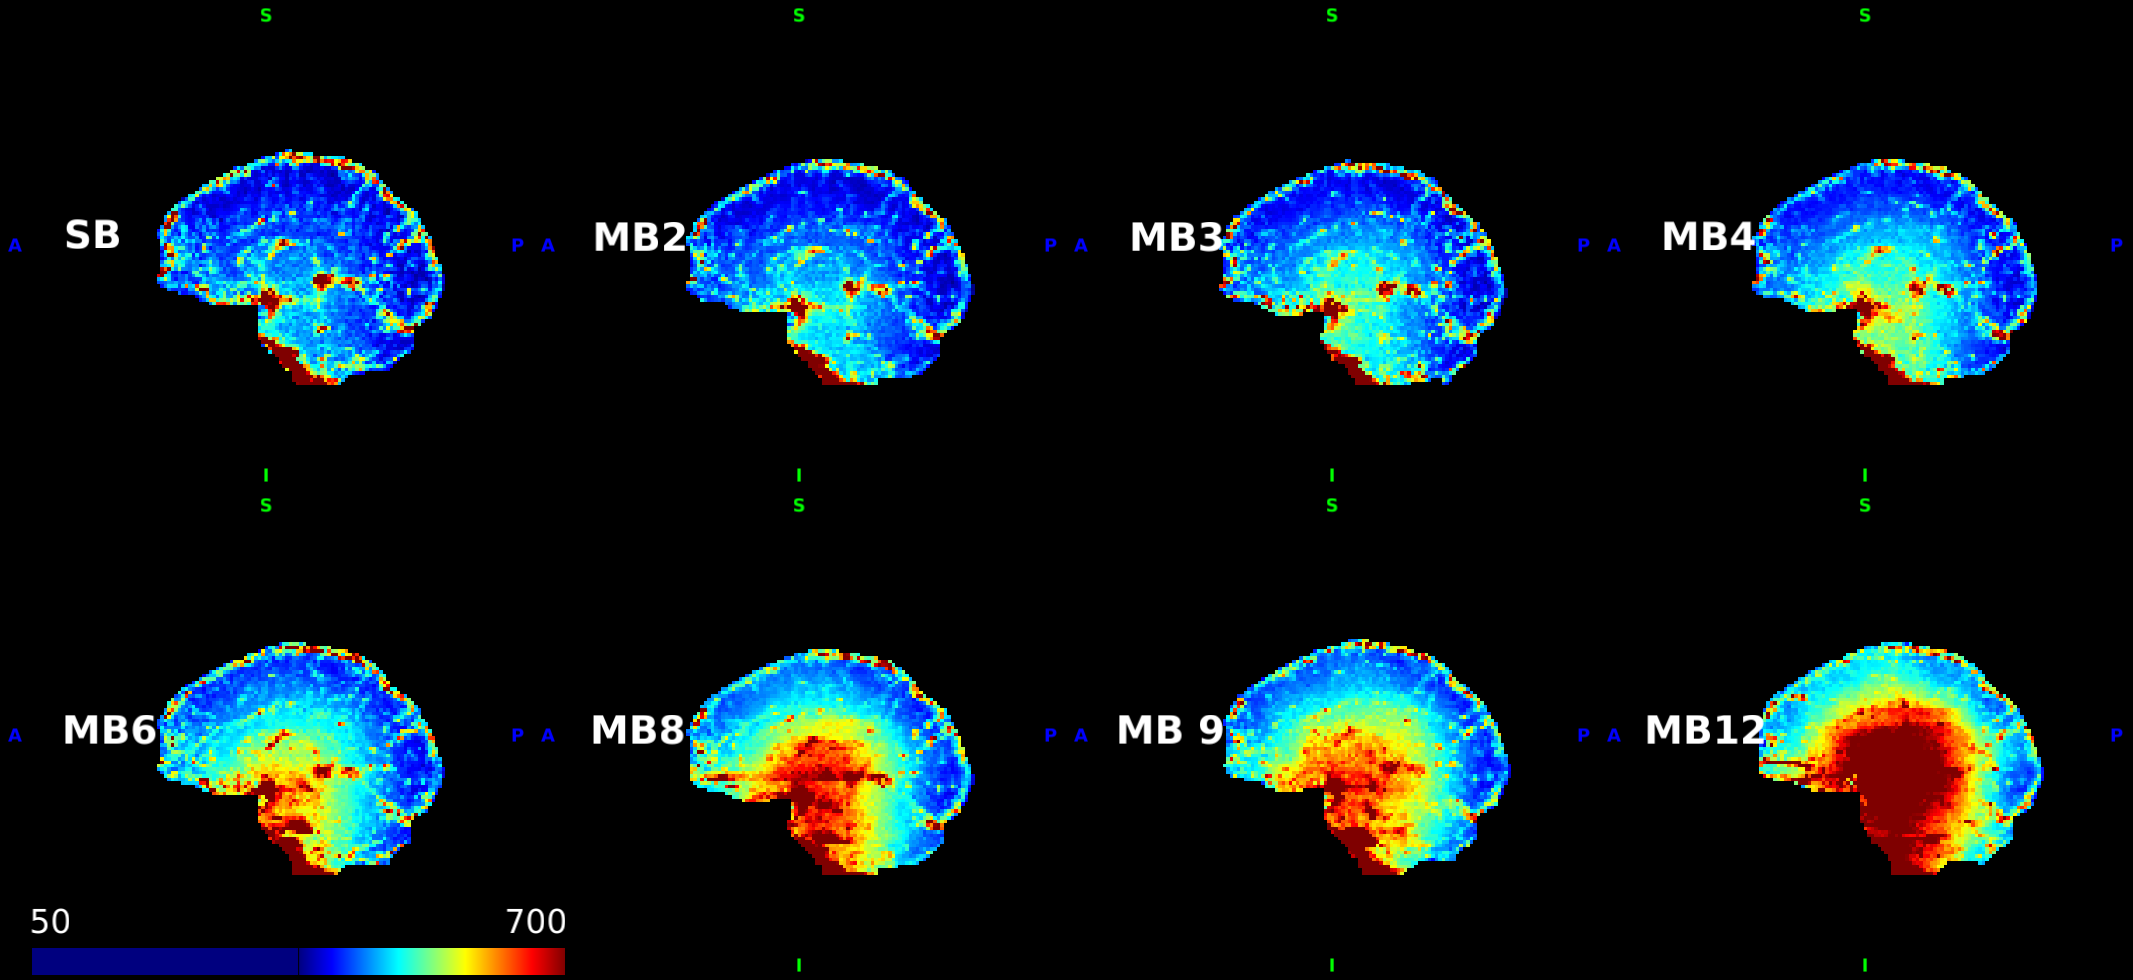
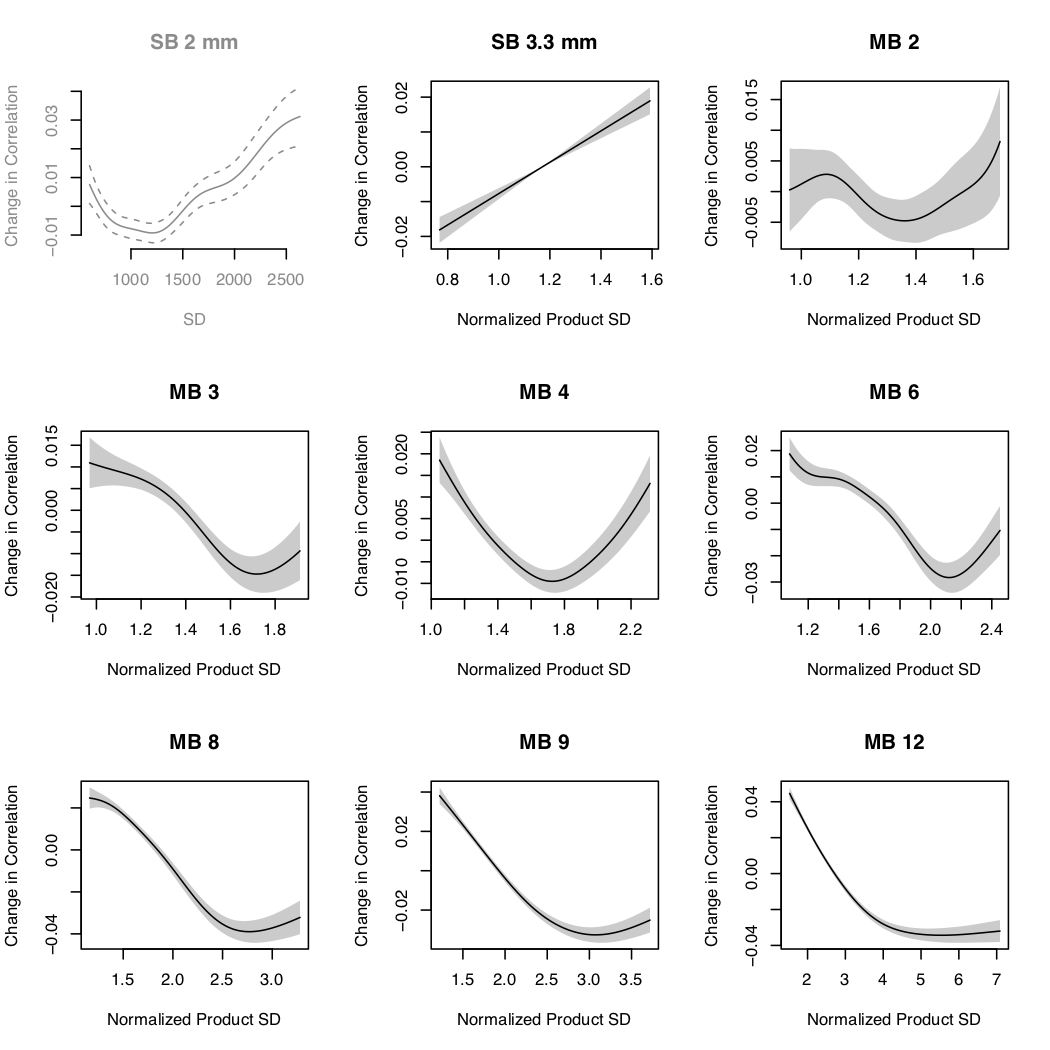
The standard deviation (SD) of voxel time series varies spatially and increases with MB factor (Figure 1). At high MB factors, correlation generally decreases as the normalized product of the SDs of the nodes composing the edge increases (Figure 2).
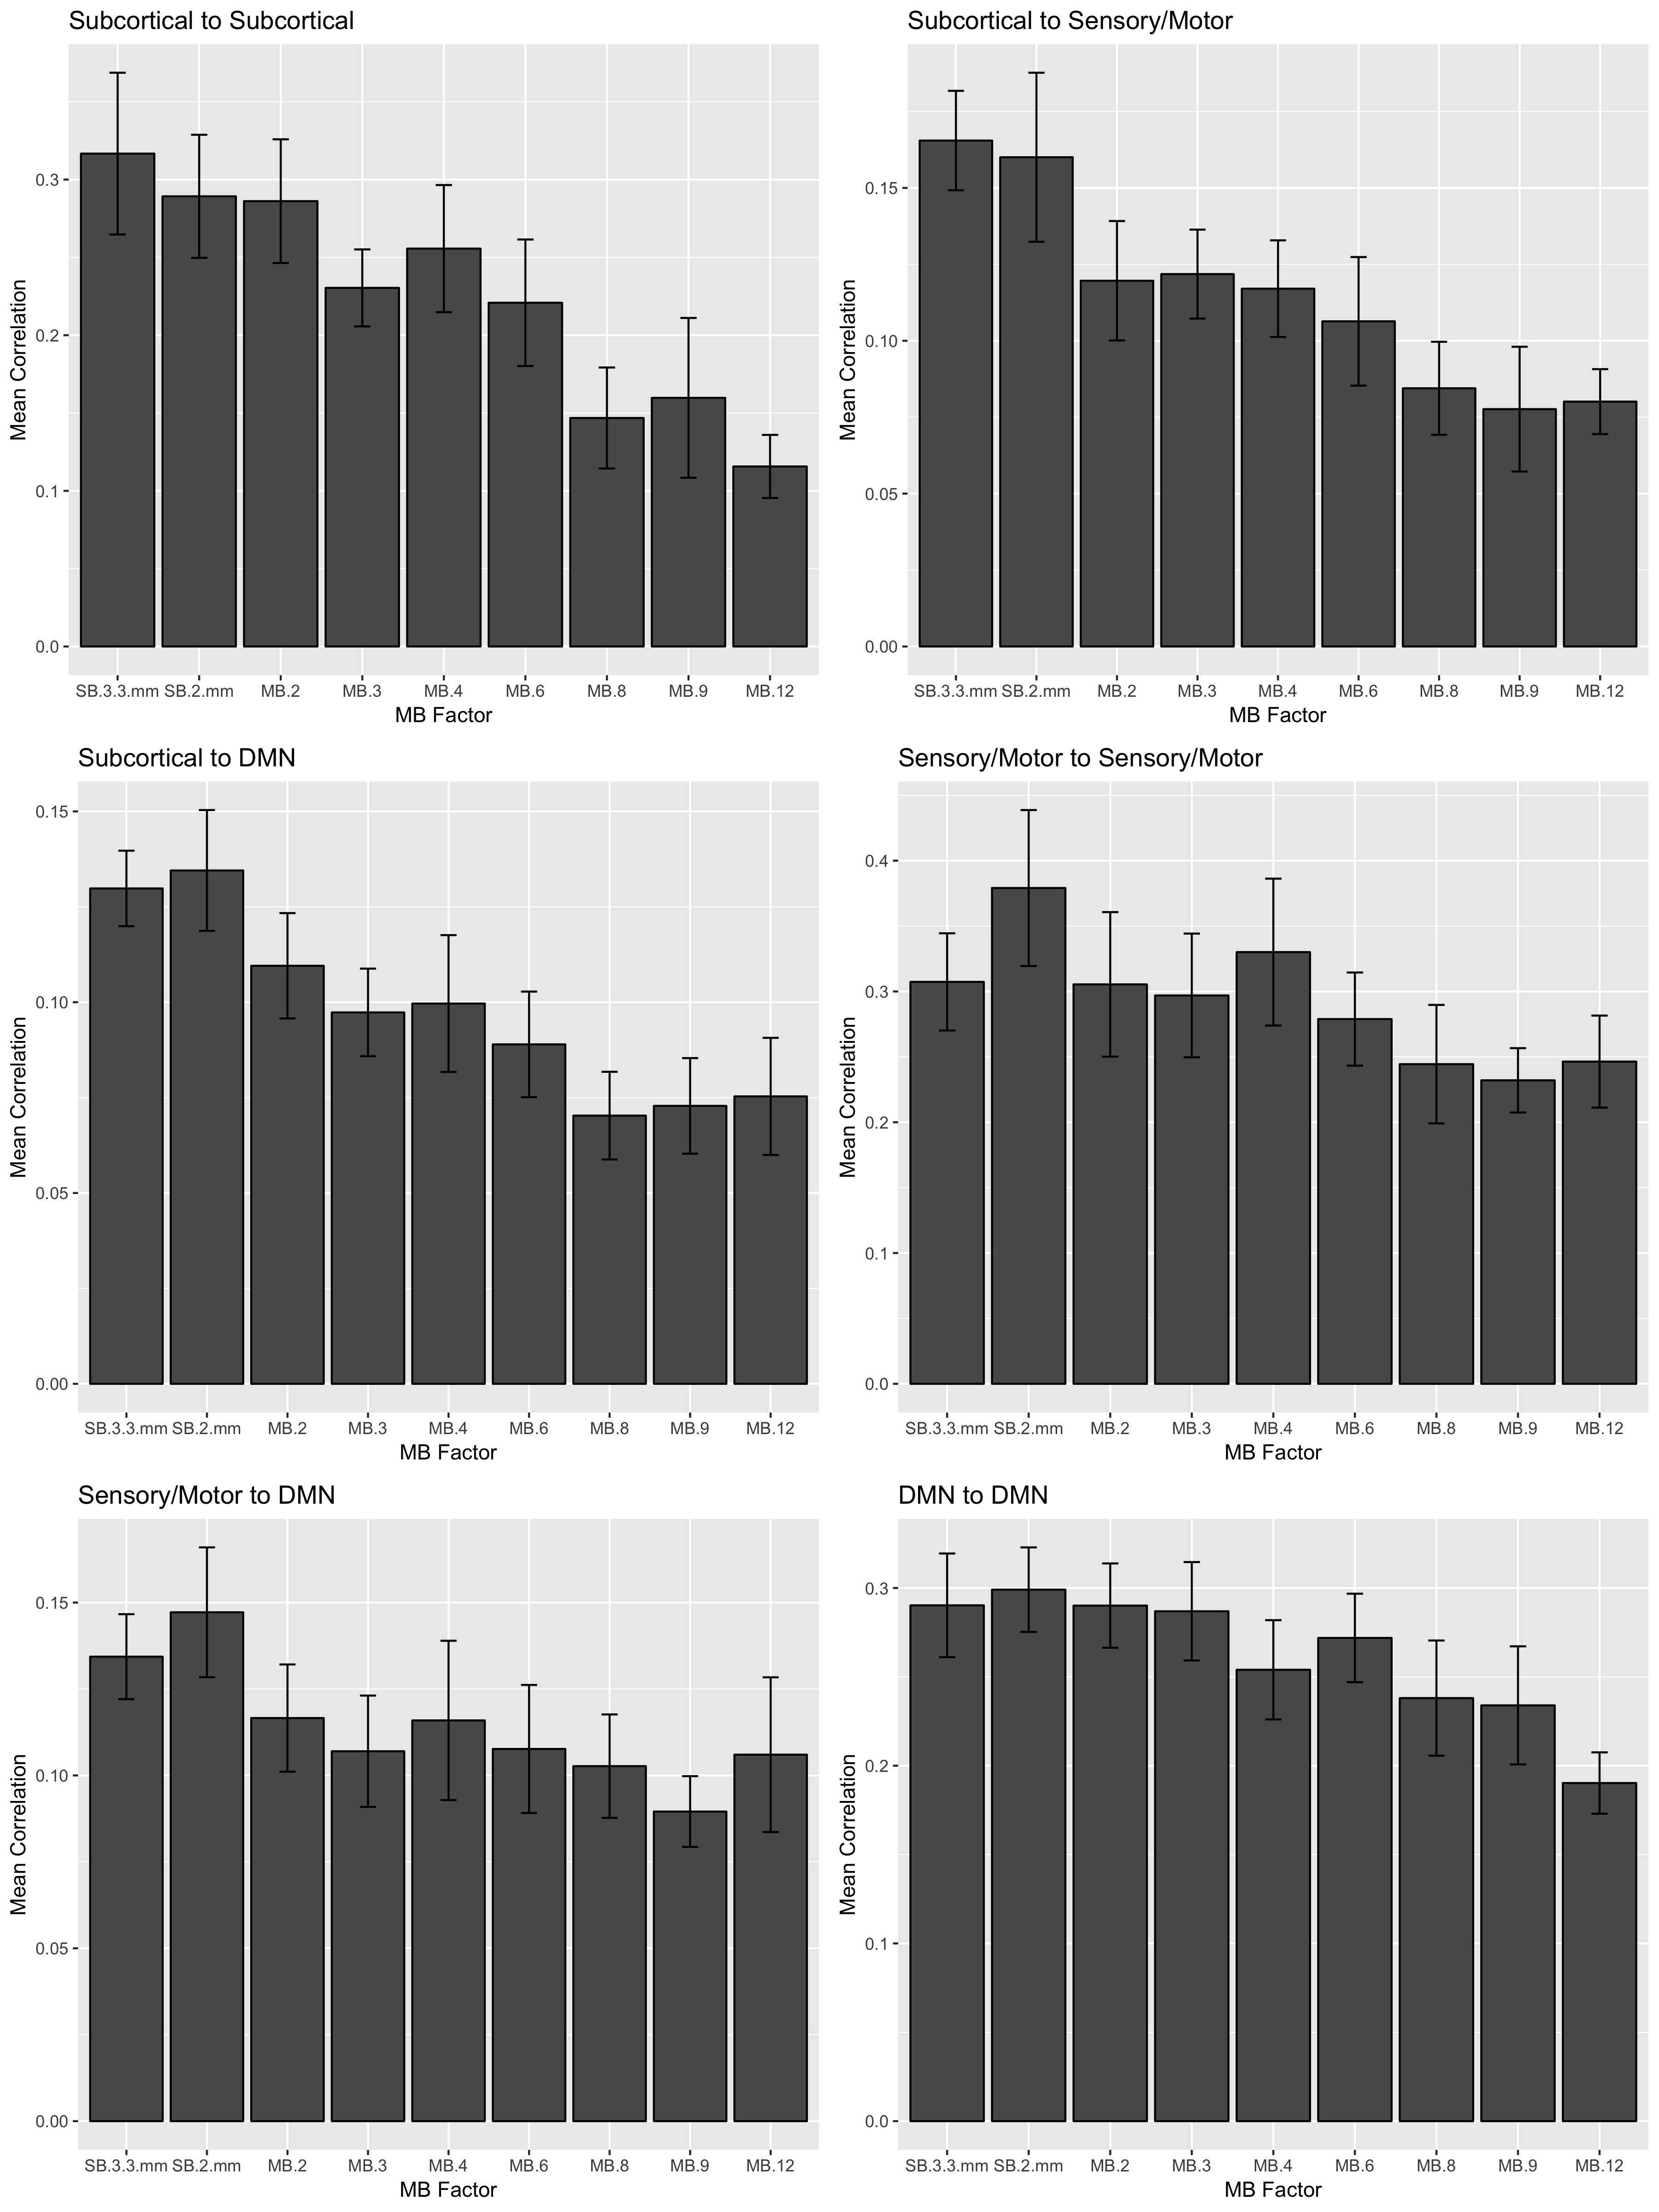
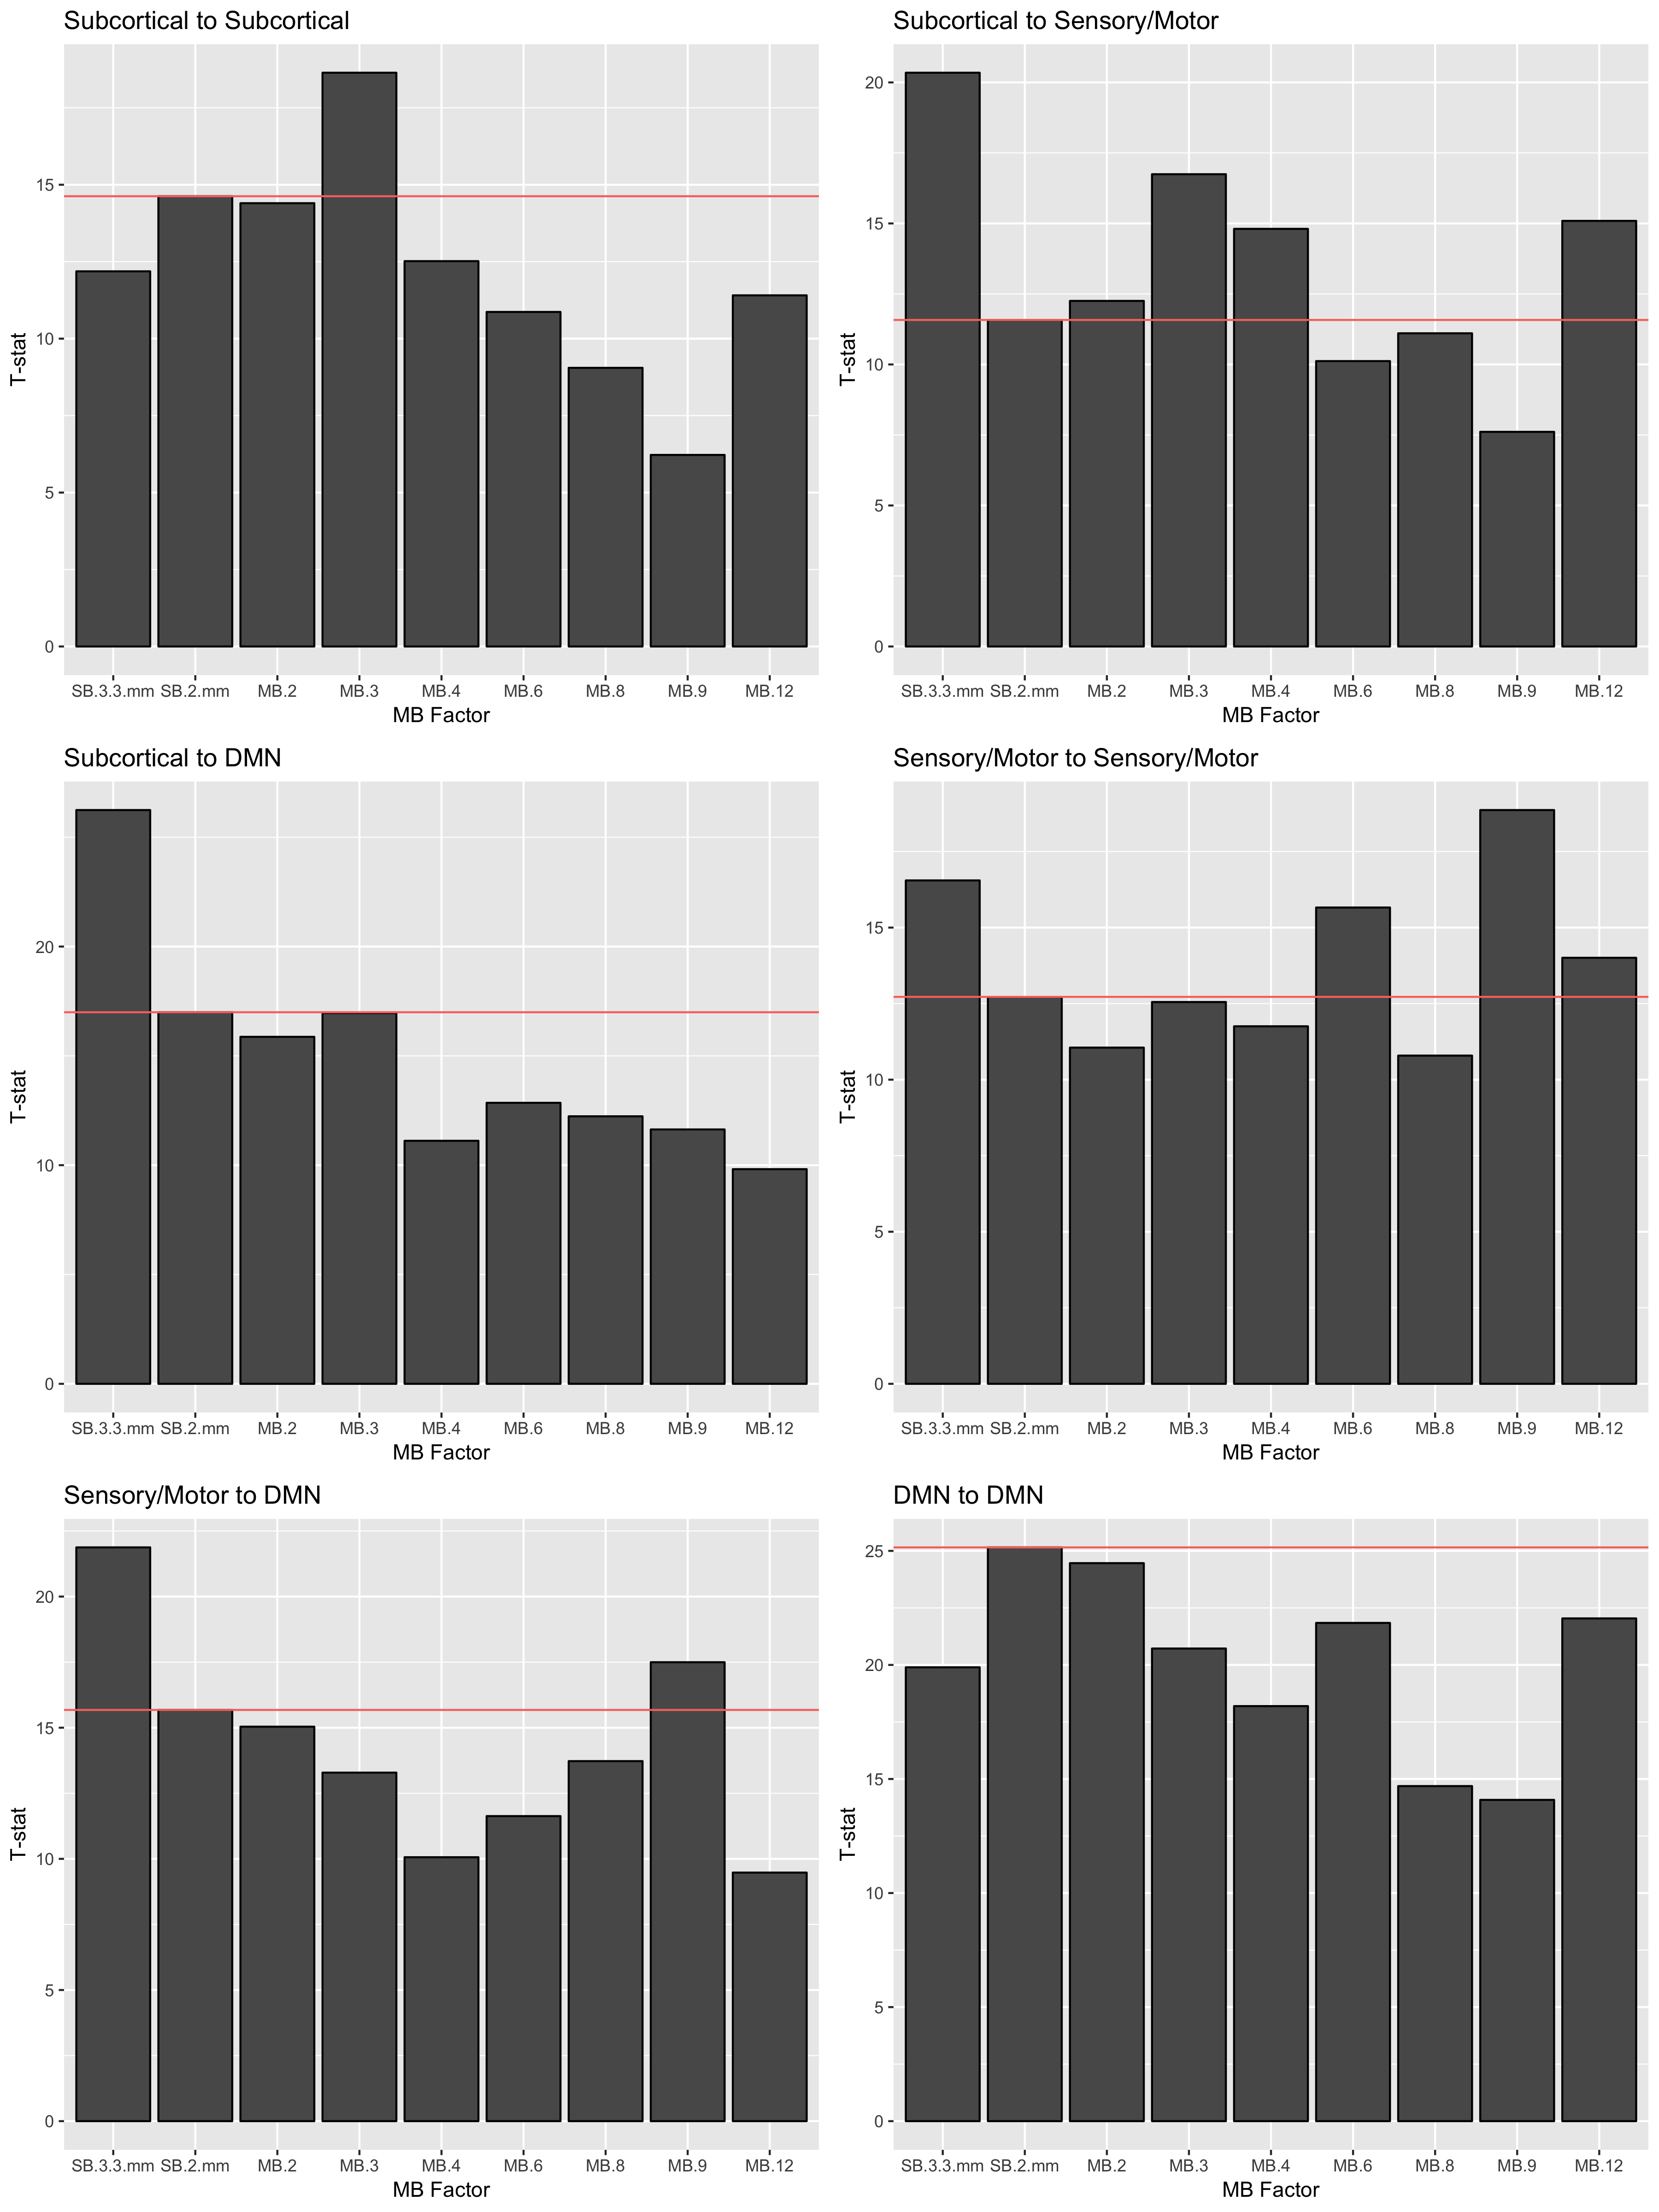
There were notable decreases in correlation with higher MB factor in edges containing subcortical nodes (Figure 3), decreasing approximately 50% in MB 8 versus SB 2 mm. To achieve a gain in statistical power, the percentage decrease in standard error must be greater than the percentage decrease in correlation, which we can visualize by examining the t-statistics for the null hypothesis that the population correlation equals zero (Figure 4). For some MB factors, the maximum t-statistic occurred at an MB factor with lower correlation than SB 2 mm (e.g., subcortical-sensory/motor at MB=3; sensory/motor-DMN at MB=9). This suggests the benefits of increased precision in the subject-specific correlations outweighed the costs due to noise amplification. Note the t-statistics are based on ten subjects and may be imprecise due to limited sample size.
Discussion
Higher multiband factors tend to decrease estimates of functional connectivity, particularly in edges containing subcortical nodes. The spatially varying decrease in correlations could lead to a mischaracterization of brain activity. In this study, we applied conservative noise removal without temporal filtering or ICA artifact removal. The ability to separate physiological noise confounds via ICA or filtering is improved at higher MB factors3,4,6 and will impact an assessment of the costs and benefits.Conclusion
The optimal MB factor in a resting-state fMRI study depends on the regions of interest and should be considered during the design of the study.Acknowledgements
This study was funded by the Center for Systems Imaging at the Emory University School of Medicine.References
1. Barron, D. S. et al. Thalamic functional connectivity predicts seizure laterality in individual TLE patients: Application of a biomarker development strategy. NeuroImage Clin. (2015).
2. Kim, K. et al. Reduced orbitofrontal-thalamic functional connectivity related to suicidal ideation in patients with major depressive disorder. Sci. Rep. 7, 15772 (2017).
3. Smith, S. M. et al. Resting-state fMRI in the Human Connectome Project. Neuroimage 80, 144–168 (2013).
4. Todd, N. et al. Functional sensitivity of 2D simultaneous multi-slice echo-planar imaging: effects of acceleration on g-factor and physiological noise. Front. Neurosci. 11, (2017).
5. Power, J. D. et al. Functional network organization of the human brain. Neuron 72, 665–678 (2011).
6. Jahanian, H. et al. Advantages of Short Repetition Time Resting-State Functional MRI Enabled by Simultaneous Multi-slice Imaging. J. Neurosci. Methods (2018).
Figures