3939
Inter-site repeatability of motor-visual task fMRI responses at 7 Tesla1Cardiff University Brain Research Imaging Centre, School of Psychology, Cardiff University, Cardiff, United Kingdom, 2Sir Peter Mansfield Imaging Centre, School of Physics and Astronomy, University of Nottingham, Nottingham, United Kingdom, 3Wellcome Centre for Integrative Neuroimaging, FMRIB, Nuffield Department of Clinical Neurosciences, University of Oxford, Oxford, United Kingdom, 4Wolfson Brain Imaging Centre, Department of Clinical Neurosciences, University of Cambridge, Cambridge, United Kingdom, 5Imaging Centre of Excellence, University of Glasgow, Glasgow, United Kingdom
Synopsis
This work studies cross-site variability in 7 Tesla task fMRI measurements, collected as part of a “travelling heads” study. Participants were scanned at the five human UK 7 Tesla MRI sites, and results are presented from four of these sites. A motor-visual task was performed at each site with acquisitions matched as closely as possible. Despite some apparent differences in tSNR , we demonstrate that it is possible to achieve good agreement across sites. The %BOLD coefficient of variation of 0.1-0.2 across sites was similar to the within-site ranges. This work sets the foundation for multi-site 7 Tesla clinical trials.
Introduction
Whilst great progress has been made in ultra-high field fMRI to study brain function at fine spatial resolution, generally methods are optimized at a single site, and so do not necessarily translate to large population studies where multiple sites are often required for adequate subject recruitment. With a recent increase in installations of human 7 Tesla systems, there is an opportunity to establish the framework for multi-site 7 Tesla fMRI studies. However, an understanding of the inter-site variability of such measurements is required to allow fMRI data to be combined across 7 Tesla sites. We aim to characterize inter-site variability in a standard motor-visual task fMRI design through a “travelling heads” study.Methods
Ten healthy subjects (32±6 years; 3 female/ 7 male) participated in a “travelling heads” study. To assess inter-site repeatability, the same protocol was repeated at four sites, using three different 7 Tesla whole-body MRI systems (Site 1: Siemens Terra; Site 2: Siemens Magnetom; Site 3: Philips Achieva; Site 4: Siemens Magnetom). The same model volume transmit, 32-channel receive head coil (Nova Medical) was used at each site. In addition, eight of the subjects returned to a single site an additional four times (two subjects per site), to assess intra-site repeatability.
Motor-visual task: 4 minutes of 20s ON/ 20s OFF, iso-luminant 2Hz reversing radial checkerboard. Visual angles were 14°/19°/20°/24° for Sites 1-4. The motor task was a unilateral fingers-to-thumb motion, visually paced at 2Hz and alternating between left and right hand movement across consecutive ON periods. Gradient-echo EPI fMRI protocol: 56 slices, 1.5mm isotropic, TR 2s, TE 25ms, multiband1 2, echo spacing 0.68/0.78ms Siemens/Philips. Spin-echo EPI scans were acquired with matched and reversed phase-encode direction, for distortion correction. 2D FLASH (0.75x0.75x1.5mm, TE 10ms, TR 1100ms) and MPRAGE (0.7mm isotropic, TR/TE/TI/fa 2200/3.05/1050ms/7°) datasets were acquired for image registration.
Data processing consisted of motion correction (FSL MCFLIRT2), distortion correction (FSL TOPUP3), task activation was assessed using FSL FEAT4, FDR-corrected pFDR<0.01. Visual activation was restricted to the occipital lobe, left hand motion to the right pre- and post-central gyri and right hand motion to left pre- and post-central gyri (Harvard-Oxford atlas5). Coefficient of variation (CV) in BOLD percentage change and activation extent was calculated across the four sessions between sites for inter-site variation, or the four sessions at the same site for intra-site variation.
Results
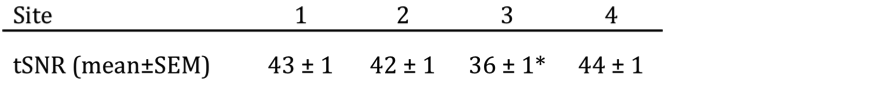
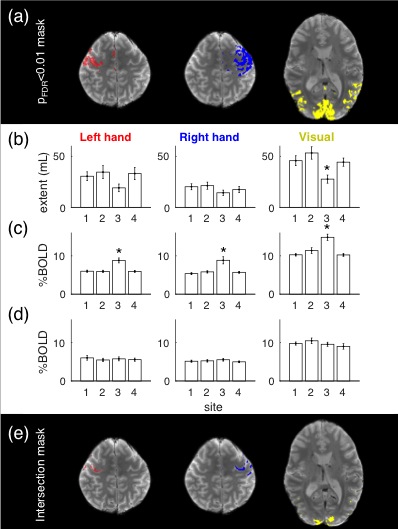
Temporal SNR (tSNR) was consistent across Sites 1, 2 and 4, but significantly lower at Site 3 (Table 1). Figure 1 compares activation extent and %BOLD across sites for the left-hand motion, right-hand motion and visual stimulation contrasts. Inter-subject variability in activation extent is large compared to inter-site variability, except for Site 3, which showed a lower extent for the visual contrast. %BOLD over a session-specific activation region of interest (ROI) was significantly higher at Site 3 across all three contrasts. To compare %BOLD across sites, a common ROI based on an intersection mask across all four sites was generated. %BOLD over this intersection ROI (Fig.1(d)) did not differ significantly across sites for any of the contrasts.
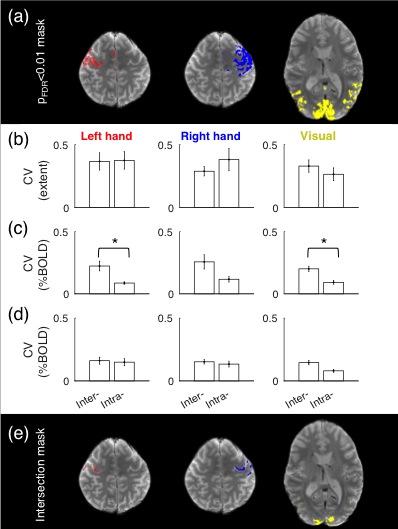
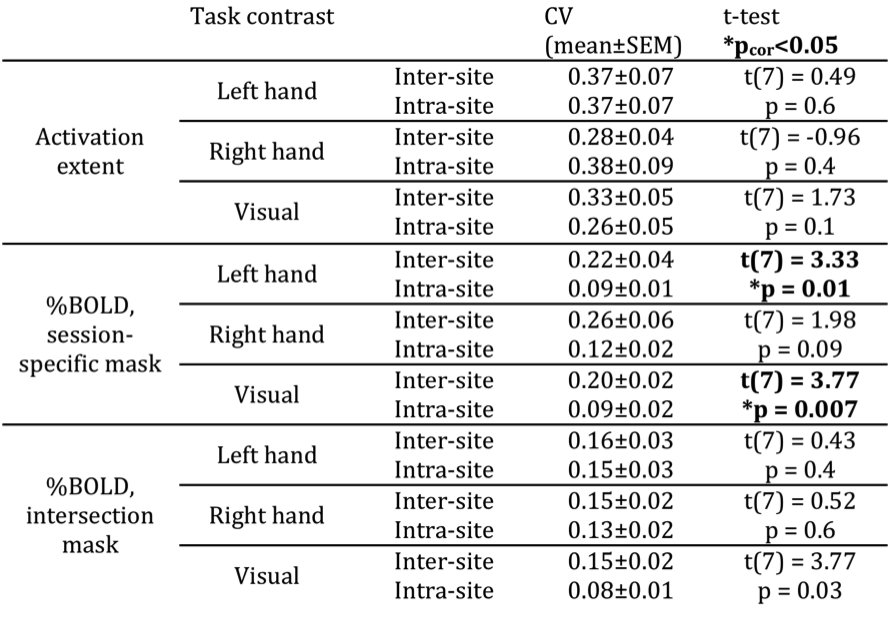
Inter-site and intra-site CV for activation extent, %BOLD using a session-specific ROI and %BOLD using the intersection ROI is presented in Figure 2 and Table 2. Activation extent CV values (mean across subjects) range from 0.26 – 0.38 across contrasts and inter- and intra- site, whilst there is no significant difference between inter- and intra-site CV. %BOLD CV values range from 0.08 – 0.26, with the session-specific activation mask leading to a significant difference between %BOLD inter- and intra-subject CV in the left hand motion and visual stimulation contrasts. This difference is not apparent for the intersection ROI.
Discussion
We present inter-site 7T task fMRI repeatability measurements and compare these to intra-site repeatability in the same subjects. Inter- and intra-site activation extent CV values were similar, whereas differences occurred in %BOLD measurements. These results highlight the issue that session-specific functional ROIs are sensitive to tSNR, which may vary across sites, leading to differences in ROI size and %BOLD measured. We demonstrate that by using a common ROI across sites, similar %BOLD values and CVs can be achieved. However, an intersection ROI is only available in a “travelling heads” study, so other standardized methods, such as threshold-free cluster enhancement6 and anatomical-based ROI definitions, will be explored in future work.Conclusion
We demonstrate that with careful ROI selection, inter-site CVs are similar to intra-site levels. This is a first step towards establishing a framework for large sample size fMRI clinical studies across multiple 7 Tesla sites.Acknowledgements
We acknowledge the UK Medical Research Council for funding support (MR/N008537/1). CTR is funded by a Sir Henry Dale Fellowship from the Wellcome Trust and the Royal Society [098436/Z/12/B]. The Siemens sites used EPI multiband sequence software provided by University of Minnesota Center for Magnetic Resonance Research.References
1. Moeller S, Yacoub E, Olman C et al. Multiband multislice GE-EPI at 7 tesla, with 16-fold acceleration using partial parallel imaging with application to high spatial and temporal whole-brain fMRI. Magn Reson Med. 2010; 63:1144-1153.
2. Jenkinson, M., Bannister, P., Brady, J. M. et al. Improved optimisation for the robust and accurate linear registration and motion correction of brain images. NeuroImage. 2002; 17(2), 825-841.
3. Andersson J, Skare S and Ashburner B. How to correct susceptibility distortions in spin-echo echo-planar images: application to diffusion tensor imaging. NeuroImage. 2003; 20:870-888.
4. Smith S, Jenkinson M, Woolrich M et al. Advances in functional and structural MR image analysis and implementation as FSL. NeuroImage. 2004;23(S1):208-219.
5. Desikan RS, Ségonne F, Fischl B et al. An automated labeling system for subdividing the human cerebral cortex on MRI scans into gyral based regions of interest. NeuroImage. 2006; 31:968-80.
6. Smith SM and Nichols TE. Threshold-free cluster enhancement: addressing problems of smoothing, threshold dependence and localisation in cluster inference. Neuroimage 2009; 44:83-98.
Figures