3935
MR Imaging of Current Vector Fields Induced by TDCS1University of Michigan, Ann Arbor, MI, United States
Synopsis
The present study introduces a method to measure the full current density vector field induced by a transcranial direct current stimulation (TDCS) device. Our proposed method uses MRI to measure components of the magnetic field with the phantom/head in different positions. We introduce the theory and demonstrate the method on a current phantom and a human volunteer.
Purpose
Transcranial direct current stimulation (TDCS) allows researchers to modulate neuronal activity non-invasively by running small direct currents through the brain. In its current implementation, the dosage and localization of the treatment dose is not well characterized and a major source of variability in TDCS work. Previous work to determine the dosage is largely based on simulations and assumptions about tissue conductivity, e.g. [1]. The present study introduces a method to directly measure the full current density vector field induced by the TDCS device by leveraging previous work on magnetic field vector imaging [2] and unidirectional current imaging [3].Methods
Previous work demonstrated that all three components of the magnetic vector fields acting on an object can be measured by rotating the object and measuring multiple projections of the magnetic field onto the scanner’s main axis [2]. Basic electromagnetic theory states that direct current density vector (J) can be calculated from its induced static magnetic field (B) by
$$ \nabla \times B = J \cdot \mu $$
Where μ is the permeability constant of the medium. Current is computed from current density and the surface area of the pixel in each orientation.
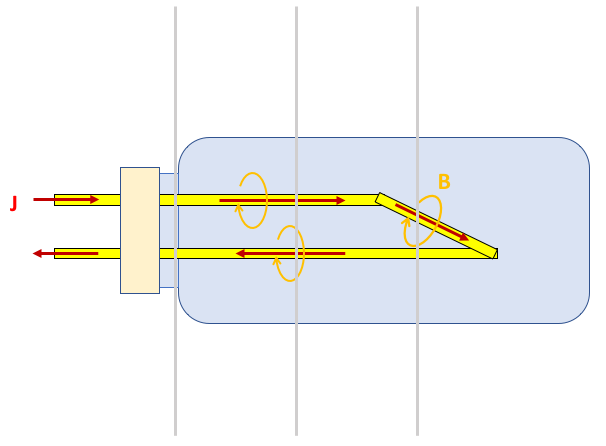
Phantom Experiments. constructed a current phantom by inserting an 8 mm diameter tube inside an agar gel container. The tube was filled with a saturated saline solution. Electrodes were inserted in the ends of the tube and connected to a constant current supply (Keithley 6221). (see figure 1) .
We imaged the phantom on a 3T Scanner using a birdcage quadrature coil using a spiral sequence (matrix = 64 x 64 x 64 isotropic voxels, voxels size = 3 mm, 12 interleaves, TR/TE = 2000/8 ms, flip = 60 deg., bandwidth= 200 kHz ). The phantom was imaged in seven orientations twice: without and with a 2 mA current running through the central tube. The z-component of the magnetic field (Bz) was measured at each position by measuring the change in image phase between the current and no current conditions. Using rigid body realignment of the magnitude images (FLIRT, FSL), we obtained the rotation matrices corresponding to each Bz maps . These were used to solve for the whole magnetic vector field (see [2]). Equation 1 then yielded the current density vector field.
Human experiments. We scanned a human volunteer with MR-compatible TDCS electrodes (Soterix) on each side of the forehead and collected pairs of spiral images with and without direct current (2.5 mA) at seven orientations of the head. The spiral sequence used similar parameters as before (matrix = 64 x 64 x 40 voxels, voxels size = 3.75x 3.75 x 4 mm, 6 interleaves, TR/TE = 2000/8 ms, flip = 60 deg., bandwidth= 200 kHz, 6 time frames) but we collected a short time series each time to identify and remove phase drifts. As before, we realigned the images and calculated magnetic vector fields from their measured projections. We used those to calculate the current density vector fields.
Results
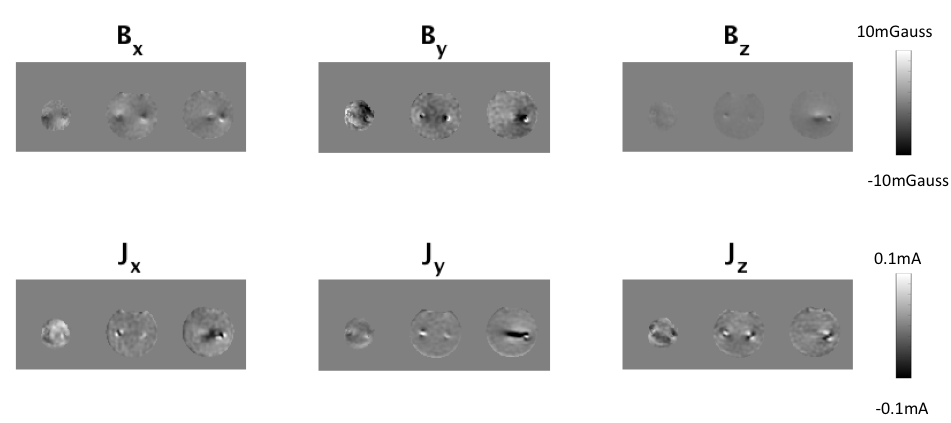
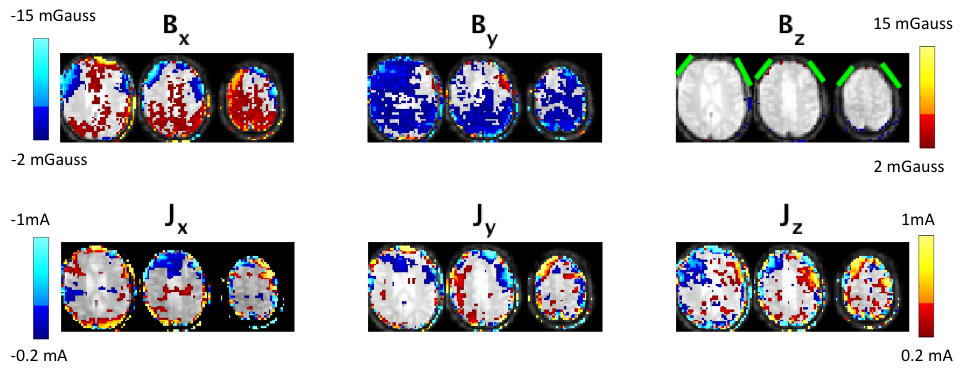
Figure 2 shows three slices of the maps of the each of the three components of the magnetic field (top row) and current density field (bottom row) calculated from the current phantom. Both the magnetic and current fields appear as expected. However, upon closer inspection, the discontinuities of the image at the boundaries between the agar and the saline tube cause the curl operator to be unstable and yield artefactual values. Figure 3 shows a slice through the plane where the electrodes were located on the forehead. The location of the electrodes is indicated by the green lines. The images suggest that the current path between the electrodes is not straight, but rather follows primarily the surface of the head.Discussion
A limitation of this method is that discontinuities and singularities in the magnetic field can make the computation of the current vector fields numerically unstable. Although this is problematic in the phantom, the fields are smoother in brain tissue.
Also, magnetic field drifts from respiration and scanner instability were apparent at the base of the brain, regardless of whether a current was applied. These drifts were compensated by aquiring a short time series at each orientation of the object.
The proposed method can be used to target brain regions more accurately in TDCS experiments and/or measure the applied dose to the tissue of interest. Further research is needed to validate it and overcome the above limitations.
Acknowledgements
NSF grant: 1658268References
[1] Huang, Y.Z. et al., 2005. Theta burst stimulation of the human motor cortex. Neuron, 45(2), pp.201–206.
[2] Hernandez-Garcia, L., Lee, S. & Grissom, W., 2007. An approach to MRI-based dosimetry for transcranial magnetic stimulation. NeuroImage, 36(4), pp.1171–1178.
[3] Scott, G.C. et al., 1991. Measurement of nonuniform current density by magnetic resonance. IEEE transactions on medical imaging, 10(3), pp.362–74.
Figures