3929
Live figures in BioImage Suite Web for improved results, visualizations, and data transparencyDustin Scheinost1, Zachariah Saltzman1, Cheryl Lacadie1, Haley Garbus1, John Onofrey1, and Xenophon Papademetris1
1Yale School of Medicine, New Haven, CT, United States
Synopsis
Figures of neuroimaging results are typically static. In other words, these figures only show the slices and statistical information that the creator of the figures previously selected. However, other researchers may want to visualize other information. Here, we present “live figures” using the BioImage Suite Web (BISWeb) software. “Live figures” represent an encapsulation of all information used to make the figure (i.e. images, slice, thresholds, colormap, etc) that is than saved to a file and can be loaded back into BISWeb. The only requirement to view these “live figures” is a modern web-browser. No other software needs to be installed.
Introduction
In functional MRI or other neuroimaging modalities, researchers—once they are done with their analyses—create figures to share their results. These figures (e.g. png and tiff) are static in that they show only pre-selected slices and statistical thresholds. If visualization of different slices or thresholds is desired, the researcher would need to create and share a new figure. Here, we describe a solution to this problem called “Live Figures” using the BioImage Suite Web (BISWeb; https://bioimagesuiteweb.github.io/webapp/) software. In BISWeb, researchers can create a dynamic (or “live”) figure that allows the recipient/viewer to interact with the figure and examine them as if they were sitting at your workstation when you created the figure.Methods
BISWeb is a set of web applications for image processing, analysis, and visualization designed mainly for human and animal fMRI. BISWeb uses a novel JavaScript/WebAssembly architecture that eliminates the need to install software on local machines. BISWeb is written primarily in JavaScript, but uses C++ for computationally intensive processing by leveraging WebAssembly to make low-level C++ code accessible in web-based applications. All BISWeb modules store information about the algorithmic parameters utilized in analyses, as well as software version, operating system, date, and user data. Similarly, most of the tools in BioImage Suite Web have the ability to save the state of the entire application to a file and read it back in again. For example, in the overlay viewer you can load your data, create your visualizations and then save everything using the option “Save Application State” under the File Menu. The ability to save the application states creates our “live figures”. The live figures are stored in a JavaScript Object Notation (JSON) file. BISWeb works on most modern web-browsers and is developed and stable on Google Chrome.Results
BISWeb currently offers two versions of “live figures”: 1) standard overlays of statistical information on top of a template structural MRI in volume space (see: https://bioimagesuiteweb.github.io/webapp/overlayviewer.html), and 2) viewing connectome-based results as circle plots and 3D surfaces (see: https://bioimagesuiteweb.github.io/webapp/connviewer.html). A video tutorial of the “live figures” can be viewed at the BISWeb YouTube channel (https://www.youtube.com/watch?v=zWS68aOWUBQ). An online manual for the overall application state feature in BISWeb can be found at: https://bioimagesuiteweb.github.io/bisweb-manual/tools/advanced.html. “Live figures” are larger in terms of file size than standard compressed tiffs or png files and range from 10-30 megabytes in size depending on the images used to create them. The only software needed to create or view these live figures is a modern web-browser. No other software needs to be installed. As such, they are fully cross-platform compatible, working with macOS, Windows, and Linux. “Live figures” also work on mobile devices like tablets and smart phones.Discussion
We present “live figures” using BISWeb. This methodology will enable the sharing of interactive result figures (i.e. not simply static snapshots) for others to interrogate, consistent with open science principles. A key complement of this work is that BISWeb can be used via a web-browser with no need to install additional software. As such, anyone with a “live figure” JSON file can view, interact, and modify a figure on nearly any device including tablets and smart phones and with nearly any operating system (Android, Windows, iOS, macOS, Linux). By sharing all the underlying data used to make a figure, in addition to the standard figure, “live figures” will help promote more transparent results.Conclusion
"Live figures" in BISWeb offers a new tool for visualization and dissemination of results in a transparent, open-science manner.Acknowledgements
We gratefully acknowledge support from the NIH Brain Initiative under grant R24 MH114805 (Papademetris X. and Scheinost D. PIs, Dept. of Radiology and Biomedical Imaging, Yale School of Medicine.)References
No reference found.Figures
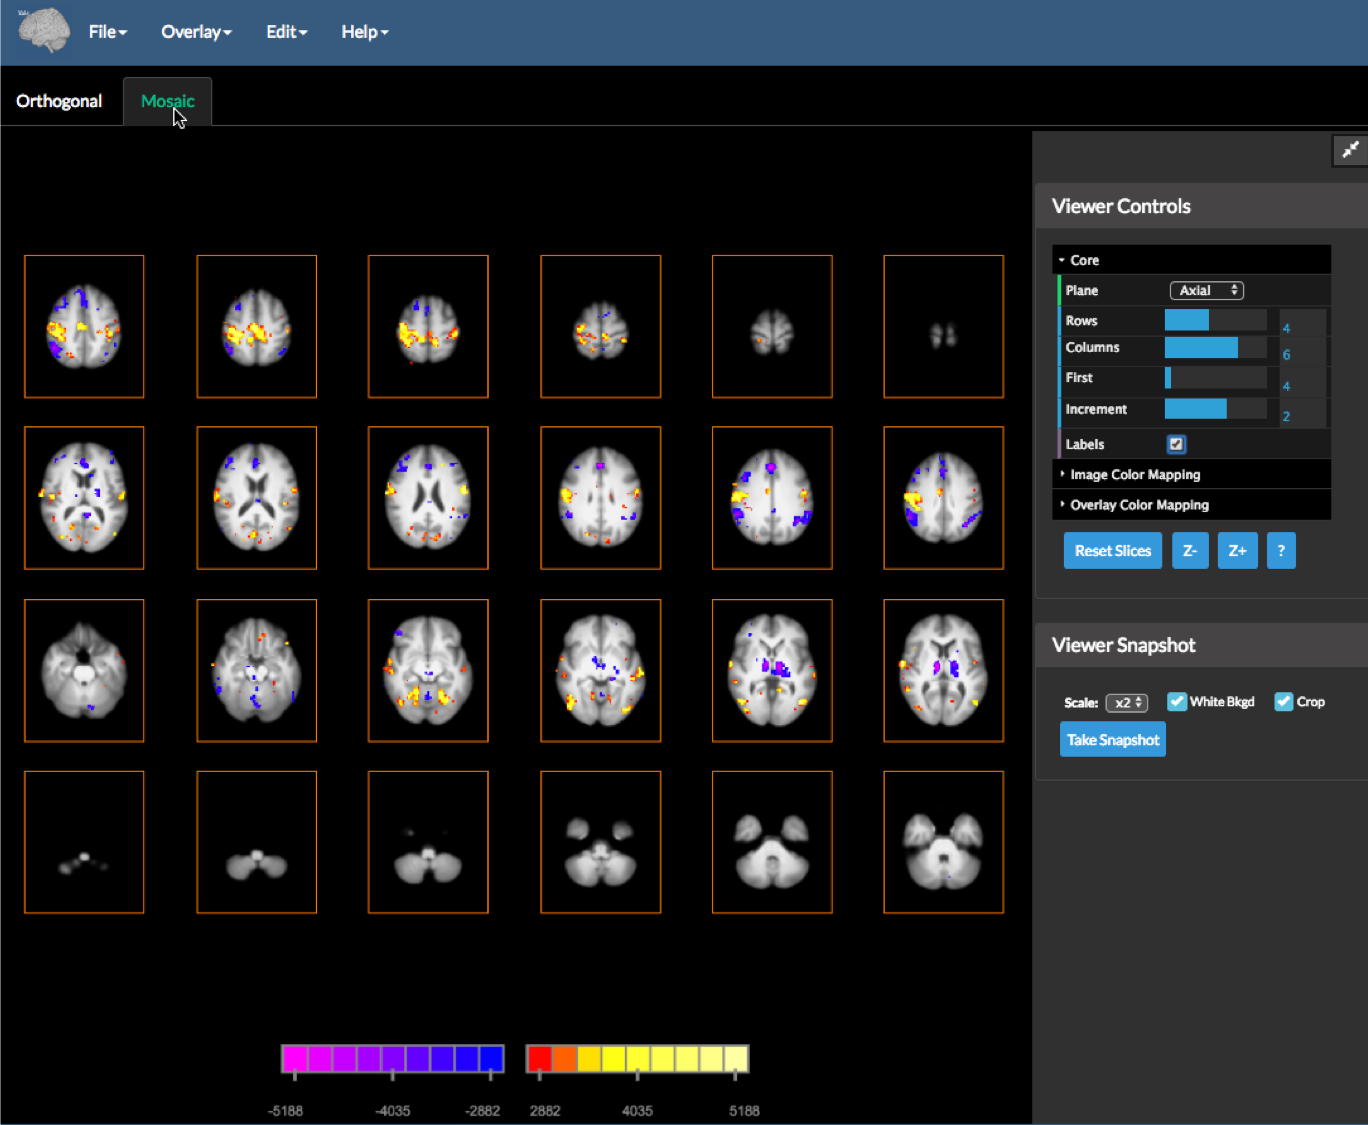
Example of the overlay view displaying slices of brain activation. Live figures can be made with this application.
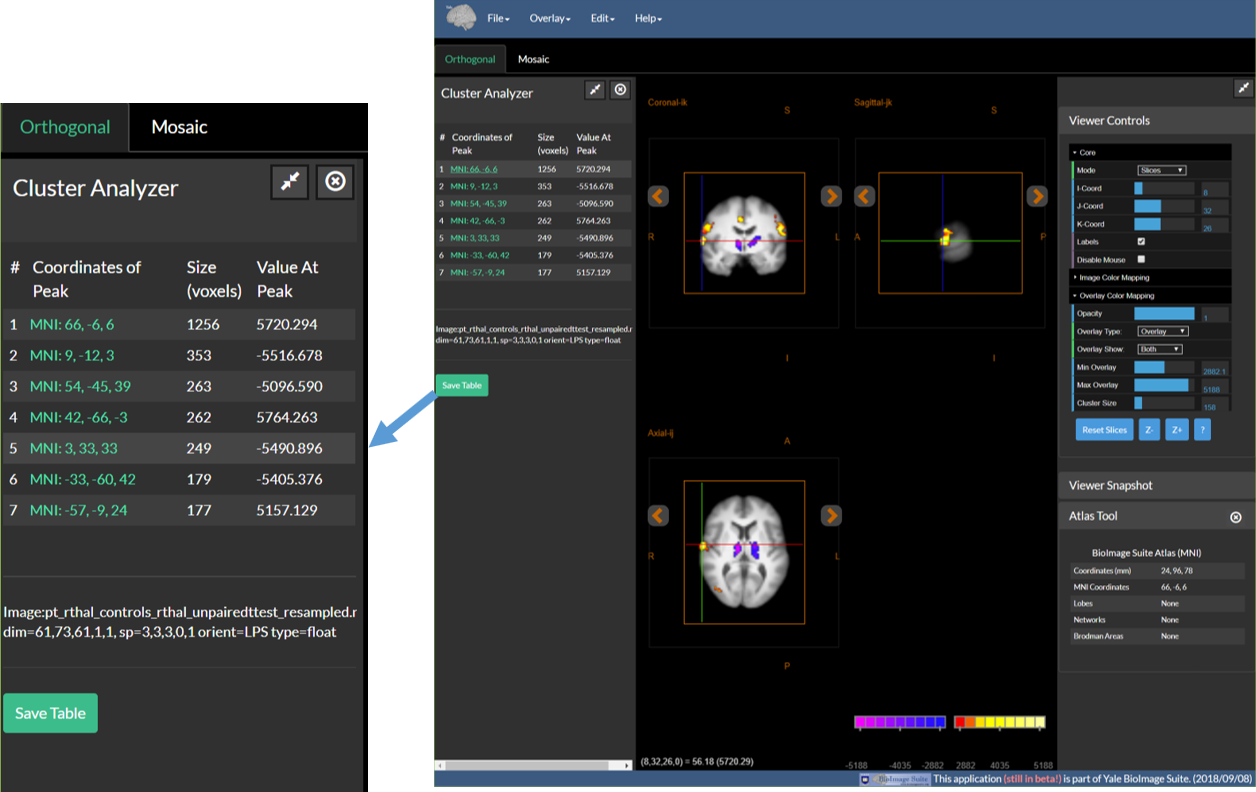
3-slice viewer linked to the slice viewer in Figure 1. These two veiwers are linked such that any changes (such as colormap changes) in one will be automatically applied to the other. Live figures can be made with this application.
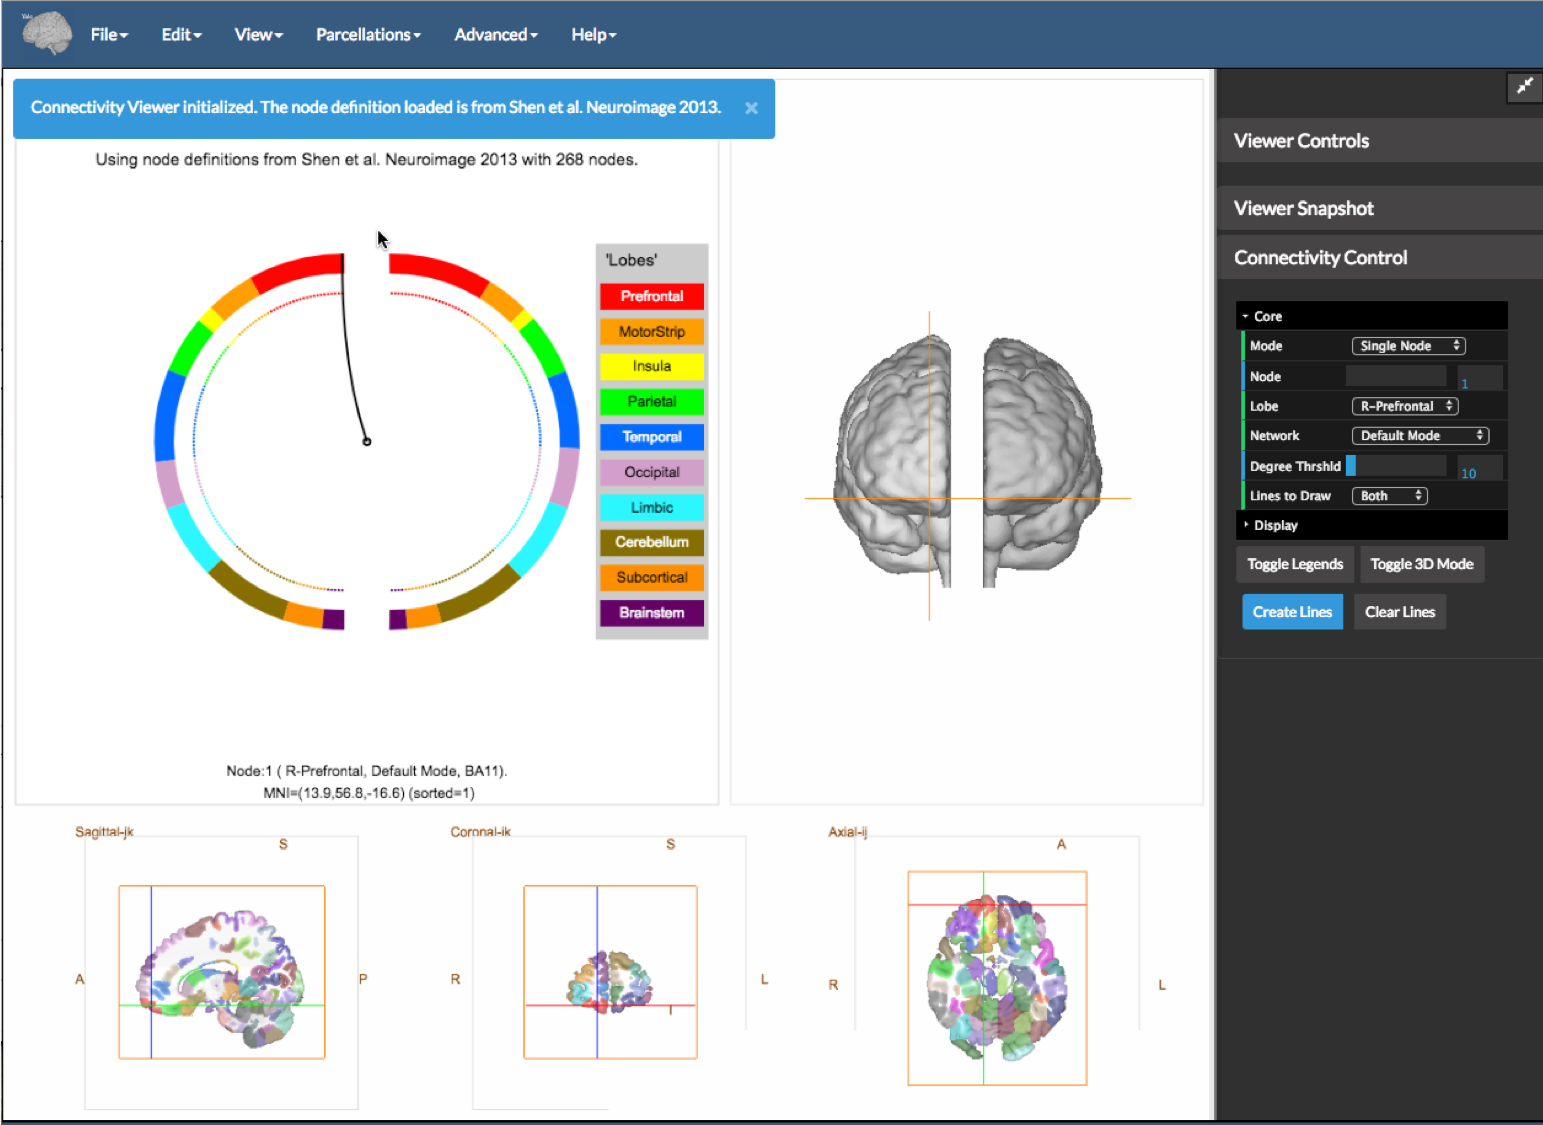
The connectivity viewer can be used to display important edges in a connectome. Live figures can be made with this application.
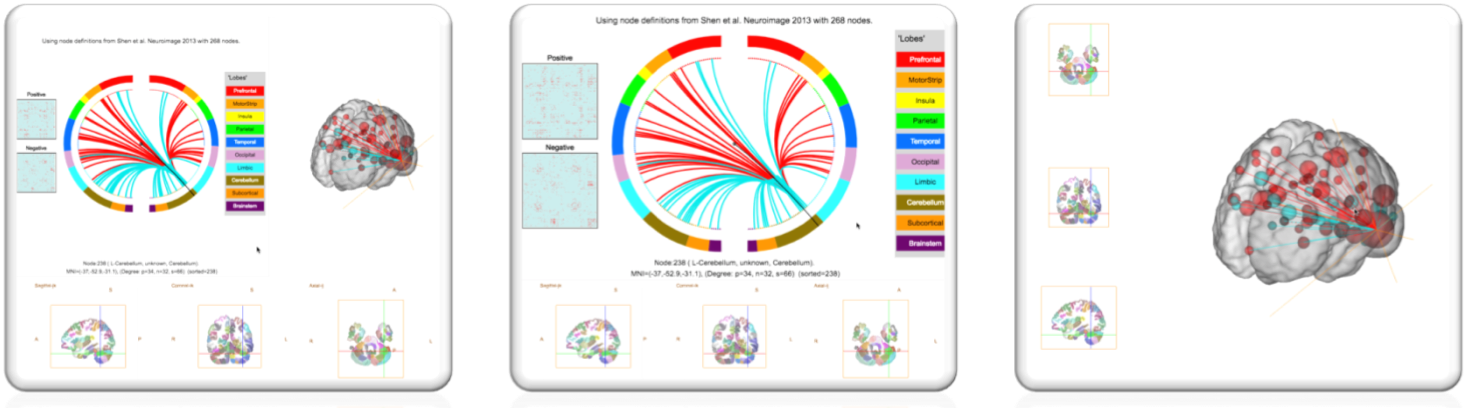
The connectivity viewer can be configured to show several different visualizations of connectomes. Live figures can be made with this application.