3926
Schizophrenia Patients Exhibit Aberrant Phase-Space Embedding of CEN/DMN Interaction1Department of Electrical and Computer Engineering, University of California, Riverside, Riverside, CA, United States, 2Department of Bioengineering, University of California, Riverside, Riverside, CA, United States
Synopsis
A proper method for distinguishing Schizophrenia (SZ) patients from people belonging to normal controls is invaluable for diagnostics. Standard techniques of identifying SZ patients include a variety of clustering-based methods. For example, those based on
INTRODUCTION
Central executive network (CEN) and default mode network (DMN) are a pair of anticorrelated networks1. Under cognitive demanding tasks, CEN recruits necessary cognitive resources and exhibits high BOLD signal in fMRI images. In contrast, DMN is more active under task-free or resting condition. While both CEN and DMN abnormalities have been associated with schizophrenia individually2, whether there is an alteration in the interaction of the two networks remains largely unknown. The present study examines the interaction using phase-space embedding of resting state fMRI data.
METHODS
Network interaction. One hundred and twenty one normal control (NC) subjects and 50 age- and sex-matched schizophrenia (SZ) patients from the UCLA Consortium for Neuropsychiatric Phenomics LA5c Study were included in the analysis. Standard prepossessing was performed on the rfMRI data using FSL. Group CEN and DMN maps were then identified using concatenated group ICA analysis implemented in FSL MELODIC. Time courses of individual CEN and DMN components was acquired using dual regression analysis. The time series were then converted to percentiles to reflect the relative activity strength across the scan. The interaction between the two networks was defined as the product of percentile time series:
Tt=Dt*Ct,t=1,...n (1)
where n is the total number of samples points, Dt and Ct represent DMN and CET percentile time series respectively. Phase-space embedding. Since phase space has the same dynamic property as the underlying system4, we reconstructed the phase space of the interaction time series Tt for each subject. For a given time series, phase-space embedding results in m time-consecutive variables in the new space and each variable contains a series of delayed points with interval of τ. Specifically, the embedding Yl of the interaction time series Tt is constructed as follows:
Y=[T1...T1+(m-1)τ;... ... ...; TK ... Tn ](2)
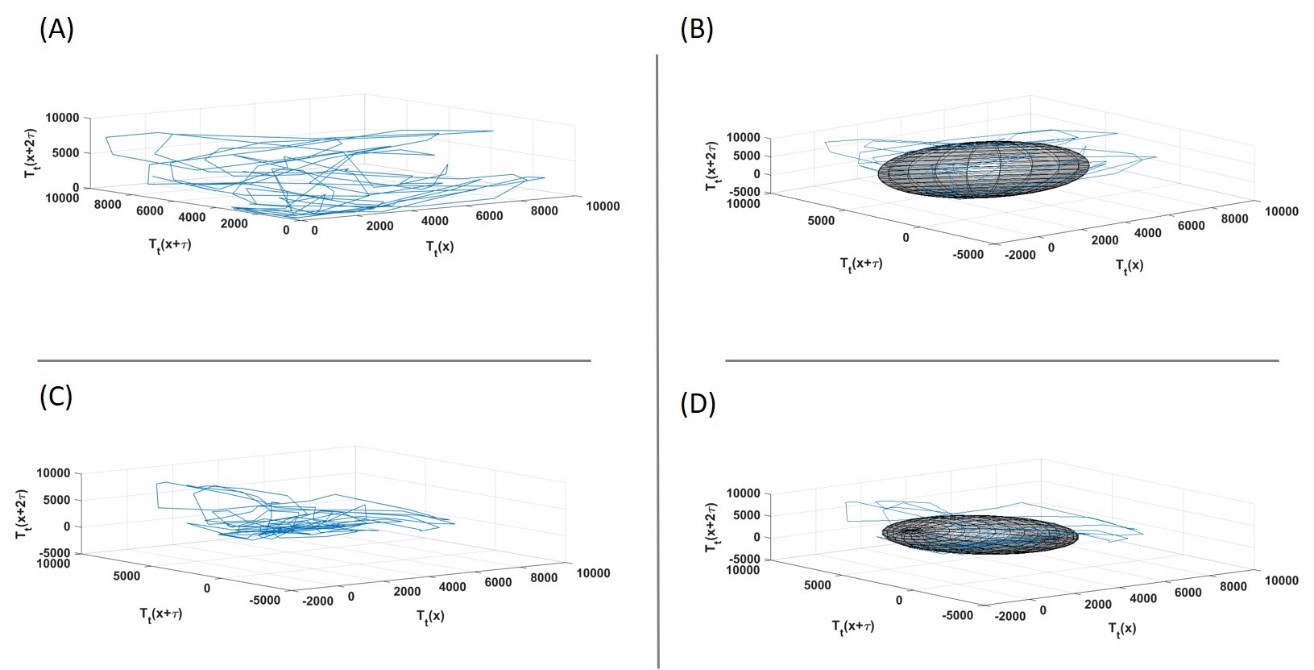
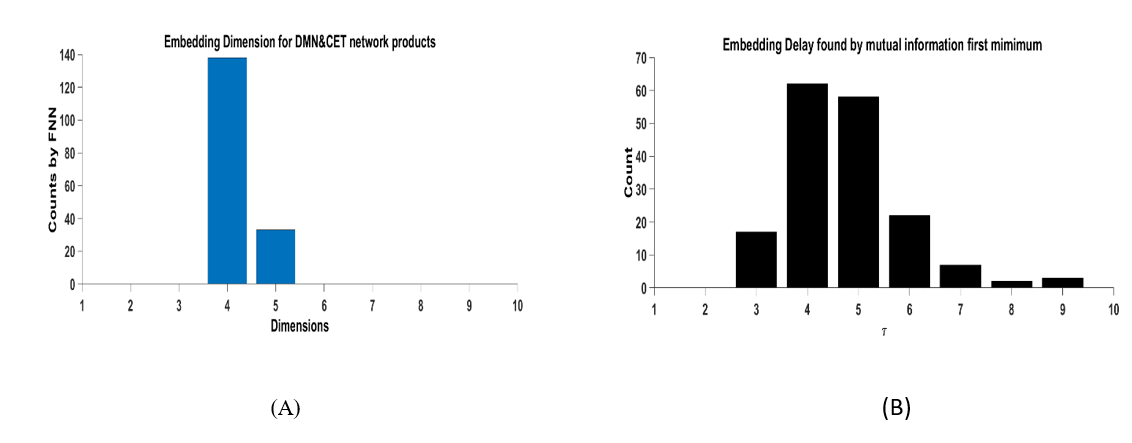
Where m is the embedding dimension, is the delay, n is the number of points in the original time series, and K is the length of new variables, which equals n-(m-1)τ. The embedding dimension m can be determined by the false nearest neighbor (FNN) algorithm, and the parameter delay τ can be determined by minimizing mutual information between reconstructed new variables. Feature extraction of the embedding space. Followed by Seraj et al., we obtained the moment invariant features in the discriminant matrix D, including mean, standard deviation and major minors4, and compare them between NC and SZ using ANOVA. As an illustration, Figure 1 shows two phase-space embedding and their related ellipsoid fitting. It can be clearly seen that smaller first order major minor of matrix D corresponds to smaller ellipsoid and smaller phase-space compacity.
RESULTS
Embedding parameters. The embedding dimension m and the time delay τ based on 121 healthy control subjects and 50 schizophrenia subjects are depicted in Fig 2.(A) and (B) are optimal settings for this study.
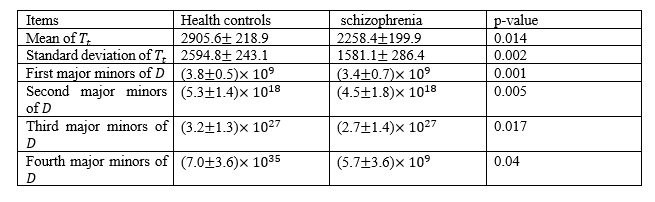
With the optimal parameter setting, SPSS ANOVA analysis showed significant difference between the two groups. Post-hoc analysis using LSD revealed that the schizophrenia group had smaller values in all features, compared to the control group. To exclude the possible contamination of percentiling data, we repeated the whole pipeline using processed BOLD residuals rather than the percentile data for network interaction, and the results were similar.
Discussion and Conclusion
In this study, we investigated the interaction of two key brain networks, CEN and DMN, using a phase-space embedding approach in schizophrenia. Using established methods in dynamic systems, we identified significant differences in moment invariant features between patients and normal controls, indicating phase-space embedding may provide an effective method to investigate the aberrant interactions between brain networks of patients.Acknowledgements
No acknowledgement found.References
1 Rashid, Barnaly, et al. "Classification of schizophrenia and bipolar patients using static and dynamic resting-state fMRI brain connectivity." Neuroimage 134 (2016): 645-657.
2 Allen, Elena A., et al. "A baseline for the multivariate comparison of resting-state networks." Frontiers in systems neuroscience 5 (2011): 2.
3 Poldrack, Russell A. "Region of interest analysis for fMRI." Social cognitive and affective neuroscience 2.1 (2007): 67-70.
4 Takens, Floris. "Detecting strange attractors in turbulence." Dynamical systems and turbulence, Warwick 1980. Springer, Berlin, Heidelberg, 1981. 366-381.
5 Sayed, Khaled, et al. "Characterization of phase space trajectories for Brain-Computer Interface." Biomedical Signal Processing and Control 38 (2017): 55-66.
6 Gorgolewski, Krzysztof J., Joke Durnez, and Russell A. Poldrack. "Preprocessed Consortium for Neuropsychiatric Phenomics dataset." F1000Research 6 (2017).
Figures