3923
Brain Activity Mapping Based on Low-Frequency Fluctuations of the Resting-State BOLD Signal: Comparing Healthy Elderly to Mild Cognitive Impairment and Alzheimer’s DiseaseSeyyed M. H. Haddad1, Christopher J. M. Scott2, Stephen R. Arnott2, Miracle Ozzoude2, Stephen C. Strother2, Sandra E. Black2, Michel J. Borrie1, Elizabeth Finger1, Maria C. Tartaglia2, Donna Kwan3, Derek Beaton2, Sean Symons4, Andrea Soddu1, Manuel Montero-Odasso1, and Robert Bartha1
1Western University, London, ON, Canada, 2University of Toronto, Toronto, ON, Canada, 3Ontario Brain Institute, Toronto, ON, Canada, 4Sunnybrook Health Sciences Centre, Toronto, ON, Canada
Synopsis
Our group recently introduced a neuronal activity (NA) metric based on a texture feature of the low-frequency fluctuations within the resting-state BOLD signal. This NA measure was associated with decreased glucose metabolism in mild Alzheimer’s disease (AD) measured by FDG-PET. To improve the sensitivity of this NA metric we introduce two variations achieved by rigorously regulating (using cross-correlation and cross-covariance) the amplitude of the BOLD signal oscillations derived from the constituent neuronal components. These novel metrics were evaluated in people with mild cognitive impairment and AD (N=14) demonstrating lower neuronal activity compared to healthy elderly (N=14).
Introduction
Blood-oxygenation level dependent (BOLD) functional MRI (fMRI) is sensitive to local magnetic field variations caused by fluctuations in the concentration of the paramagnetic deoxygenated hemoglobin within an active brain region.1,2 Recently, resting-state fMRI (rs-fMRI) was introduced to examine the functional connectivity of the brain at rest and has been applied in diverse pathophysiological conditions.3 While rs-fMRI is relatively simple in terms of pulse sequence and image acquisition, it has provided quantitative biomarkers for different neurodegenerative conditions.4–8 Furthermore, diverse neuronal activity (NA) measures were developed based on various resting-state BOLD signal features.9–12 Our group recently described a novel NA metric based on a first-order texture feature of the resting-state BOLD signal, specifically incorporating the standard deviation (SD) of low-frequency fluctuations.13 It was demonstrated that this measure of NA was associated with decreased glucose metabolism in mild Alzheimer disease (AD) measured by FDG-PET.13 The purpose of this study was to improve the sensitivity of this NA metric by introducing two more sophisticated metrics achieved by rigorously regulating the amplitude of the BOLD signal oscillations derived from the constituent neuronal components. We hypothesized that the novel NA metrics would be lower in people with mild cognitive impairment (MCI) and AD compared to healthy elderly.Theory and Methods
Two novel NA metrics were directly derived from the rs-fMRI signal. To this end, the rs-fMRI signal was pre-processed using FSL FEAT.13,14 Then the rs-fMRI signal was decomposed into independent components (ICs) using IC analysis (ICA).15 A data-driven neuronality test was applied to the ICs using a support vector machine (SVM) classifier to identify ICs with neuronal origins.10 The voxel-wise rs-fMRI signal and neuronal ICs were used to define NA measures as described in Figure 1. In the previously introduced metric13 a simple Hadamard product was used to measure the amplitude of each neuronal IC in the BOLD signal of each voxel, and the NA metric was proportional to the SD of this Hadamard product. Here, we introduce two more sophisticated and rigorous NA metrics by regulating the amplitude of the neuronal ICs in the voxel-wise rs-fMRI signals. Both new metrics were hypothesized to be proportional to the SD of the neuronal ICs. For the first metric, a cross-correlation function was used to accurately quantify similarity between the neuronal IC time-courses and the rs-fMRI signal. For the second metric, the cross-covariance was utilized to calculate similarity while eliminating the variability of the fMRI signal means from different brain voxels. This latter approach may increase measurement precision as it reflects exclusively fluctuations in the BOLD signal. These two new metrics were compared to the original,13 to determine which produced greater differences in NA between a group of healthy controls (N=14) from the Gait and Brain Study16 (aged 58-85, 71% female) and a group of 14 subjects with MCI and AD from the Ontario Neurodegenerative Disease Research Initiative (ONDRI) (aged 57-86, 50% female). The rs-fMRI data were acquired on 3T Siemens scanners using single-shot echo planer imaging: voxel dimensions 3.5×3.5×3.5 mm3, flip angle=70˚, TE=30 ms, TR~2400 ms, and matrix size 64×64×41.Results
All metrics showed higher average NA in gray matter (GM) compared to white matter (p<0.05, two-tailed, repeated measures ttest). Using the Hadamard product and cross-correlation based metrics the average NA in GM was lower (p<0.05, one-tailed ttest) in AD/MCI compared to healthy elderly. Example NA maps in a healthy subject and an AD/MCI subject (Figure 2) calculated using the cross-covariance based NA metric demonstrate large differences across the brain. Normalized group average NA maps are provided for the healthy elderly (Figure 3) and for AD/MCI (Figure 4) showing lower activity in the AD/MCI subjects for all metrics. The percentage difference maps between the MCI/AD and healthy elderly groups (Figure 5) also demonstrate regional variability. The average percentage differences between these groups across the brain metrics was 34% based on the Hadamard product,13 35% based on the cross-correlation, and 29% based on cross-covariance.Discussion
The pattern of NA observed using the novel metrics defined in this study show greater activity in cortical GM compared to white matter as observed in our initial study, and as commonly observed with fluorodeoxyglucose positron emission tomography. Although showing smaller average differences between groups, the metric based on cross-covariance, may better highlight changes specific to the cortex.Conclusion
All three NA metrics derived from rs-fMRI showed ~30% lower average activity in the AD/MCI group compared to healthy elderly subjects. This novel approach to processing rs-fMRI data may have applications in the evaluation of neurodegenerative disease progression.Acknowledgements
This work was supported by the Ontario Brain Institute through the Ontario Neurodegenerative Disease Research Initiative (ONDRI). Dr. Haddad is supported by an ONDRI postdoctoral scholar fellowship. The Centre for Functional and Metabolic Mapping is supported by Brain Canada and the Canada First Research Excellence Fund (CFREF). The authors would like to thank all ONDRI participants including the ONDRI investigators and the ONDRI governing committees: executive committee; steering committee; publication committee; recruiting clinicians; assessment platforms leaders; and the ONDRI project management team. For a full list of the ONDRI investigators, please visit: www.ONDRI.ca/people. The ONDRI project is funded by the Ontario Brain Institute through the Government of Ontario with matching funds provided by participating hospital and research institute foundations, including the Baycrest Foundation, Bruyère Research Institute, Centre for Addiction and Mental Health Foundation, London Health Sciences Foundation, McMaster University Faculty of Health Sciences, Ottawa Brain and Mind Research Institute, Queen’s University Faculty of Health Sciences, Providence Care (Kingston), Sunnybrook Health Sciences Foundation, the Thunder Bay Regional Health Sciences Centre, the University of Ottawa Faculty of Medicine, and the Windsor/Essex County ALS Association. The Temerty Family Foundation provided the major infrastructure matching funds.References
1. Ekstrom A. How and when the fMRI BOLD signal relates to underlying neural activity: the danger in dissociation. Brain Res Rev. 2010;62(2):233-244. doi:10.1016/j.brainresrev.2009.12.004. 2. Bren KL, Eisenberg R, Gray HB. Discovery of the magnetic behavior of hemoglobin: A beginning of bioinorganic chemistry. Proc Natl Acad Sci U S A. 2015;112(43):13123-13127. doi:10.1073/pnas.1515704112. 3. Smitha K, Akhil Raja K, Arun K, et al. Resting state fMRI: A review on methods in resting state connectivity analysis and resting state networks. Neuroradiol J. 2017;30(4):305-317. doi:10.1177/1971400917697342. 4. Hafkemeijer A, Möller C, Dopper EGP, et al. A Longitudinal Study on Resting State Functional Connectivity in Behavioral Variant Frontotemporal Dementia and Alzheimer’s Disease. Zhou J, ed. J Alzheimer’s Dis. 2016;55(2):521-537. doi:10.3233/JAD-150695. 5. Niethammer M, Feigin A, Eidelberg D. Functional neuroimaging in Parkinson’s disease. Cold Spring Harb Perspect Med. 2012;2(5):a009274. doi:10.1101/cshperspect.a009274. 6. Hosseini M-P, Tran TX, Pompili D, Elisevich K, Soltanian-Zadeh H. Deep Learning with Edge Computing for Localization of Epileptogenicity Using Multimodal rs-fMRI and EEG Big Data. In: 2017 IEEE International Conference on Autonomic Computing (ICAC). IEEE; 2017:83-92. doi:10.1109/ICAC.2017.41. 7. Golbabaei S, Vahid A, Hatami J, Soltanian-Zadeh H. Classification of Alzheimer’s disease and mild cognitive impairment: Machine learning applied to rs-fMRI brain graphs. In: 2016 23rd Iranian Conference on Biomedical Engineering and 2016 1st International Iranian Conference on Biomedical Engineering (ICBME). IEEE; 2016:35-40. doi:10.1109/ICBME.2016.7890925. 8. Binnewijzend MAA, Schoonheim MM, Sanz-Arigita E, et al. Resting-state fMRI changes in Alzheimer’s disease and mild cognitive impairment. Neurobiol Aging. 2012;33(9):2018-2028. doi:10.1016/J.NEUROBIOLAGING.2011.07.003. 9. Calhoun VD, Adali T, Pearlson GD, Pekar JJ. A method for making group inferences from functional MRI data using independent component analysis. Hum Brain Mapp. 2001;14(3):140-151. doi:10.1002/hbm.1048. 10. Demertzi A, Gómez F, Crone JS, et al. Multiple fMRI system-level baseline connectivity is disrupted in patients with consciousness alterations. Cortex. 2014;52:35-46. doi:10.1016/j.cortex.2013.11.005. 11. Soddu A, Gómez F, Heine L, et al. Correlation between resting state fMRI total neuronal activity and PET metabolism in healthy controls and patients with disorders of consciousness. Brain Behav. 2016;6(1):n/a-n/a. doi:10.1002/brb3.424. 12. Aiello M, Salvatore E, Cachia A, et al. Relationship between simultaneously acquired resting-state regional cerebral glucose metabolism and functional MRI: A PET/MR hybrid scanner study. Neuroimage. 2015;113:111-121. doi:10.1016/j.neuroimage.2015.03.017. 13. Kazemifar S, Manning KY, Rajakumar N, et al. Spontaneous low frequency BOLD signal variations from resting-state fMRI are decreased in Alzheimer disease. Chen K, ed. PLoS One. 2017;12(6):e0178529. doi:10.1371/journal.pone.0178529. 14. Woolrich MW, Ripley BD, Brady M, Smith SM. Temporal Autocorrelation in Univariate Linear Modeling of FMRI Data. Neuroimage. 2001;14(6):1370-1386. doi:10.1006/nimg.2001.0931. 15. Ylipaavalniemi J, Vigário R. Analyzing consistency of independent components: An fMRI illustration. Neuroimage. 2008;39(1):169-180. doi:10.1016/J.NEUROIMAGE.2007.08.027. 16. Montero-Odasso MM, Sarquis-Adamson Y, Speechley M, et al. Association of Dual-Task Gait With Incident Dementia in Mild Cognitive Impairment. JAMA Neurol. 2017;74(7):857. doi:10.1001/jamaneurol.2017.0643.Figures
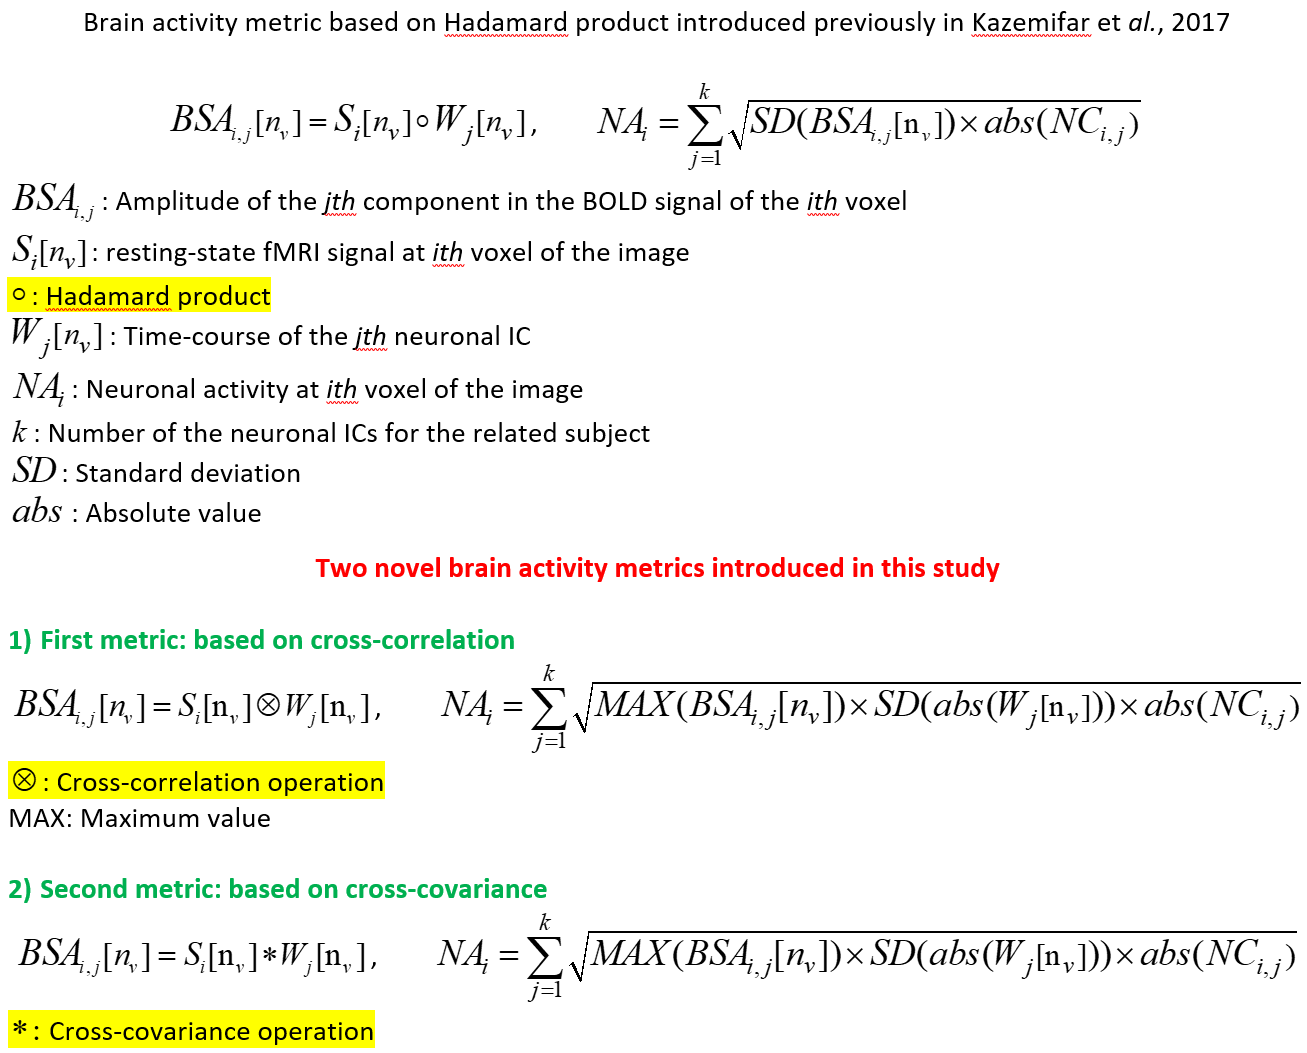
Fig. 1: Voxel-wise neuronal activity metrics introduced
in Kazemifar
et al., 2017 and here in this study.
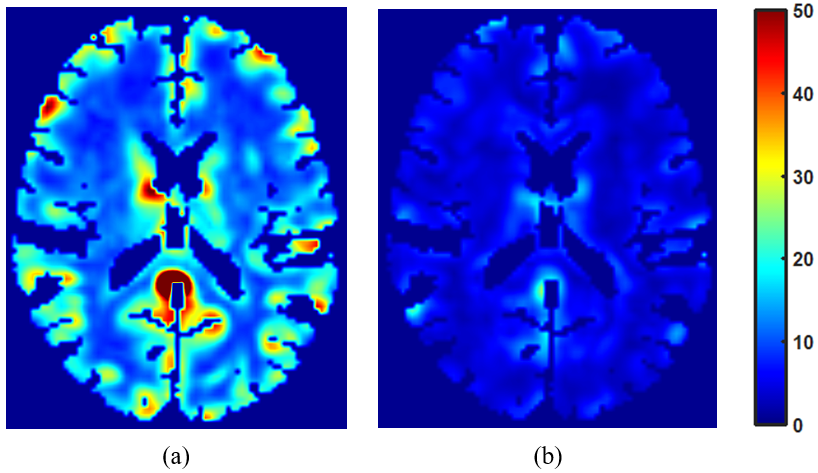
Fig. 2: Axial view of the neuronal activity maps in a normal sample subject (panel a) and in an
AD/MCI subject (panel b): The maps were based on the second NA metric using
cross-covariance. All the maps were normalized to the same scale
(0 to 160) based on the maximum NA value observed in both maps. Red shows
higher activity and blue shows lower activity.
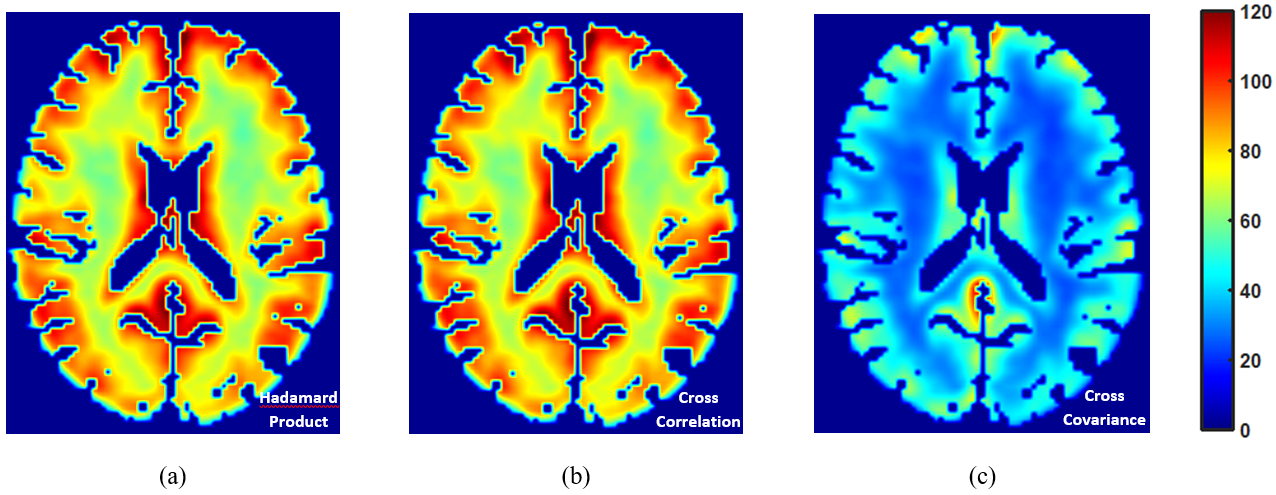
Fig. 3: Axial view of the average neuronal activity maps in the healthy elderly group.
Panel a: NA map based on Hadamard product in Kazemifar et al.,
2017, Panel b: NA map based on cross-correlation,
and Panel c: NA map based on cross-covariance. All the maps were
normalized to the same scale (0 to 160) based on the maximum value in both
groups. Red shows higher activity and blue shows lower activity.
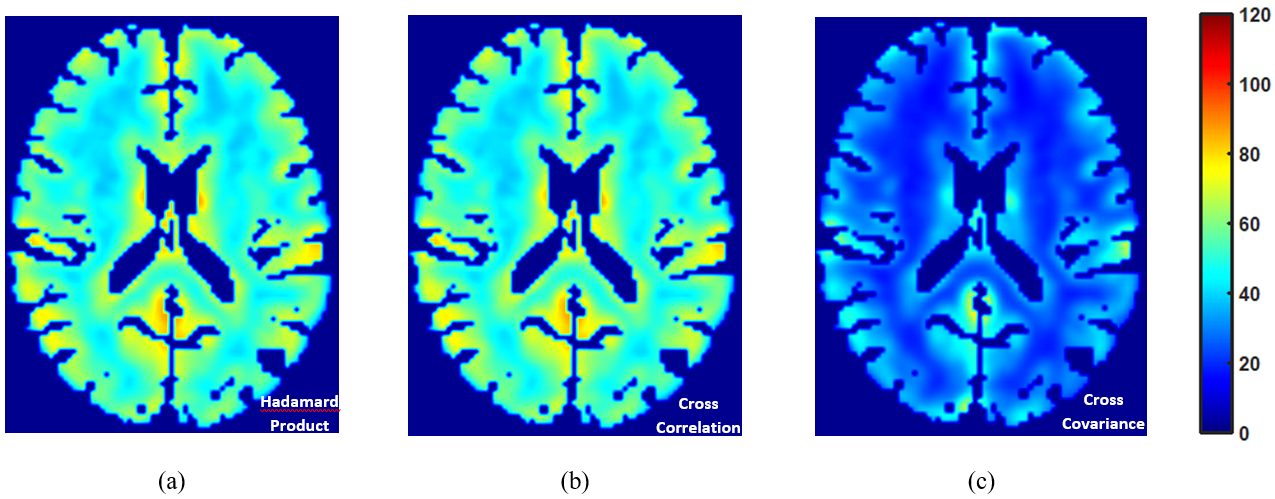
Fig. 4: Axial view of the average neuronal activity maps in the AD/MCI group.
Panel a: NA map based on Hadamard product in Kazemifar et al.,
2017, Panel b: NA map based on cross-correlation,
and Panel c: NA map based on cross-covariance. All the maps were
normalized to the same scale (0 to 160) based on the maximum value in both
groups. Red shows higher activity and blue shows lower activity.
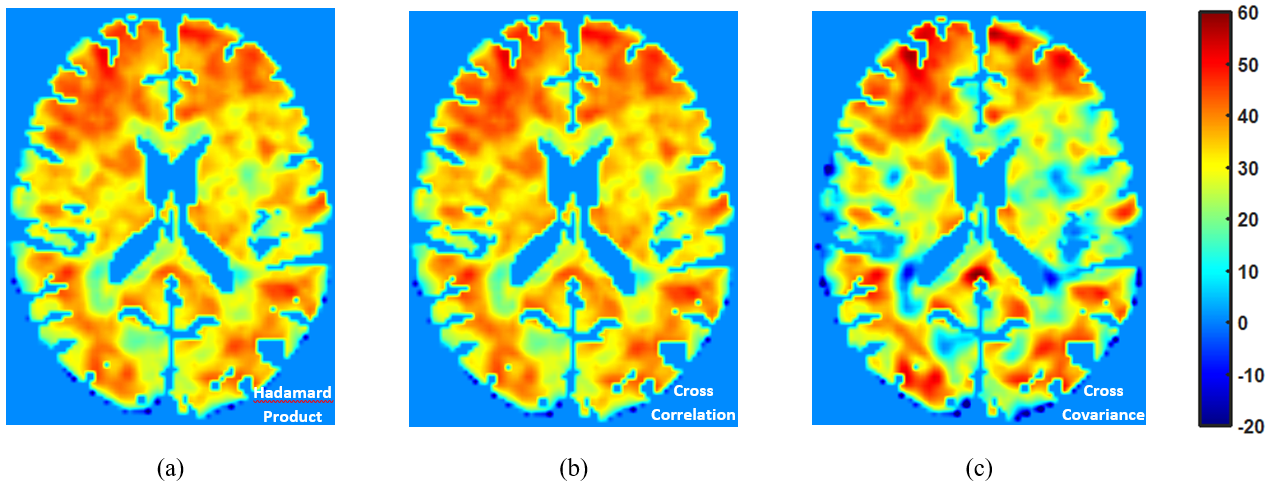
Fig. 5: Axial view of the percentage difference neuronal activity maps. Panel a: NA map based on Hadamard
product in Kazemifar et al., 2017, Panel b: NA map based on cross-correlation, and Panel
c: NA map based on cross-covariance. Positive values on the map indicate
higher activity in controls in comparison with AD/MCI group.